
When it comes to setting provider compensation at fair market value (FMV), the correct use of nationally published compensation and productivity survey data is paramount. In our experience, VMG Health has observed numerous misconceptions that led to an incorrect interpretation and application of these surveys for deriving compensation. Dive into some of the most common misunderstandings and discover solutions that will help you more accurately leverage these surveys and their data.
Compensation Misconceptions
It is not uncommon for health systems to set internal policies based on certain survey data percentiles. The most popular misconception is that any compensation under the 75th percentile is FMV. Alternatively, many believe that any compensation above the 90th percentile is impermissible.
Compensation Under the 75th Is Always FMV
Assuming that the 75th percentile is an acceptable baseline for compensation is a common misconception for many reasons. From a statistical perspective, the 75th percentile inherently means that 75% of respondents fall below that data point. If all physicians are compensated at the 75th percentile, the 75th percentile will move closer to the median the following year. In addition, if an established physician is producing well below the 75th percentile but compensated at the 75th, compensation is no longer aligned with productivity. This misalignment forces compensation ratios to be outside of market norms.
Compensation Above the 90th Is Never FMV
Paying over the 90th percentile does not automatically mean that compensation exceeds FMV. Statistically speaking, 10% of physicians operate at or above the 90th percentile within their specialty, and they should be compensated accordingly. Furthermore, there are compensation stacking instances where physicians with high levels of productivity, excess call coverage, and/or heavy administrative roles can receive aggregate compensation above the 90th percentile.
Lastly, in a July 2023 podcast, Lisa Wilson, Senior Technical Advisor at the Centers for Medicare & Medicaid Services (CMS), noted that it has never been CMS’ policy to set any parameters around compensation being below or above a certain percentile. The arrangement must be examined in its individual nature based on the specific facts and circumstances surrounding the arrangement. Contrary to popular belief, there is no government guidance to this effect.
While there are many instances that can lead to compensation at or above the 75th percentile (or even the 90th percentile), users of survey data should exercise caution when setting baseline policies of acceptable compensation amounts. As recommended by government experts, it is important to analyze the specific facts and circumstances of individual arrangements when setting compensation.
Ratio Misconceptions
For established providers and high producers, the objective of most FMV opinions is to align clinical compensation with production. The two most common productivity metrics used in compensation models are work relative value units (wRVUs) and professional collections. It then follows that many will look to productivity ratios such as compensation per wRVU and compensation-to-collections to set compensation for a particular provider.
Compensation per wRVU
Many argue that a high-producing provider should receive a commensurate percentile compensation per wRVU ratio to reward them for that production. However, the surveys calculate each metric independently from each other, so physicians producing at the 90th percentile are not necessarily receiving 90th percentile compensation per wRVU. Drawing from VMG Health’s extensive experience, physicians with higher effective compensation per wRVU ratios are often those operating under guarantees while working to ramp up their business. Their compensation may be around the median, but their starting production may be closer to the 25th percentile and growing, thus distorting their production ratios.
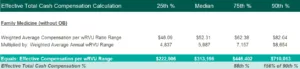
Keeping in mind that the goal is to align clinical compensation with production, if you look at most specialties and derive a compensation per wRVU ratio from each quartile, you will see that it rarely deviates far from a median compensation per wRVU ratio. The following chart illustrates data for Family Medicine, where each compensation quartile divided by the corresponding wRVU production yields a similar amount:

Additionally, if you apply compensation per wRVU ratios to corresponding wRVU production, you greatly disorient the relationship between compensation and production. The following chart illustrates this application for Family Medicine, where applying the same quartile ratios to productivity yields compensation well above the level of production.
Another common ratio misconception is that it is outside of FMV to compensate a provider over 100% of what they collect.
Compensation-to-Collections
Many people believe that a compensation-to-collections ratio should never exceed 100%. There are two problems with this thought:
- Not every reimbursement environment is the same.
- There are many coverage-based specialties that need to be subsidized to ensure adequate levels of coverage.
With pediatrics-based specialties, compensation-to-collections ratios are often above 100% because these types of practices usually deal with a higher Medicaid payer mix in which physicians have difficulty collecting an adequate amount relative to the work they perform.
In addition, it is common to find compensation to collections ratios above 100% with specialties that are more coverage based, like hospitalists or emergency medicine providers, because the hospital is required to staff these positions for whenever patients present, regardless of how productive the unit may be. The providers must still be compensated for the time they are onsite. In a low-activity shift, it could make sense to see a physician compensated at a higher amount than the revenue being brought in.
Survey Data Misconceptions
Survey Definitions
When it comes to the actual surveys themselves, many believe that all surveys request data the same way. With a number of provider compensation and productivity surveys to choose from, all surveys request and report the data with slight differences. Understanding the definitions reported by each survey is important to properly aligning the application of the surveys in tandem. The total cash compensation definition can differ between the surveys. MGMA, SullivanCotter, and AMGA all report slightly different definitions of what is requested in terms of total cash compensation (TCC).
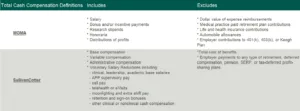
Because of the variance in these definitions, the TCC illustrated between these two surveys could be mismatched. Above all, it is important to take note of the potential differences in how the data is requested and adjust your interpretations of the data accordingly.
National vs. Regional Data
When determining an appropriate level of compensation for a particular provider, many prefer to focus on regional data over national data, as it “offers a better view into our specific market factors.” The big misconception here is in the assumption that regional data actually reflects a local market.
While this concept is good practice, variations in how surveys define “regions” make it difficult to illustrate using survey data alone. For example, if you were isolating regional data to apply for a provider in Texas, you would select the following from MGMA and SullivanCotter:

If you were attempting to align these two surveys based on regions, there would be different states included in each of the surveys.
In addition, the surveys report regions based on multiple states, and the data is not illustrated by any specific, geographic demographic. For example, both Dallas and Houston provider compensation data would be included in either the Southern or South Central regions depending on the survey, but the demographics and reimbursement vary greatly between these two cities. Because of these factors, it can be difficult to rely on any regional data in determining more pointed compensation specific to a client’s market. Instead, it is best to rely on national survey data and adjust the data based on supportable regional or market factors accordingly.
The VMG Health Advantage
The correct application of published provider compensation and productivity survey data is imperative to ensuring compensation for any provider is consistent with FMV. Misinterpretation of survey data can lead to compliance risks and potential challenges in demonstrating the reasonableness of provider compensation. Partnering with an experienced, independent valuation firm, like VMG Health, ensures the strongest compliance through our expert analysis and guidance.
With extensive experience in reviewing and interpreting compensation surveys, VMG Health offers the expertise organizations need to navigate complex regulatory requirements while maintaining compliance and operational integrity. Contact us today to learn more about how our services can support your organization’s needs.
Sources
SullivanCotter. (2024). 2024 Physician Compensation and Productivity Survey. https://sullivancotter.com/surveys/physician-compensation-and-productivity-survey/
MGMA. (2024). 2024 Provider Compensation Data Report. MGMA. https://www.mgma.com/data-report-provider-comp-2024
AAPCP. (2023). Healthcare alignment: Debunked – A discussion on fair market value and the 2020 Stark final rule [Audio podcast]. Retrieved from https://podcasts.apple.com/us/podcast/healthcare-alignment/id1689042806