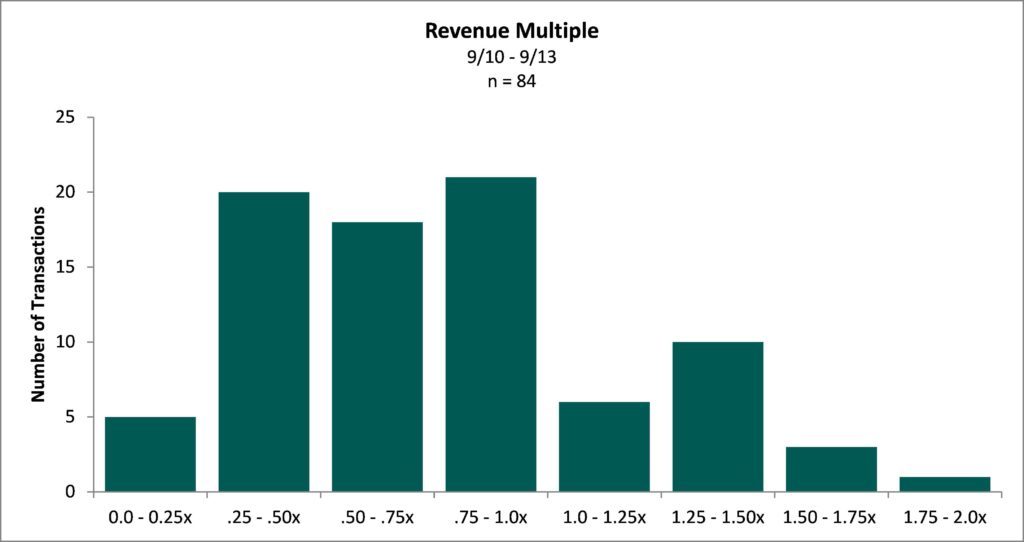
Throughout history, mankind’s ability to recognize patterns (especially potentially dangerous patterns) in the environment and respond quickly was crucial to survival. The study of evolutionary psychology describes how mankind has evolved into pattern-recognizing machines that connect dots and draw conclusions out of patterns we think we find in nature. In a similar way, hospital valuation professionals tend to extrapolate meaningful patterns in both meaningful and meaningless noise. More so, we sometimes erroneous think in generalities — or “rules of thumb” — in order to cognitively digest complex information of seemingly disparate information. Over the past three years, the VMG Health proprietary hospital transaction database reports an average price to revenue of 0.72. Based on this data, we are tempted to conclude a typical hospital with $100mm of revenue would be acquired for $72 mm. However, a deeper dive into the source data reveals a clearer appreciation of the “average” hospital valuation.
Hospital Valuation: Does Size Matter?

The chart above is a histogram of hospital transaction multiples over the past three years. We observe the market price to revenue multiples do not exhibit normalized statistical bell curve behavior. While the average price to revenue multiple is 0.72, there is almost an equal frequency of observations in the 0.25x-0.50x, 0.50-0.75x, and 0.75x-1.00x categories. Therefore, the application of the straight historical average price to revenue multiple 0.72 may not accurately capture true market dynamics.
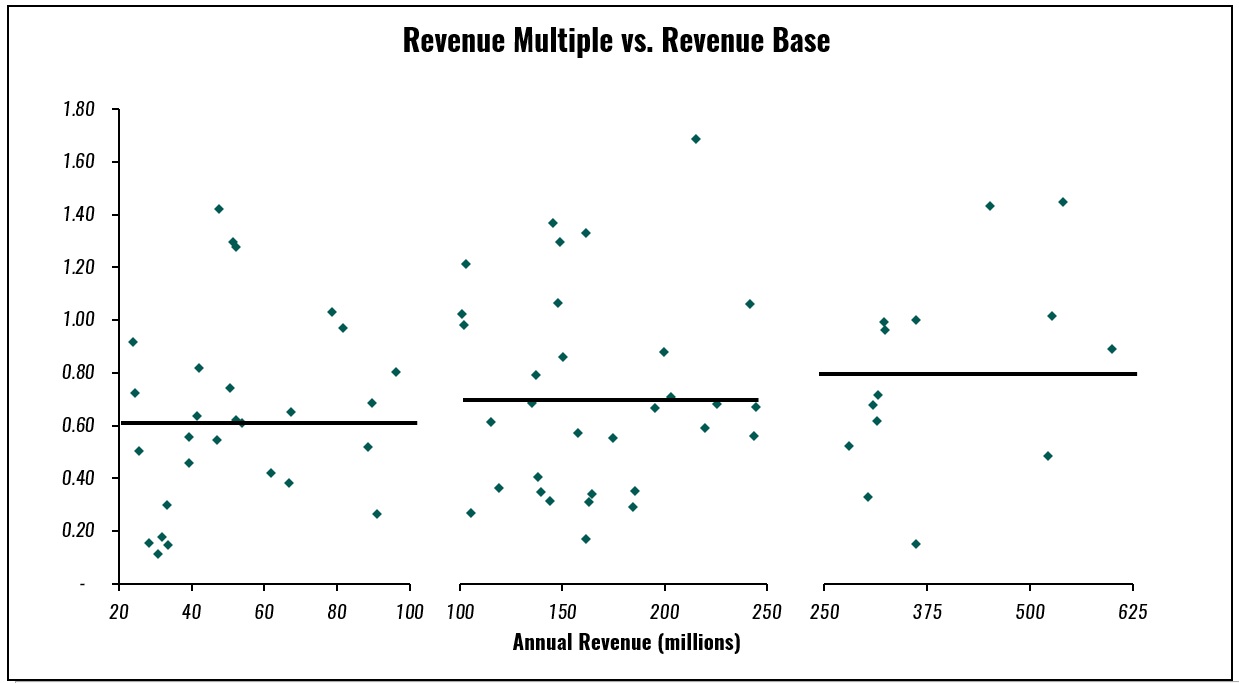
In addition, there seems to be a general fallacy that larger hospitals/health care systems command larger acquisition price to revenue multiples in the market.

As the scatterplot above demonstrates, price to revenue multiples of hospitals with similar revenue levels vary. Even more surprising, there is no correlation between size of hospital (in terms of revenue level) and price to revenue multiple in the market (i.e., size does not matter in hospital valuation).
Hospital Valuation: Does Margin Matter?

The chart above stratifies VMG Health’s proprietary database into three groupings based on the acquired hospital’s earnings before interest, taxes, depreciation and amortization (“EBITDA”) margin (0%-9%, 9%-12% and 12%+). Generally, hospitals with higher EBITDA margins correlate with higher revenue multiples; hospitals with lower EBITDA margins correlate with lower revenue multiples. For any given hospital transaction, the above observation may or may not hold true as numerous factors influence the ultimate price buyers are willing to pay.
Conclusion
The astute hospital valuation analyst should use caution when basing his/her expectations of hospital pricing on pure averages in the market. Based on our experience, hospital transaction prices are driven by a multitude of considerations including market share, demographics, payor mix, profitability, capital expenditure requirements, physician alignment and services offered amongst many others attributes.


