5 Year Valuation Comparison: VMG Index vs. S&P 500
August 16, 2012
Over the last five years, the United States economy has been on a rollercoaster ride. From rising oil prices to Europe’s debt crisis to our own banking, housing, and credit crises, Americans have been weathering an economic storm. However, according to the Economist, “[…] economic recovery […] needs the [recovery] process to advance far enough for the normal cyclical forces of employment, income and spending to take hold. And though their grip may be tenuous […], it now seems that, at last, they have.” It does seem as if the broad economic environment may finally be leveling off to a new normal.
Based on the valuation multiples of the S&P 500 index illustrated below, it appears as if America’s recovery may have officially begun at the beginning of 2009. Consumers are more cautious about saving, lenders are reluctant to lend despite enhanced easing in fiscal policy, unemployment numbers can’t ever seem to be positive, and budgets, and hence payrolls, continue to be slashed left and right in the name of deficit control. However, the fact is that despite frequent pitfalls, the S&P valuation multiples have been, albeit slowly, bouncing back towards pre-crisis valuation levels. At the end of 2009 through the middle of 2010, Enterprise Value to EBITDA (TEV/EBITDA) multiples were at pre-recession levels, reaching 9.5x, where the pre-recession peak over the last five years was 10.1x. Although TEV/EBITDA multiples have since declined, for the S&P 500 at large, multiples are averaging 8.0x, an almost 40% increase from trough levels of the recession, and only 25% off the peaks of pre-recession levels.
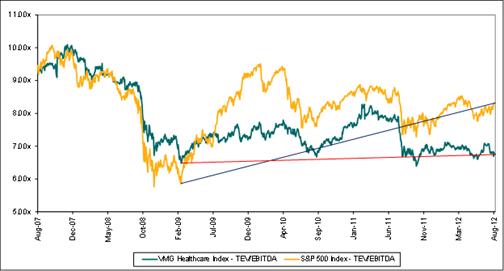
The VMG Healthcare Index, equally weighting 17 public healthcare services companies ranging from ASCs to Hospitals to Lab Companies, on first glance looks to strictly follow the S&P over the last five years. However, on closer examination one can notice that since the beginning of 2009, healthcare services companies’ valuation multiples, although trending in the same direction as the S&P, have never quite reached the high peaks and also have reached lower troughs than the S&P.
What does this tell us? Although healthcare services companies seem to follow the S&P direction-wise, healthcare services companies have not actually bounced back to pre-recession levels similar to the broader S&P. A number of factors may contribute to this phenomenon, but the biggest has been the increased risk of government reimbursement. With Medicare cuts looming and increased oversight translating into enhanced expense management controls, healthcare services companies are finding it more challenging to navigate and remain profitable whilst meeting, and staying updated, with all the governmental requirements and standards. Only time will tell what role government will soon continue to play in healthcare. With this uncertainty, it will be challenging for healthcare services companies to bounce back to pre-recession EBITDA multiple levels.
Categories: