

Cano Health’s Bankruptcy and Reorganization
Christa Shephard
August 13, 2024

Written by Ash Midyett, CFA; William Teague, CFA, CVA
After a multi-year drought, the healthcare services industry has helped lead the way in re-opening the initial public offerings (IPO) market, contributing half of the top 10 largest IPOs of the year. In July alone, Ardent Healthcare (ARDT) and Concentra (CON) filed back-to-back IPOs, raising $192 million and $529 million respectively. Ardent Healthcare marks the first traditional health system to IPO in decades, and in this article, we will discuss the company’s performance and offering compared to that of its public peers.
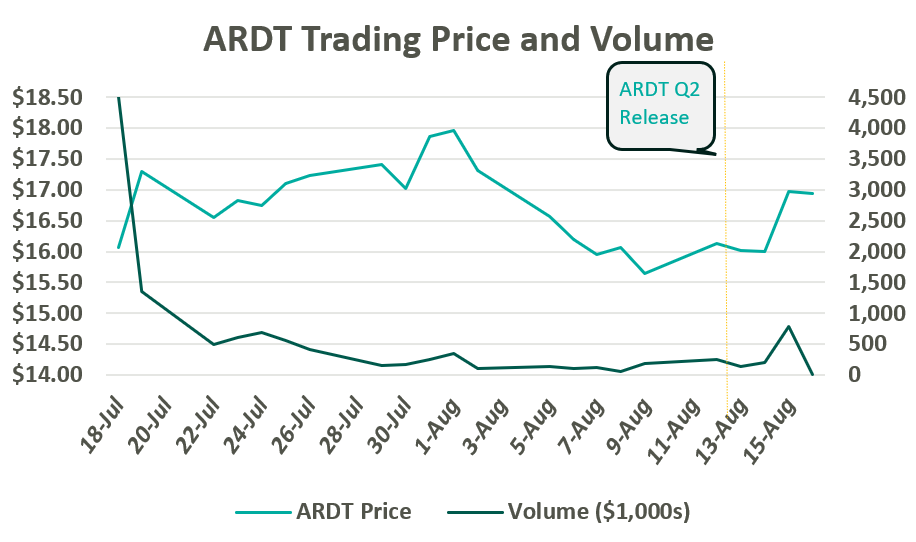
On July 19, Ardent Healthcare listed 12 million common shares on the New York Stock Exchange at $16 per share. After accounting for options granted to underwriters, the proceeds generated $209 million, which is expected to be allocated towards debt repayment and future acquisitions. The IPO marks a notable downshift from their initial price target of $20-$22 per share. Since trading, ARDT moved up toward a peak close of $17.97 before returning to $16.00 per share following a global market sell-off in the first week of August. Following Ardent Healthcare’s Q2 Earnings release on August 14, their shares jumped 6% to $16.97.
Since the company’s founding in 2001, Ardent Healthcare has grown into the fourth largest, for-profit hospital operator and healthcare services provider in the United States. The company currently operates 30 acute care hospitals and over 200 sites of care. Its market footprint spans eight mid-sized, urban markets across six states: Texas, Oklahoma, New Mexico, New Jersey, Idaho, and Kansas.1,2
Ardent Healthcare is listed as a “Controlled” company, meaning control and shareholder rights are concentrated with the company’s private equity sponsor, EGI-AM Investments, L.L.C. EGI-AM Investments acquired Ardent Healthcare in July 2015 and has since supported an aggressive business development strategy characterized by scale and leverage. From 2015 to 2018, Ardent Healthcare nearly tripled its operating revenue through the acquisition of 16 hospitals and 95 other sites of care while generating margins between 6% and 10%. While Ardent Healthcare aggressively expanded its footprint, the company simultaneously divested most of its real estate to an affiliated REIT, Ventas, Inc.
Ardent Healthcare’s inorganic growth is primarily attributable to three large joint ventures, which exemplify the company’s established business development strategy. In March 2017, Ardent Healthcare acquired five hospitals from LHP Hospital Group, Inc. and, in turn, established a joint venture with the University of Kansas Health System. The acquisition was quickly followed by the acquisition of St. Francis Health Center in Topeka, KS in May 2017. Within a year, Ardent Healthcare made its largest acquisition to date and acquired a majority stake in 10 hospitals and 39 clinics from East Texas Medical Center Regional Healthcare System, a subsidiary of the University of Texas Health System during March 2018.
All three acquisitions adhere to Ardent Heathcare’s purported strategy of founding joint ventures with established, not-for-profit and academic health systems located within growing, mid-sized markets.
During its expansion period, the Company sold off most of its real estate to Ventas, Inc. and other affiliated REITs while paying out significant distributions to shareholders. In July 2015, Ardent sold the real estate for 10 acute-care hospitals to Ventas for $1.75 billion, shortly followed by a special distribution of $500 million to shareholders. Between 2018 and 2020, Ardent Healthcare sold off the real estate for 14 skilled nursing facilities and the three more acute-care hospitals for a total of $1 billion. Meanwhile, Ardent Healthcare paid out an additional $950 million in special dividends.
Real estate lease backs are nothing new to the healthcare services industry, but Ardent Healthcare marks the first publicly traded healthcare services company to pursue this strategy at scale. The cash infusion from the sale represents an opportunity to optimize capital structure via debt repayment, reward shareholders, and equip the company with dry powder to pursue future acquisitions. Meanwhile, real estate can trade independently with the oversight of a specialized management team. However, the lease backs also add operational leverage, adding a fixed rental expense to the income statement, similar to fixed interest on a loan.
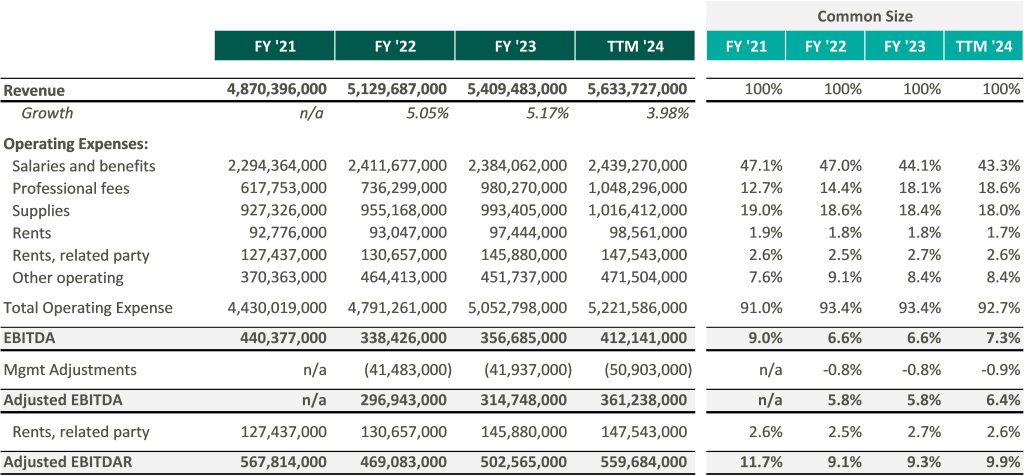
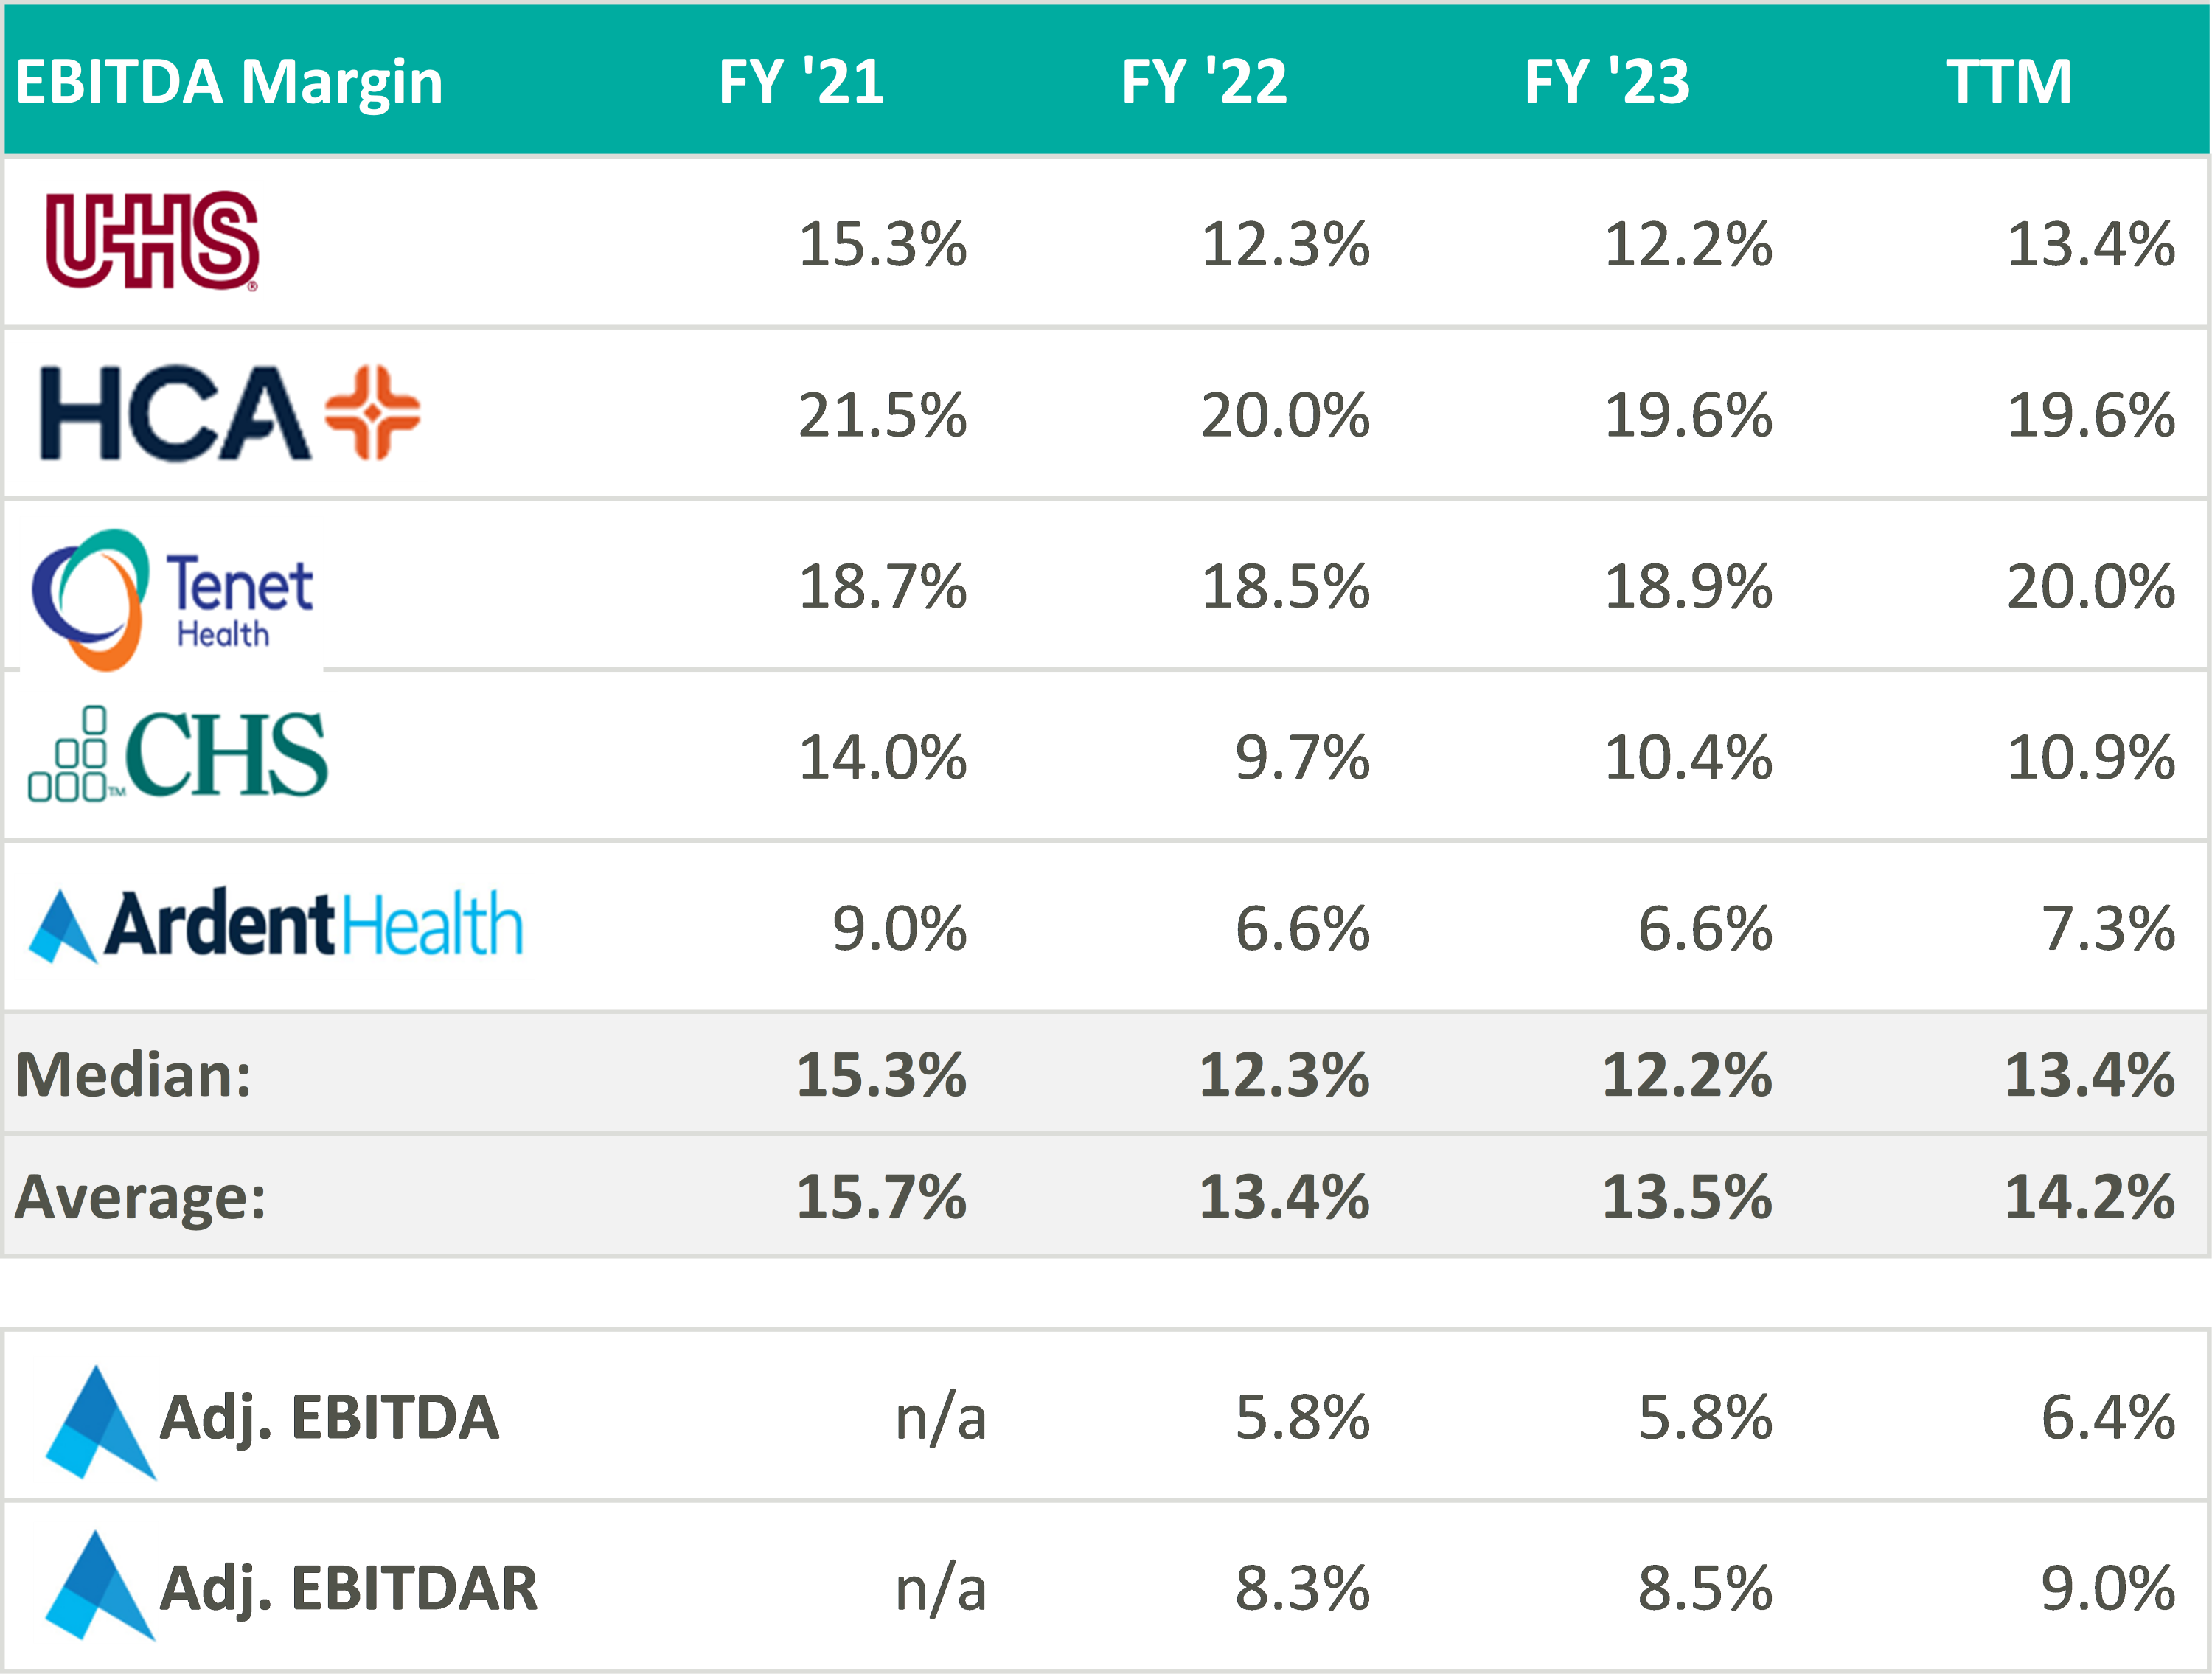
In recent marketing materials, Ardent Healthcare has advocated for analysts and investors to consider their valuation in relation to its EBITDAR multiple rather than EBITDA because of its unique expense structure. However, after accounting for rental expenses, Ardent Healthcare’s margins fall below those of its peers thereby increasing free cash flow volatility.3
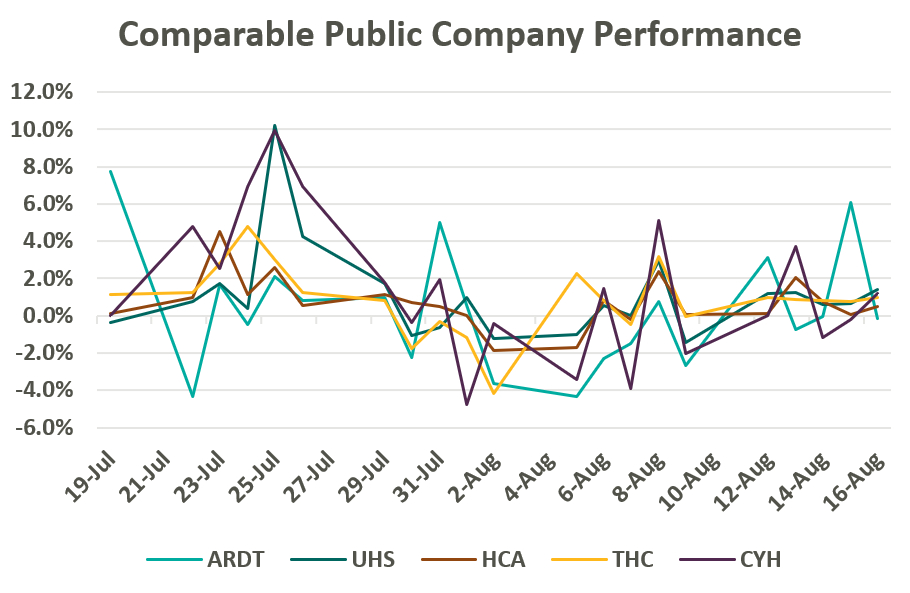
Despite lower margins and a higher-risk balance sheet, Ardent Healthcare’s implied trading multiple remains in line with its peers (or above after management adjustments to EBITDA): United Health Services (UHS), HCA Healthcare Inc. (HCA), Tenet Healthcare Corporation (THC), and Community Health Systems (CYH). As of August 19, Ardent Healthcare’s market capital roughly implies a 9.5x reported EBITDA multiple compared to the peer group median of 9.3x reported EBITDA.4
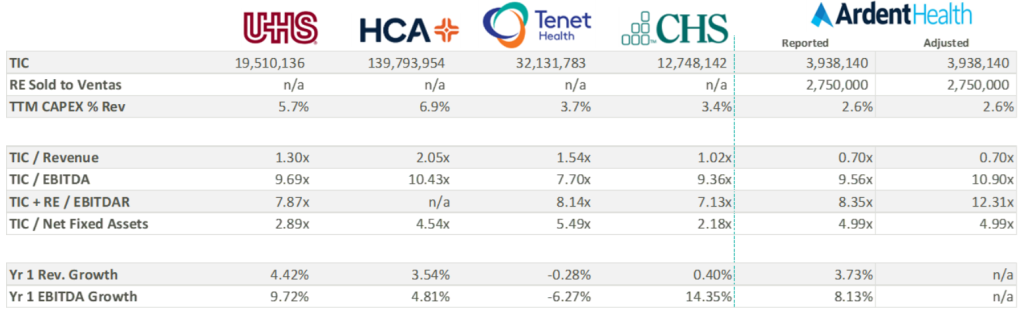
Over the three most recent fiscal years, Ardent Healthcare has reported capital expenditures well below those of its peers. All things equal, a lower capital expenditure increases cash flow to equity and thereby increases valuation—not to mention bolstering distributable free cash flow for shareholders. While some of the discrepancy in capital expenditure may be attributable to Ardent Healthcare’s asset light balance sheet, Ardent Healthcare’s lease agreement with Ventas stipulates a triple net lease obligation. It is possible that the company may be beholden to higher capital investment in the coming years, decreasing cash flow and shareholder value.
Perhaps more important to value is the company’s growth expectations, which currently appear elevated compared to peers. As seen in the table above, analysts are anticipating an 8% increase in EBITDA over the coming year compared to the peer group median of 5.5%. Three-year growth expectations considerably outpace peers as the company gains scale and increases revenue.
Ardent Healthcare’s growth strategy, outlined in its recent S-1 filing, will be key to growing market share, scale, and margin to best compete and grow into its current valuation. Specifically, Ardent Healthcare’s inorganic growth strategy remains focused on expanding its portfolio of joint ventures and has identified an addressable market of nearly 350 mid-sized, urban communities. Ardent Healthcare also intends to embolden its ACO participation and value-based care programs while accelerating their ambulatory and physician alignment initiatives (with eight new ambulatory surgery centers added in Q2 alone). Coming off a strong quarter, Ardent Healthcare certainly has ample opportunity to expand its stated 3% market share and continue providing high-quality care to its patients. VMG Health looks forward to following the company’s performance in the coming quarters.
Written by Dylan Alexander, CVA and Karly Bruss
The ambulatory surgery center (ASC) industry continues to experience steady, reliable growth, and remains a highly profitable segment within the healthcare provider sector. This growth has attracted significant attention from investors, captivated by the sector’s promising returns. The ASC industry’s success is underpinned by several key factors: an increase in demand for outpatient procedures, enhanced operational efficiency, technological advancements, favorable regulatory changes, elevated patient satisfaction, and, in some cases, favorable relationships with commercial payers. However, the success of ASCs has introduced a unique challenge: the difficulty of attracting and securing new physician investors.
Successful and stable ASCs typically have high profit margins and generate substantial returns to their investors. While health systems, management companies, and other corporate investors are common in ASCs, the most important class of investors in an ASC are its surgeon utilizers. For physicians to be investors, they are required to conduct a certain percentage of their surgical case volume at the ASC. In addition, most ASC operating agreements have redemption provisions requiring the sale of ownership to be valued at stated multiple of profitability or at fair market value (FMV) when physicians are not meeting case volume requirements, retiring, or exiting the marketplace.
As exiting physicians sell off their ownership, ASCs seek out new surgeon investors to buy in, provide care, and maintain a strong base of physician equity partners to retain case volume and protect or increase profitability. ASC operating agreements typically have buy-in provisions at the same multiple of profitability or at FMV mirroring the redemption provisions. Therein lies the challenge of attracting new investor or utilizer surgeons into the ASC depending on the life cycle of the ASC. New physician investors may not have the ability or the desire to pay the price required to have an ownership interest in the ASC that is on par with legacy investors. Potential new physician investors may be relatively new to their practice, have large debt burdens from medical school, young family considerations, or considering alternative investments in the financial marketplace.
The ASC life cycle, though similar to other businesses, is distinctive due to its cyclical nature and dependence on surgeon volume and investment.
In the start-up phase, significant investments are made to secure a facility, purchase necessary medical equipment, recruit staff, acquire the appropriate licensure, and fund initial working capital. Because the overall value of an ASC is typically at its lowest during the start-up phase, potential physician investors may be unwilling to accept the financial risk of a new venture that may not be cash-flow positive in the immediate future. However, the returns on their investments for the initial physician investors can be the highest for a successful ASC. During this phase, physician shareholders are usually unlikely to exit, and the ASC’s focus is syndicating the initial physician ownership base for what is expected to be a highly successful ASC given the desired surgical specialty mix.
In the growth phase, the ASC establishes its relationship with physician utilizers (both investor and not), managing surgical block times, developing its patient base, refining payer contracting, and reaching operational efficiency through case volume adequacy given the size and specialty mix of the ASC. During this phase, ASCs are often profitable but still not ramped to optimal and full capacity levels. The growth phase can represent an ideal time for new physicians to consider buying in, as the purchase price is often less and the potential for higher returns still exists. Physician investors exiting the ASC can also get strong returns on their initial investment from the start-up phase.
ASCs have achieved financial stability and operational efficiency in the maturity stage. Mature ASCs typically generate significant cash flow, leading to high valuations. As discussed, high valuations can be a barrier to entry for new physician investors. In a sense, ASCs can be a victim of their own financial and operational success. Though returns are stable, mature ASCs have usually reached their maximum capacity or are nearing capacity. Additional capital investment in space and equipment could be required to maintain the ASC’s current level of profitability. Most importantly, the ASC must manage the retirement and exit of certain key physician investors by replacing them with case volume from newer physicians. If new physicians successfully replace exiting physicians in ownership, the maturity stage can be maintained for the foreseeable future. Valuations at this stage are typically high and consistent over time with equitable returns to both exiting and buying surgeons. It is at the end of this stage that many ASCs encounter the challenges discussed previously. If an ASC is unable to attract new physician investors due to market factors, a shortage of physicians, or pricing constraints associated with success, it may face declining profitability and overall value.
The exit phase, or decline phase, is characterized by shareholder physician attrition outpacing new physician investment. The value of an ASC declines as the departing shareholders no longer contribute case volume, and finding physicians to buy in remains a challenge. At this point, it is common to see a few physicians or the corporate partner increasing ownership due to shareholder redemptions with no new physicians to invest.
ASCs remain one of the more attractive investments in the healthcare space because of their proven resiliency when managed appropriately. Long-standing, successful ASCs may have been through this life cycle several times. At the decline phase, the value of the ASC will likely be at one of its lower points, creating an attractive purchase price for interest by new surgeon investors. If ownership is re-syndicated to align with growth and key physicians, the ASC then starts at the growth phase and moves to maturity with its new base of physician owners.
The increasing demand for outpatient procedures and the opportunity for substantial returns make ASCs a desirable option for potential physician investors. Physician alignment through investment is critical to the success of any ASC and is the key factor in the life cycle of the business. When determining values for physician investment and redemption, it is essential to consider the current and expected future operations.
The valuation of the ASC should be as accurate and thoughtful as possible—not only for the relationship between physician buy-ins and redemptions to maintain the operations of the ASC, but for regulatory requirements as well. Often, ASCs engage an independent and unbiased third party to conduct a fair market value analysis pursuant to any ownership transactions. VMG Health, with its experienced team, provides expert knowledge and data-driven analyses to support parties in ASC transactions. Our expertise in the ASC marketplace enables stakeholders to navigate the challenges and opportunities associated with ASC investments as they move through their life cycle effectively.
Written by Frank Cohen
In recent years, key Supreme Court rulings have significantly altered the field of administrative law. One crucial decision involves the Court’s June 28, 2024 overturning of the Chevron deference, a long-standing doctrine that has governed how courts engage with agency interpretations of statutes. This change may have far-reaching implications for various administrative processes, including Medicare audit hearings. This article explores the impact of rejecting Chevron deference on administrative law judge (ALJ) hearings, particularly those related to Medicare overpayment estimates based on statistical sampling.
The Chevron deference doctrine was established in the 1984 Supreme Court case Chevron U.S.A., Inc. v. Natural Resources Defense Council, Inc. This doctrine specifies that, when a statute is ambiguous, courts should defer to an agency’s interpretation of it as long as the interpretation is reasonable. The rationale behind this doctrine is that agencies are presumed to possess specialized expertise, making them better equipped to handle technical details than courts. Chevron deference was meant to respect the separation of powers by recognizing the executive branch’s role in enforcing laws, ensuring courts do not overstep their boundaries by second-guessing agency expertise.
Chapter 8 of the Medicare Program Integrity Manual (MPIM) offers only a broad overview of using inferential statistics and conducting statistical sampling to estimate overpayments (SSOE) in Medicare audits. These guidelines have traditionally been highly regarded in ALJ hearings and often carry more weight than the results, conclusions, and opinions presented by statisticians representing healthcare providers. This preference was based on the premise that the Centers for Medicare & Medicaid Services (CMS) possessed the expertise to interpret and apply complex statistical methods effectively. This is the definition of Chevron deference.
MPIM’s Chapter 8 contains only nine pages regarding the statistical models and processes involved in the SSOE analysis. However, an extensive body of literature exists on this subject in various formats and sources. When ALJs rely on the factors in these nine pages, it hampers the provider’s ability to mount a compelling defense that challenges the auditor’s methods using widely accepted standards within the statistical community. On the other hand, this deference is meant to ensure audit hearings are grounded in established regulatory interpretations, providing a consistent framework for decision-making. It does not preclude providers from challenging the auditor’s methods. Instead, it ensures any defense is presented within the context of recognized standards, maintaining the integrity and fairness of the process.
The Supreme Court’s overturning of Chevron deference represents a significant change in administrative law and, consequently, ALJ hearings. The decision reflects concerns about the separation of powers and the judiciary’s role in interpreting the law. Critics of Chevron deference argue that it gave agencies too much power to define their own authority, thereby weakening judicial oversight and denying healthcare providers’ due process. Supporters of Chevron deference argue that it allows agencies with specialized expertise to interpret complex and technical statutes, ensuring more informed and consistent regulatory decisions while promoting efficiency and stability in the regulatory process.
It is reasonable to expect that this ruling will have a significant impact on the financial damages incurred by healthcare providers due to extrapolated overpayment findings. However, the ruling could create a more complex and uncertain regulatory environment, making it harder to predict and comply with regulations. The impact can affect various areas of the audit process.
With Chevron deference no longer in play, ALJs will hopefully scrutinize CMS guidelines more critically, including Chapter 8 of the MPIM. This means the methodologies and assumptions used by CMS for statistical sampling and overpayment estimation could be subjected to more rigorous judicial review during Medicare audit hearings. ALJs will no longer automatically favor CMS’ interpretations of Chapter 8 but will evaluate them alongside expert testimony from statisticians representing providers. However, this also means that judicial rulings may be inconsistent without agency interpretations of ambiguous statutes. Different courts may interpret regulations differently, leading to inconsistent enforcement. This inconsistency could create a patchwork of regulatory requirements across different jurisdictions, complicating compliance efforts for healthcare providers operating in multiple areas.
The recent overturning of Chevron deference marks a significant shift in the landscape of expert testimony in ALJ hearings. Providers may potentially expect a fairer and more balanced evaluation of the analysis and methodologies presented by their statisticians. As a result, there is an increased incentive for providers to seek highly qualified experts who can effectively challenge CMS’ statistical approaches and provide alternative interpretations based on robust statistical principles. This shift promotes a more equitable playing field and encourages the use of expertise to strengthen the quality of evidence presented in ALJ hearings.
The CMS guidelines are not always beneficial for providers regarding Medicare audit disputes. By more mindfully following these guidelines, providers will likely have better results. ALJs may potentially consider the evidence from both parties more fairly. This could lead to lower overpayment estimates or the dismissal of the extrapolated overpayment findings. Now more than ever, providers need to be more strategic, focusing on the quality and persuasiveness of their experts’ analyses and testimonies.
The Supreme Court’s overturning of Chevron deference marks a significant paradigm shift in the power dynamics between administrative agencies and the judiciary. In the context of Medicare audit hearings, this shift implies that ALJs are no longer bound to automatically adhere to the guidelines set forth by CMS, as outlined in Chapter 8 of the MPIM. Instead, ALJs are now expected to assess all evidence presented, including expert testimony from healthcare providers, potentially leading to more favorable rulings for the providers. As the legal framework undergoes transformation, healthcare providers must proactively adapt by employing expert analyses and presenting counterarguments against agency methodologies to ensure accurate audit outcomes.
Written by Matthew McKenzie, CVA; Jay Ostrom, CVA
The following article was published by the American Association of Provider Compensation Professionals (AAPCP).
Due to the complexities of the modern healthcare environment, there is a broad range of compensation structures in provider services agreements to facilitate ease of administration while maintaining regulatory compliance. While common compensation structures such as a compensation-per-Work Relative Value Unit (wRVU) model can be effective in reimbursing providers for the value of professional services, independent physicians and physician practices are sometimes compensated based on a per-service rate for each individual unit of service they provide, rather than a rate per wRVU. To ensure arrangements utilizing this structure are commercially reasonable and consistent with fair market value (FMV), hospital administrators should understand the value drivers of the rates that can be paid for per-service fees. In this article, we will discuss potential benefits and drawbacks of the per-service fee structure, as well as explore several key considerations when setting rates and capturing appropriate expenses.
Similar to the compensation-per-wRVU model, a per-service fee structure determines the total compensation payable to a provider based on the unit volume of services rendered. However, rather than the unit of compensated service being the wRVU, the compensation unit is tied to the volume of each CPT code rendered or a broader service category.
For example, consider a scenario in which a radiology group provides a hospital with X-ray, MRI, CT scan, and ultrasound interpretation services. Rather than receiving fixed compensation-per-wRVU based on the wRVUs associated with each interpretation, each interpretation category (X-ray, MRI, CT scan, and ultrasound in our example) would have its own unique compensation rate.
In general, the primary sources of value for these arrangements are the professional services rendered by the provider. While there are various ways to quantify the value of providers’ professional services, the two most common methods are described below.
In determining the compensation for professional services per unit of service, one consideration is the clinical provider time required to provide that unit. In general, the more provider time required to perform a certain service, the greater the value of the service rendered. As such, a reasonable method of determining the value of the professional component of compensation for a unit of service would be to assess the average time spent by the clinical provider on said unit.
Professional reimbursement rates can also be a useful measure of the value of professional compensation on a per-service basis. In many cases, hospital administration will have data indicating the average professional reimbursement rates realized per unit of service performed. When this data is unavailable, a good starting point for assessing reimbursement for professional services is the Medicare reimbursement for the wRVU associated with the relevant Current Procedural Terminology (CPT) codes as reported by the Center for Medicare and Medicaid Services (CMS). This professional reimbursement should be based on the applicable CPT code or bundle of CPT codes that the provider will use for each unit of service. The reimbursement may quantify professional services more accurately than a solely time-based approach, as the Medicare reimbursement also considers the specific skill, training, and acuity of the subject service.
While Medicare reimbursement is a good starting point in understanding professional reimbursement for provider services, actual revenue generated for said services is unlikely to fall directly in line with Medicare reimbursement. Rather, professional reimbursement for a given service is a function of the payer mix of the subject services. While the specific payer mix of an arrangement needs to be understood to accurately determine the professional revenues generated per unit of services provided, there are a few general rules that can inform the directionality of the adjustment.
For most professional services, commercial reimbursement is typically greater than Medicare reimbursement. As commercial payers often reimburse at higher rates than Medicare, a service line payer mix primarily comprised of commercial payers will usually generate more revenue per unit than a service line comprised of fewer commercial payers. The higher revenue associated with the subject services may justify an upward adjustment in the per-service rates payable to the provider.
Medicaid and uninsured payers typically reimburse at rates lower than Medicare. As Medicaid and uninsured payers reimburse at lower rates than Medicare, a service line payer mix primarily composed of Medicaid and uninsured payers will generate less revenue per unit than a service line composed of fewer Medicaid and uninsured payers. In this scenario, the relatively lower revenue associated with the subject services may require a downward adjustment in the per-service rates payable to the provider.
While payer mix does have an impact on the revenue generated for the services provided, the actual services rendered by the provider are not dependent on the payer mix and, in many scenarios, the provider has little to no control over the payer mix. These dynamics should be considered when utilizing mix data to determine the per-service compensation payable to a provider.
Another method of quantifying the value of the professional compensation applicable to a unit of services provided is market survey data. For example, compensation-per-wRVU data for a wide array of provider specialties is readily available through healthcare compensation survey reports. This data may be applied to the average wRVUs that the provider would generate per unit of service to determine an estimate of the market professional compensation payable per unit.
As opposed to the use of actual professional reimbursement to determine professional compensation rates (which consider the actual funds available to compensate the providers), the use of market-based compensation data can provide an indication of value that reflects actual compensation rates paid in the market for similar services. However, the use of market survey data is limited by the reliability of the reported survey data and the data’s applicability to the subject services. It is important that organizations understand the survey data they are utilizing and how the specific details of an arrangement may impact the applicability of market survey data.
As previously mentioned, one benefit to the per-service compensation model is the ability to include provisions for certain variable overhead expenses incurred by the provider per unit of service. There are several ways to determine the value of these variable expenses.
One way to determine a provision for additional variable expenses is by assessing the actual incremental variable expense incurred by the provider. Should the provision for non-professional variable cost per unit be based on the actual costs incurred by the provider, the reimbursement for variable expenses is effectively a direct pass-through from the provider to the contracting entity. While this method reduces the risk of over- or underpayment for non-professional services, it is important that the contracting entity ensures the following assumptions are true:
In the absence of actual incremental expense data, Medicare reimbursement associated with practice expense (PE) RVUs can also be useful in determining a provision for overhead associated with a unit of services provided. Specifically, reimbursement associated with the PE RVUs for the CPT code, or bundle of CPT codes, for a given service indicates reimbursement for non-professional expenses incurred, consistent with guidelines from CMS.
When utilizing PE RVU data, it is important to recognize the site of services in which the subject services are provided. CMS illustrates PE RVU data for services provided in a facility setting (e.g., hospitals, ASCs, SNFs, etc.) and a non-facility setting (e.g., outpatient clinics, urgent care centers, etc.). PE reimbursement is higher for services provided in the non-facility setting because the provider is assumed to bear the responsibility of all overhead (i.e., space, equipment, etc.) while the facility is assumed to bear these costs in the facility setting. Therefore, identifying the correct site of service is imperative for accurate application of this method.
Another consideration in deciding the payment rate for each service provided by a provider is who has the authority to bill and receive payment for the services provided. If the provider is unable to bill patients for any of the services provided, compensating the provider with a fully loaded rate, inclusive of provisions for professional and any technical services provided, may be appropriate.
Should the provider bill and collect for services rendered under an arrangement and retain those collections, the collections earned by the provider should offset the fully loaded rate that would otherwise be payable to the provider. For example, if the provider’s collections per unit were sufficient to cover their expenses incurred to provide the service, it may not be appropriate to provide any additional compensation to the provider. However, a payment subsidizing provider services in addition to the collections retained by the provider may be appropriate if the provider’s collections per unit are not enough to cover their expenses (e.g., if the provider has expenses of $30 per unit but can collect only $20 per unit, a payment covering this disparity may be reasonable). Because reasonable payment to providers who can bill and collect is dependent on their actual collections per unit (which varies dependent on the payer of the service), organizations should be diligent when determining rates per service in these scenarios.
In addition to the actual collections generated by the provider in the provision of the services, the cost of billing and collecting should be considered when determining a reasonable per-service compensation rate. For example, professional reimbursement from payers typically includes a provision for the costs associated with billing and collecting. However, market provider compensation data does not typically include a provision for billing and collection costs. As such, make appropriate adjustments depending on the valuation method used and the billing and collection responsibilities of the subject arrangement.
When a service is requested on an urgent basis, an increase in the compensation payable to a provider may be justified. For example, per-service compensation for services ordered emergently (e.g., STAT cases) could potentially earn more compensation than the same services that do not require an expedited turnaround time to account for the on-call availability of the provider. Typically, additional compensation based on the urgency of a service is only contemplated if the expedited turnaround time is deemed medically necessary.
Per-service compensation structures can be an effective way to compensate providers for services that include additional variable expenses above and beyond the providers’ professional services. However, hospital administrators must understand the value drivers behind per-service compensation rates and the risks associated with the structure to ensure arrangements are commercially reasonable and compliant with healthcare regulations.
Written by Savanna Ganyard, CFA; Joshua Miner; Chance Sherer, CVA; and William Teague, CFA, CVA
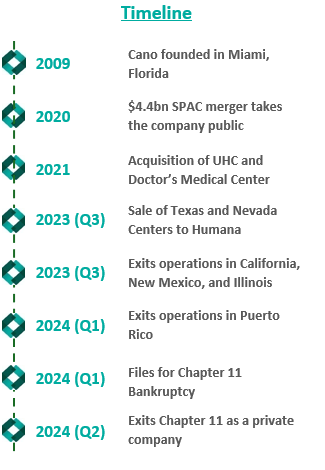
Cano Health, Inc., headquartered in Florida, is a value-based care delivery platform that specializes in primary care for seniors. In February 2024, Cano announced it would enter a reorganization process under Chapter 11 bankruptcy. Less than six months later, on June 28, 2024, the company announced a successful conclusion of its court-supervised restructuring. The company, now private, is looking forward to a brighter future under a more focused strategy.
Founded in 2009, Cano began developing its core business as a value-based provider in Florida. The company employs a capitated care model and places a large focus on preventative care and accessibility. The company’s membership is largely comprised of Medicare Advantage, Medicaid, and ACO REACH. As Cano grew, it added complementary service offerings, such as a care management program, a prescription program, and in-home medical visits. These services were meant to prevent hospital admissions and readmissions, increasing Cano’s revenue while decreasing patient total cost of care in the capitated care model.
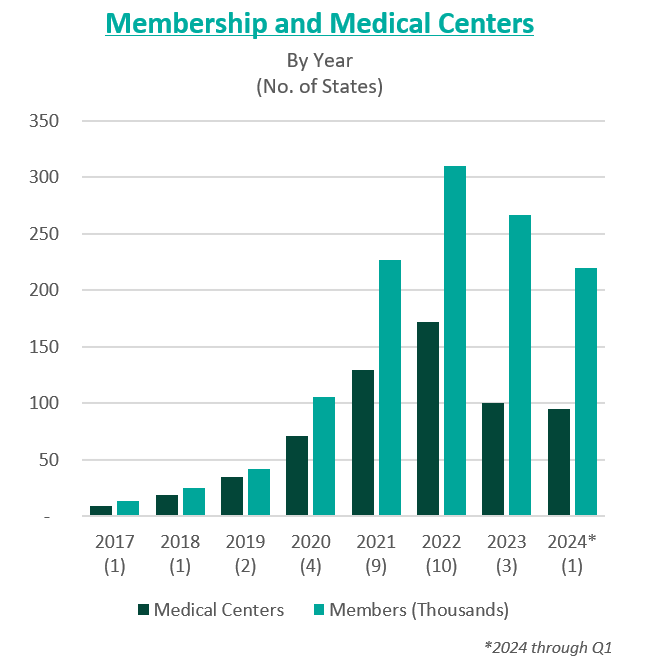
To further drive growth, the company began to pursue an aggressive policy of expansion through de novo development, acquisitions, and affiliations. The company grew from two markets and 13,700 members in 2017 to 15 markets and 106,000 members by 2020.
In 2021, the company went public in a $4.4 billion merger with a special purpose acquisition company (SPAC) that provided $1 billion in cash proceeds to the company. After going public, Cano continued to fuel growth through acquisitions. In 2021, the company acquired Miami-based University Health Care in a $600 million deal and Doctors Medical Center in a $300 million deal. The company added five states and 121,000 members in 2021, resulting in a total of nine states and 227,000 members. The company continued this growth throughout 2022, ending the year in 10 states and with 310,000 members.
However, in these years of high growth following going public, the anticipated benefits of these acquisitions did not materialize. The company was also affected by industry and regulatory headwinds, including increasing third-party medical costs and a looming Medicare Risk Adjustment Model (V28). On top of these issues, Cano continued to add debt and fell behind on debt repayments. Throughout 2022 and 2023, Cano reported significant losses and an accumulation of $1.2 billion in debt. For context, the company had $1 billion in assets as of December 31, 2023.
In February 2023, Cano entered into a side-car credit agreement with certain lenders. At the end of March 2023, the company’s market capitalization had decreased 90% from its price at the time of its SPAC merger. In April 2023, three board members resigned in protest of company decisions and performance. A couple of months later, the CEO, Marlow Hernandez, stepped down after pressure from shareholders and the former board.
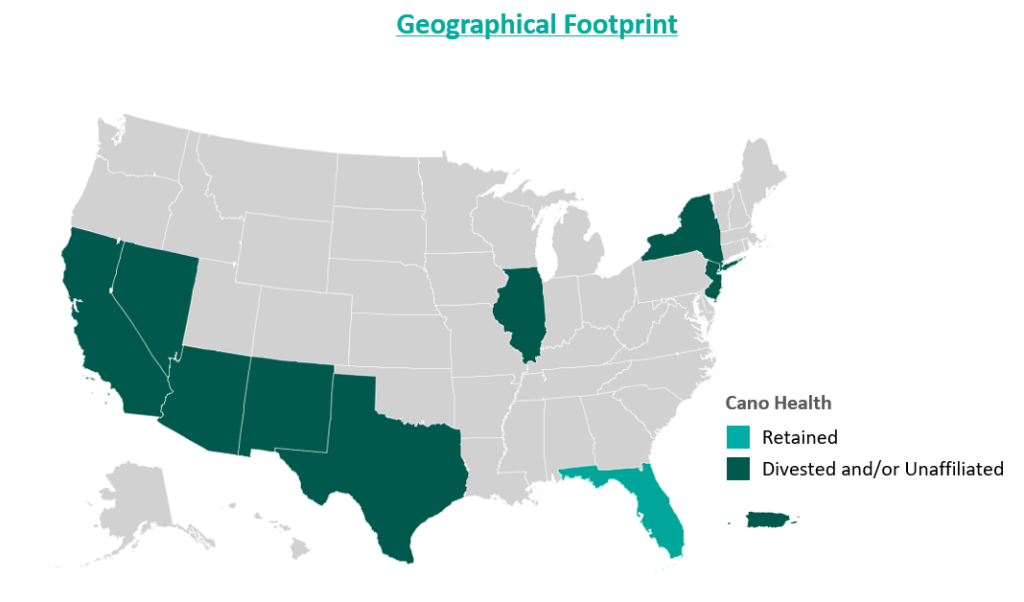
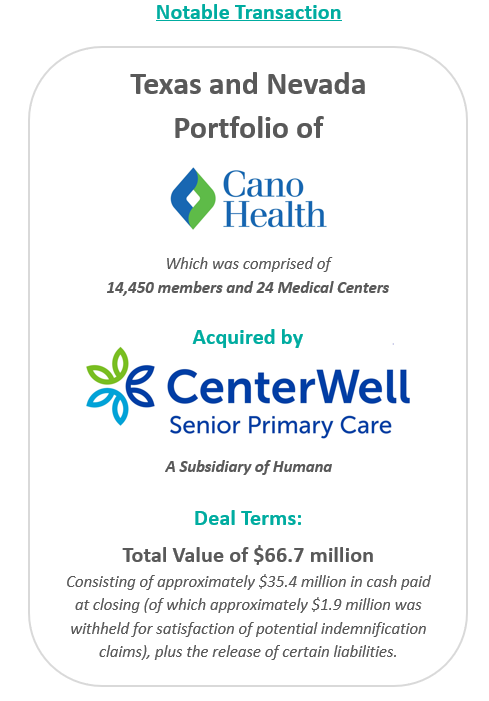
In an attempt improve the company’s performance and cover its liabilities, Cano began to divest its assets. The divestment process began in 2023 prior to the Chapter 11 filing, when the company sold its entire Texas and Nevada portfolio to CenterWell Senior Primary Care, a Humana subsidiary. The net proceeds of the transaction were utilized to pay down debt.
During the second half of 2023, the company also closed medical centers and exited operations in California, New Mexico, and Illinois. These three states represented approximately 5,000 members and 17 medical centers. The company received $19.9 million for the divestiture of certain specialty practices in Florida and assets located in California and Illinois, the net proceeds of which were used as working capital. Cano closed the remaining medical centers in these three states. Finally, Cano successfully exited operations in Puerto Rico at the beginning of 2024.
Despite these transformation efforts, Cano entered into voluntary Chapter 11 proceedings and a Restructuring Support Agreement with most of its lenders in February 2024. The agreement’s primary goal was to reduce debt and position the company for long-term success through cost-cutting measures.
In July 2024, Cano emerged from Chapter 11 as a reorganized private company. The company successfully reduced its debt burden by $1 billion by converting it into equity in the form of common stock and warrants. Additionally, existing investors have contributed an additional $200 million investment to support business operations.
Furthermore, Cano exited its underperforming markets, choosing to focus on its core Florida market. During the bankruptcy process, the court allowed Cano to reject 72 leases in six states. These were sites of offices and medical centers that the company no longer uses.
As established during proceedings, the company’s operational strategy going forward centers around optimizing cost and continuing to evaluate asset performance. To date, Cano is on track to achieve $290 million in cost reductions by the end of 2024. Key drivers of this cost reduction include negotiating with payers, reducing operating costs through decreasing the number of permanent staff, and cutting non-essential spending. In addition, the company is prioritizing Medicare Advantage and ACO Reach lines of business.
Essential to understanding Cano’s emergence from bankruptcy is the amount of divestment the company has undergone. At its peak, Cano operated in nine states and Puerto Rico either directly or through affiliates. To improve operations, the company terminated most of its affiliate partnerships and began to divest many of its operations. Following the reorganization process, the company only operates in Florida. Prior to bankruptcy, Cano had 143 locations in Florida, now reduced to 83 locations.
Cano’s largest asset sale was its centers in Texas and Nevada to CenterWell in a deal worth $66.7 million. At closing, the centers covered 14,450 members and 24 medical centers. These figures imply a multiple of $4,600 per member.
In December 2023, the company commenced a sale process for its ACO Reach line of business. The company has engaged with several bidders, but the transaction has not yet materialized. Cano’s ACO Reach business, which comprises 93,300 members, is projected to achieve $32 million in underwriting margin and $11 million in adjusted EBITDA from August to December 2024. The company also continues to explore sale opportunities related to its Medicaid line of business, which is expected to represent 36,200 members in 2024.
Cano’s financial projections estimate $2.9 billion in revenue and 233,000 members during fiscal year (FY) 2025, growing to $3 billion and 239,000 members by FY 2028. During the same period, the company’s adjusted EBITDA is projected at $125 million, growing to $199 million.
Post-reorganization, the estimated value of Cano at the enterprise level was between $580 million and $720 million. The valuation reflects implied Year 1 (2025) multiples at the midpoint of 5.2x adjusted EBITDA and approximately $2,800 per member.
In June 2024, Cano successfully emerged from bankruptcy as a private company with an improved capital structure and more focused operations. The reduced debt burden, coupled with a $200 million injection of capital, has relieved some pressure on the company as it moves forward. Cano has already made significant progress towards its FY 2024 cost reduction goal, achieving $270 million in cost savings and productivity improvements through the first half of the year. Currently, Cano is focused on its Florida operations but has not ruled out a more prudent expansion in late 2025 or 2026 if it continues to meet its financial goals.
Cano Health, Inc. (n.d.). Press releases, public filings, and investor presentations. Retrieved from www.canohealth.com.
Cano Health. (2023, July 18). Cano Health announces successful emergence from Chapter 11. PR Newswire. https://www.prnewswire.com/news-releases/cano-health-announces-successful-emergence-from-chapter-11-302186063.html
Cano Health. (2023, June 7). Cano Health announces agreement with unsecured creditors committee and court approval of disclosure statement for its reorganization plan. PR Newswire. https://www.prnewswire.com/news-releases/cano-health-announces-agreement-with-unsecured-creditors-committee-and-court-approval-of-disclosure-statement-for-its-reorganization-plan-302152012.html
Cano Health. (2023, March 27). Cano Health enters restructuring support agreement with a significant majority of its lenders to strengthen financial position. PR Newswire. https://www.prnewswire.com/news-releases/cano-health-enters-restructuring-support-agreement-with-a-significant-majority-of-its-lenders-to-strengthen-financial-position-302052889.html
PR Newswire. (2023, March 28). NYSE suspends trading in Cano Health Inc. (CANO) and commences delisting proceedings. https://www.prnewswire.com/news-releases/nyse-suspends-trading-in-cano-health-inc-cano-and-commences-delisting-proceedings-302053778.html
Capital IQ. (n.d.). Investor presentations. Retrieved from Capital IQ website.
Public Information related to Cano Health’s Chapter 11 Plan for Reorganization (Case No. 24–10164). (n.d.). Veritaglobal. Retrieved July 26, 2024, from https://veritaglobal.net/CanoHealth
Klas, M. (2023, July 19). The new Chapter 11 plan for Cano Health aims to exit bankruptcy, cut debt. Miami Herald. https://www.miamiherald.com/news/health-care/article289663459.html
Written by Quinn Murray and Ed McGrath, MHA
In the Fall of 2022, we wrote an article discussing not-for-profit health (NFP) system financial performance trends. At the time, NFP systems were experiencing major financial struggles given labor market and supply chain issues coupled with other inflation and industry pressures. While not the primary focus of our 2022 study, VMG Health also raised a concern relative to mid-size hospitals (larger than critical access, but not large enough to provide tertiary/quaternary care). Unfortunately, the concern has proven to be valid as hospital closures and bankruptcies continue. The outlook for these mid-size, independent hospital organizations is not promising given the lack of financial flexibility as larger systems continue the pursuit of acquiring any independent hospitals that have demonstrated any degree of financial success. In 2022, we also noted systems would experience increased competition by private equity–funded niche players and other organizations that could shift profitable services and commercial business from the systems. Their increased presence as disruptors in new markets has accelerated quicker than originally anticipated.
Our 2022 article summarized the financial performance of 21 systems across 32 states, with a combined fiscal year (FY) 2022 operating revenue of $188 billion. As noted in the prior article, the study was not intended to represent a statistically valid sample across all NFP systems, but did include a cross section of systems that provide care to patients in over 30 states with net revenues greater than $2 billion. Of these 21 systems, approximately 15 percent are clients of the VMG Health authors, but the vast majority are not.
Our updated article assesses how those same 21 systems performed in FY 2023 as compared to FY 2022 levels. As a result of this study, our team discovered the importance of understanding the broader implications resulting from the unfavorable financial performance of NFP health systems. This report also discusses the actions our clients and other NFP systems are taking to address the existing financial pressures and to proactively address potential future issues.
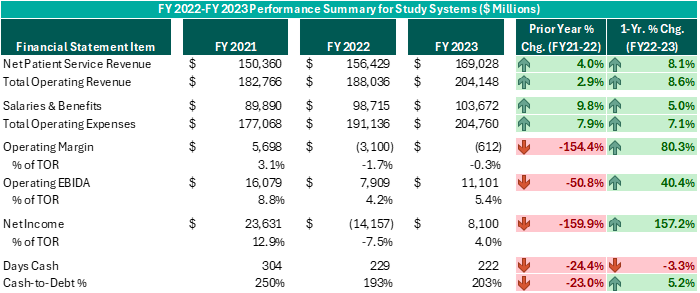
Executive leadership in these systems have made commendable decisions over the past 12–18 months despite ongoing challenges. While operating margins on a combined basis have improved by $2.5 billion from FY 2022 (and combined operating EBIDA improved over $3 billion), these organizations still experienced combined operating losses of ($612 million) in FY 2023. However, while positively trending toward break-even operating margins and 5% or higher operating EBIDA margins is no small feat following the adversity endured nationwide during FY 2022, these levels do not support long-term sustainability. Healthcare systems seeking sustainable financial operations should target operating margins of 3% or higher and operating EBIDA margins of 10% or higher. Those targets may not be achievable for all NFP Health Systems, but consecutive years of operating losses and minimal cash flows are not conducive for strategic growth and reduces an organization’s flexibility to certain strategic investments.
While the performance turnaround noted above is remarkable, the future of NFP healthcare systems continues to be very challenging. Organizations are seeking avenues to develop accretive opportunities to thrive—not just survive. Survival should not be the long-term objective. Systems are exploring and utilizing a variety of options and resources to improve performance, some of which have come to fruition in the past 12–18 months, as evidenced by the financial summary above.
Avenues some of our client system executives have pursued include the following. Note, each market and each situation is unique: One can apply similar approaches, but there is no cookie-cutter or templated solution. Rather, adjust the model to fit the situation as opposed to forcing the situation to fit the model.
To achieve long-term financial success, NFP systems should consider more innovative strategies that complement the evolving healthcare landscape. Patient preferences are not the same as they were 20 years ago, nor is the manner in which healthcare providers deliver care. Competitors and other organizations will capitalize on those who remain complacent and do not adapt. Therefore, sustainable success will require a willingness to adapt to the current industry environment in addition to proactive planning to meet the anticipated future needs of the patients and communities served.
Written by Nathan Woods; Frank Fehribach, MAI, MRICS; Kristin Herrmann, MAI, ASA
Healthcare real estate is a critical sector that supports the delivery of medical services, from hospitals and outpatient centers to medical office buildings and nursing facilities. However, this sector is heavily regulated, with specific laws aimed at preventing conflicts of interest and maintaining fair competition. Among the most influential regulations are the Stark Law, antitrust laws, and the federal Anti-Kickback Statute.
The Physician Self-Referral Law, commonly known as the Stark Law, is designed to prevent conflicts of interest in healthcare. It prohibits physicians from referring patients to receive designated health services (DHS) payable by Medicare or Medicaid from entities with which they have a financial relationship, unless an exception applies. DHS includes a wide range of services, such as clinical laboratory services, physical therapy, and radiology. Some exceptions include in-office ancillary services, equipment and office space rental, and bona fide employment relationships. These exceptions must occur within fair market value except certain in-office ancillary services—which simply allow physicians to refer patients for certain ancillary services, such as lab tests or physical therapy—within their own practice.
1. Financial Relationships: The Stark Law targets various financial relationships, including ownership, investment interests, and compensation arrangements. In the context of healthcare real estate, this means that lease agreements, joint ventures, and other financial dealings involving physicians must be carefully structured to avoid prohibited self-referrals. A self-referral in the context of the Stark Law occurs when a physician refers a patient to a medical facility in which they or an immediate family member have a financial interest, such as ownership, investment, or compensation arrangements.
2. Fair Market Value (FMV): All financial arrangements must be at fair market value. Fair market value is the price at which the property would change hands between a willing buyer and a willing seller, neither being under any compulsion to buy or to sell and both having reasonable knowledge of relevant facts. This requirement ensures payments reflect what would be paid in an arm’s-length transaction and are not influenced by the volume or value of referrals.
3. Exceptions and Safe Harbors: Stark Law provides several exceptions that allow for certain financial relationships if specific criteria are met. For example, the rental of office space exception permits arrangements if they are in writing, specify the terms, have a term of at least one year, and meet FMV standards without considering the volume or value of referrals. The bona fide employment relationships exception permits compensation arrangements between physicians and employers if the employment is for identifiable services, the compensation is consistent with fair market value, and not based on the volume or value of referrals. These exceptions are designed to allow necessary and beneficial financial relationships while preventing conflicts of interest.
Stark Law is known for its complexity. Healthcare real estate transactions must undergo careful legal and financial scrutiny to ensure compliance. Violations can result in severe penalties, including fines, exclusion from federal healthcare programs, and the requirement to repay amounts received for services provided in violation of the law.
Case Studies and Precedents
1. Tuomey Healthcare System Case (2015): Tuomey Healthcare System faced one of the largest penalties under Stark Law, amounting to $237 million. The case revolved around improper financial relationships with physicians, where the compensation was linked to the volume of referrals. This case underscores the importance of structuring compensation arrangements to comply strictly with FMV standards and avoiding any link to referral volumes.
2. Scripps Health Case (2021): Scripps Health in San Diego, California settled allegations related to violations of Stark Law. The health system was accused of compensating physicians at rates above fair market value, which were allegedly tied to the volume and value of patient referrals. The settlement amounted to $1.5 million and highlighted the importance of ensuring physician compensation arrangements strictly adhere to fair market value standards and are not linked to referral volumes.
Antitrust laws, including the Sherman Act and the Clayton Act, aim to promote competition and prevent monopolistic practices. These laws are essential in healthcare real estate, ensuring market power is not concentrated in a way that restricts competition or harms consumers.
The Sherman Antitrust Act, enacted in 1890, is the cornerstone of antitrust legislation in the United States. It prohibits certain business activities that federal government regulators deem to be anti-competitive and that restrict interstate commerce and trade. The act broadly prohibits agreements and practices that restrain trade, such as price-fixing, bid-rigging, and market allocation agreements. It also addresses monopolization and monopolization attempts, aiming to promote fair competition, protect consumers from monopolistic practices, and foster economic efficiency.
The Clayton Antitrust Act, passed in 1914, is an amendment to the Sherman Act and further strengthens antitrust laws in the U.S. It focuses on specific practices that the Sherman Act did not clearly address, such as price discrimination and exclusive dealing contracts that may substantially lessen competition. The Clayton Act also prohibits mergers and acquisitions that may substantially lessen competition or tend to create a monopoly. It aims to prevent anti-competitive practices and promote fair competition by addressing various forms of conduct that could harm consumers or competitors in the marketplace.
Implications for Healthcare
1. Market Power and Competition: Healthcare providers acquiring substantial real estate operations must ensure these acquisitions do not unfairly limit competition. For instance, controlling a significant number of facilities in a region could raise anti-trust concerns if it reduces consumer choice or leads to higher prices.
2. Collaborations and Joint Ventures: Partnerships and joint ventures in healthcare real operations can also attract antitrust scrutiny. Such arrangements must be structured to avoid anti-competitive effects, such as price-fixing or market division.
3. Mergers and Acquisitions: Mergers and acquisitions involving healthcare operations are subject to antitrust review. This process involves analyzing market share, potential benefits, and any anti-competitive impacts. Transactions that significantly lessen competition or create monopolies can be challenged and blocked.
Navigating antitrust laws requires a thorough understanding of market dynamics and regulatory requirements. Transactions in the healthcare sector often undergo detailed scrutiny by regulatory bodies like the Federal Trade Commission (FTC). Legal and financial experts must conduct comprehensive market analyses to demonstrate that transactions will not harm competition.
Case Studies and Precedents
1. FTC v. Advocate Health Care Network (2017): The FTC challenged the merger of Advocate Health Care Network and NorthShore University Health System, arguing that it would reduce competition and lead to higher prices for consumers in the Chicago area. The court sided with the FTC, emphasizing the importance of ensuring mergers do not negatively impact market competition.
2. St. Luke’s Health System and Saltzer Medical Group Case (2015): St. Luke’s Health System acquired Saltzer Medical Group, which the FTC argued would reduce competition for adult primary care physician services in Nampa, Idaho. The court ruled against the merger, and St. Luke’s was required to divest Saltzer. This case illustrates the need for careful antitrust review in healthcare mergers and acquisitions.
3. Pennsylvania v. UPMC and Highmark (2014): The state of Pennsylvania filed a lawsuit against UPMC and Highmark, alleging that the two healthcare giants engaged in anti-competitive practices. The case was settled with both parties agreeing to terms that ensured competition in the market, highlighting state authorities’ role in enforcing antitrust laws to protect consumers.
The Anti-Kickback Statute (AKS) is a federal law that prohibits the exchange or offer to exchange of anything of value to induce or reward the referral of business in a federal health care program. This law aims to prevent financial incentives that could corrupt medical decision-making and lead to increased costs for federal healthcare programs.
1. Prohibited Practices: The AKS prohibits any remuneration, including kickbacks, bribes, or rebates, that is intended to induce referrals for services covered by federal healthcare programs. This includes both direct and indirect payments.
2. Safe Harbors: The law provides for certain “safe harbors” that protect specific payment and business practices from prosecution if they meet certain requirements. These include space and equipment rentals, personal services and management contracts, and payments to bona fide employees.
Implications for Healthcare Real Estate
1. Lease Agreements: Lease agreements between healthcare providers and landlords must be carefully structured to ensure they do not involve payments for referrals. For example, rental rates must reflect fair market value and must not be influenced by the volume or value of referrals.
2. Joint Ventures: Joint ventures between healthcare entities and real estate investors must avoid arrangements where returns on investment are linked to the volume of referrals to federally funded healthcare programs.
3. Real Estate Transactions: Real estate transactions must be structured to avoid any implication that payments or benefits are provided in exchange for referrals. This requires detailed scrutiny of the terms and conditions of the transaction.
Ensuring compliance with the AKS requires thorough documentation and a clear separation of any payments from referral activities. Violations of the AKS can lead to severe penalties, including criminal charges, fines, and exclusion from federal healthcare programs.
Case Studies and Precedents
1. United States v. Tenet Healthcare Corporation (2016): Tenet Healthcare settled for $514 million, $368 million for civil penalties, and $145.8 million in criminal penalties to resolve allegations that it paid kickbacks for patient referrals through leasing arrangements. This case underscores the necessity for healthcare real estate transactions to comply with AKS requirements to avoid substantial financial and legal repercussions.8
2. United States v. South Florida Hospital and Healthcare Association (2015): This case involved allegations that a hospital system provided financial incentives to physicians for referrals, which were disguised as above-market rental payments for office space. The settlement highlighted the importance of ensuring that rental payments reflect fair market value and are not tied to referral volumes.
Conducting thorough due diligence and maintaining transparency in financial transactions are essential steps in mitigating risks associated with Stark Law, antitrust laws, and Anti-Kickback Statute compliance. Healthcare business professionals should:
Following established guidelines and best practices can further mitigate compliance risks. Healthcare entities should:
Stark Law, antitrust laws, and the Anti-Kickback Statute play crucial roles in regulating healthcare real estate, ensuring ethical financial relationships and promoting fair competition. While these laws present significant compliance challenges, understanding their provisions and implications is vital for healthcare real estate professionals. By adhering to best practices, conducting thorough due diligence, and seeking expert guidance, stakeholders can navigate these complex legal landscapes effectively, supporting the healthcare real estate sector’s growth and integrity. The case studies and precedents highlight the importance of compliance and the potential consequences of violations, underscoring the need for careful attention to regulatory requirements in healthcare real estate transactions.
HHS Office of Inspector General. (n.d.). Physician self-referral law [42 U.S.C. § 1395nn]. U.S. Department of Health and Human Services. Retrieved from https://oig.hhs.gov/compliance/physician-education/fraud-abuse-laws/
Social Security Act, 42 U.S.C. § 1395 (b) (2024). Retrieved from https://uscode.house.gov/view.xhtml?req=(title:42%20section:1395%20edition:prelim)
Treasury Regulation § 1.170A-1(c)(2), 26 C.F.R. (2024). https://www.law.cornell.edu/cfr/text/26/1.170A-1
Federal Trade Commission. (2017, March 22). Advocate Health Care Network. Retrieved from https://www.ftc.gov/legal-library/browse/cases-proceedings/1410231-advocate-health-care-network
Federal Trade Commission. (2015, February 10). St. Luke’s Health System, LTD, and Saltzer Medical Group, P.A. Retrieved from https://www.ftc.gov/legal-library/browse/cases-proceedings/121-0069-st-lukes-health-system-ltd-saltzer-medical-group-pa
Commonwealth v. UPMC. (2015, November 11). Casetext. https://casetext.com/case/commonwealth-v-upmc
HHS Office of Inspector General. (n.d.). Anti-Kickback Statute [42 U.S.C. § 1320a-7b(b)]. U.S. Department of Health and Human Services. Retrieved from https://oig.hhs.gov/compliance/physician-education/fraud-abuse-laws/
U.S. Department of Justice. (2016, October 3). Hospital chain will pay over $513 million for defrauding United States and making illegal payments. Retrieved from https://www.justice.gov/opa/pr/hospital-chain-will-pay-over-513-million-defrauding-united-states-and-making-illegal-payments
Written by Sydney Richards, CVA; Erica Veri
The value a brand brings to a strategic partnership is overlooked in many healthcare joint ventures and affiliations. However, healthcare brands may have a significant impact on a partnership’s success. Healthcare brands can suggest top outcomes to communities in the face of intense competition, attract and retain leading providers, and evoke a sense of loyalty and trust among the patient base. In many joint ventures and partnerships, completing a brand valuation allows the licensor to receive a financial return for their contribution of this important asset. Below, we outlined important factors that may be considered in a brand valuation.
Healthcare brands are commonly contributed to a partnership through a license agreement. The structure and terms of the brand licensure can significantly influence the value. For example, a brand license agreement may stipulate payment terms, which can be structured as an upfront equity in a partnership, a fixed annual payment, or a variable (royalty rate) payment. These terms can have a significant impact on how financial risk is or is not shared between the parties, especially for partnerships such as de novo joint ventures. The license agreement can also specify the duration of the brand contribution and specify whether the rights to the brand are exclusive to the proposed licensee or whether the licensor may enter other brand contributions simultaneously.
From the licensor’s perspective, extending the use of their brand to a partner can offer an opportunity to access a larger patient population without sizable investment in capital and infrastructure. A licensor also gains the opportunity to monetize the positive reputation associated with its brand, which has often been built over significant time, investment in expertise and care quality, and marketing spend. While these historical costs may be difficult to quantify, the quality and strength of the brand, especially as compared to peers, can and should be considered in a brand valuation.
One of the ways the brand strength, recognition, and positioning can be considered in the appraisal is through a “with and without” analysis, which seeks to quantify how forecasted earnings would differ for an opportunity with vs. without using the brand. These earnings can be impacted by items such as speed to ramp up for partnered de novo ventures, increased occupancy or utilization due to the community’s association of the brand with high quality care, margin effects of greater economies of scale, or even a favorable payer mix shift.
Additionally, other benefits may be captured in the with and without analysis, including access to clinical integration, clinical trials and research, facilities and equipment planning, and recruiting. If the licensee is a smaller entity with less market share than the licensor, it may desire to leverage the branding entity’s experience and knowledge of best practices while conveying the expertise and reliability of the larger brand to the patient population.
The cost to replicate considers what it may cost to develop and maintain a comparable brand. While many retail brands communicate price and prestige, healthcare brands typically emphasize a company’s quality patient service, positive outcomes, and reliability. A healthcare brand can also attract physicians and help in retaining talent. These qualities may take years, even decades, to develop. While there are certain quantifiable measures that can be included in a brand appraisal, such as advertising and marketing spend to build and maintain a brand, it can be difficult to measure the true costs to replicate brand value for many healthcare brands. Additionally, unless the licensee can generate a return on these costs, it would not be reasonable to assume they would be willing to pay for all historical costs unrelated to a particular licensing arrangement. As a result, this approach is commonly considered but may not directly drive a value indication for the specific payment a licensee should make for the use of the brand.
A licensee’s financial performance may have a material impact on the amount it can expect to pay in a licensing arrangement. Factors such as business stage (start up, growth, or mature), subindustry, margin, and operational capacity or constraints can directly impact the ability of a brand to drive incremental earnings to the licensee through use of the brand. A brand valuation for a license payment between two entities commonly includes a thorough examination of the licensee’s position in the local and greater market, performance compared to peers, and outlook.
There are numerous market sources for brand valuation comparables. While commonly considered and thoroughly analyzed, due to the uniqueness of each licensing opportunity, many lack direct comparability to the royalty rates published in publicly available databases, such as MARKABLES, ktMINE, and Scope Research. To the extent that there are brand comparables, a brand valuation should consider reasonable market ranges for similar assets and transactions.
Compared to many healthcare business or other asset valuations, healthcare brand valuations can be difficult. There can be uncertainty (and differences of opinion) on the go-forward impact a brand may have on a business. Although there are established general market ranges within healthcare segments, there are less direct market comparables compared to other partnership contributions, such as business equity or real estate value, for brands. With VMG Health on your team, you can expect the quality, responsiveness, and expertise your brand deserves to overcome these hurdles and drive a successful brand contribution and lasting partnership.
Written by Matthew Marconcini, CPA
Selling your company can be an exciting time, filled with potential opportunities for growth and new horizons. Whether your company is accrual based, following GAAP, or it reports on a cash basis, proper preparation for the sale of your company is extremely important. This journey often involves a complex web of financial transactions and negotiations, with numerous parties at the table. Among the critical elements in this process are financial due diligence and performing a quality of earnings (QOE) analysis. The QOE process is a critical aspect of financial reporting and analysis that helps stakeholders, like investors and creditors, assess the reliability and sustainability of a company’s reported earnings.
The QOE analysis can play a pivotal role in shaping the outcome of the sale and can significantly impact the perceived value of your business. Therefore, as management, it is essential to be well-prepared and proactive in assessing and evaluating the quality of your business’ earnings, as it influences the selling price and builds trust and confidence among potential investors and other stakeholders. We have outlined eight steps management can take to best prepare for the QOE process.
Management should have a clear understanding of what QOE means. It assesses the underlying economic substance of reported earnings, ensuring they are not distorted by accounting manipulations or one-time events.
Accurate financial record-keeping is fundamental to high-quality earnings. Management must ensure that financial statements are free from material misstatements and that all transactions are properly recorded.
Transparency is crucial. Ensure all material transactions, both positive and negative, are adequately disclosed in the financial statements and related footnotes.
Maintain consistency in financial reporting practices. Frequent changes in accounting policies can raise questions about the QOE. If policies do change, explain the rationale behind it and the financial impact of the change.
Recognize revenue in accordance with accounting standards only when it’s earned and realizable. Avoid prematurely recognizing revenue or engaging in overly aggressive practices. If your company reports on a cash basis, pulling together the proper data that will show revenue based on date of service rather than the collection date will be key.
Clearly distinguish between one-time or non-recurring events and ongoing operations in financial reporting. Disclose the nature and impact of such events to prevent misinterpretation.
Be prepared to provide a comprehensive and honest analysis of the company’s financial results. Explain the drivers of earnings, changes in accounting policies, and potential future risks and uncertainties. The more support you can provide related to both historical performance and future growth initiatives, the more accurate and comprehensive your analysis.
Take the time to review the various systems used to operate the business and start pulling data together. If certain systems are maintained by third parties, informing them of the situation and discussing what they need to do will create a smoother process. If certain reports don’t have the necessary inputs or data, be prepared to discuss that and what alternative information would be useful.
By considering these guidelines and implementing the underlying thought processes, management can best prepare for the QOE process, demonstrating a commitment to transparency, accuracy, and integrity in financial reporting. This, in turn, builds trust and credibility with investors and other stakeholders, creating a smooth transaction process for management.
Written by Christa Shephard and Maureen Regan, President Elect, NYSSPA
Physician assistants (PAs), soon to known as physician associates and advanced practice registered nurses (APRNs), like nurse practitioners (NPs), midwives, CRNAs, and clinical nurse specialists, have been around for decades. The first class of PAs graduated from Duke University in 1967, and in 1965, the first training program for NPs began at the University of Colorado. Since then, for many reasons, both professions have become integral to the quality delivery of healthcare. Although they have different education, training, and scope (PAs trained in medicine and APRNs in an advanced theory of nursing practice model) integrating these professionals into a practice can elevate the patient experience, as their access to the healthcare services they need will increase, and there could be an increase to the bottom-line financials of a practice as a result. Physicians experience greater job satisfaction, as PA and APRN integration helps to alleviate overburdened work schedules, including on-call obligations. Through these benefits, interprofessional integration leads to better patient retention, patient referrals, physician satisfaction, and stronger financial health for practices and health systems.
The Centers for Medicare & Medicaid Services (CMS) certainly plays a role in the practice and reimbursement environment of PAs and APRNs; however, most of the legislative and regulatory environment for practice is determined at the state level. Due to the evolution of each profession and the historical and ongoing shortage of physicians, it’s important for health systems and practices to stay abreast of primary source legislative and regulatory guidance changes regarding scope, documentation, and billing compliance. These factors are also important to ensure an employer is capturing maximum reimbursement for clinical work done by both professions while minimizing their risk of an audit and resulting penalties. Systems and practices must uphold an ongoing, longitudinal review of Medical Staff Bylaws, delineation of privileges, policies, and processes.
CMS recognizes qualified billing providers to render services independently and establishes billing and coding rules for PAs and APRNs to ensure accurate reimbursement and quality care delivery within the Medicare program. These rules outline the scope of practice and reimbursement guidelines for nurse practitioners, physician assistants, certified nurse-midwives, clinical nurse specialists, and certified registered nurse anesthetists who must adhere to specific documentation requirements, including maintaining accurate patient records and submitting claims using appropriate evaluation and management (E/M) codes, like physicians. Additionally, CMS provides guidance on incident-to billing, which allows certain services provided by PAs and APRNs to be billed under a supervising physician’s National Provider Identifier (NPI). Understanding and following CMS billing and coding rules are essential to navigate the complexities of reimbursement and ensure compliance with Medicare regulations.
Because CMS recognizes PAs and APRNs as qualified billing providers but not as physicians, they fall into a separate reimbursement category. When billing under their own NPI, the reimbursement level is less than what it would be if the physician were to bill for the same services. This reimbursement differential does not adversely impact a practice’s bottom line, as remuneration for a PA or APRN is less than a physician and malpractice cost is less.
Physicians may bill for a service that was rendered by a PA or APRN with incident-to services and with split/shared E/M services. VMG Health Managing Director and coding and compliance expert Pam D’Apuzzo says, “There’s two rules, which is where everybody gets themselves into trouble… Those two rules have specific guidelines, both from a documentation and a billing standpoint. The patient type, the service type—everything needs to be adhered to.”
To bill for incident-to and split/shared E/M services, practices must meet specific criteria outlined by Medicare. For incident-to services, the criteria include:
For split/shared E/M services, the criteria include:
These criteria ensure that incident-to and split/shared services are billed appropriately and in compliance with Medicare guidelines. Medicare also dictates that the “substantive portion” of a split or shared visit is more than half of the time a physician or non-physician practitioner spends performing the visit or a “substantive part” of the medical decision making. Practices must continually educate and train all medical staff so that they can successfully adhere to these criteria to avoid billing errors and potential audits. Additionally, practices must continuously monitor to ensure all documentation, billing, and coding processes are followed correctly.
There are tools and services that allow for easier monitoring. “We utilize a tool called Compliance Risk Analyzer, which provides us with statistical insight on coding practices,” D’Apuzzo says. “So, we can data mine ourselves and see what’s happening just based on our views. And this is what the payers, specifically, and the government does as well: They can see the [relative value units] RVUs are for a physician or off the chart, or that a physician has submitted claims for two distinct services at two different locations on the same day.”
This is more common than you might think.
“What’s normally happening in those interactions is that [a physician with two locations] realizes he can’t keep up with all of that patient flow in two places, so they hire a PA and put them at location number two,” D’Apuzzo says. “But now all that billing goes under the physician, so it flags for Medicare.”
With VMG Health’s Compliance Risk Analyzer (CRA), practices can see the same data mining and areas of risk, as the program would flag the RVUs as a potential audit risk. This gives practices the opportunity to self-audit and refine their processes to ensure they are billing and coding appropriately.
VMG Health offers multiple comprehensive services that help health systems and practices implement and follow new procedures and new provider utilization without issue, from honoring existing care models to ensuring provider compensation is fair, compliant, and reasonable.
Cordell Mack, VMG Health Managing Director, says, “We’ve spent a lot of time trying to make sure we get that right, both in terms of the underlying, practice-level agreements as well as the ways in which the compensation model works for both the physicians and the PAs and APRNs.”
In many practices, physicians struggle to handle their case load, which means their busy schedules can prevent them from seeing existing patients and from taking on new patients. Bringing PAs and APRNs into the fold allows physicians to create capacity in their schedules so that they can see new patients.
BSM Consulting (a division of VMG Health) Senior Consultant and subject matter expert Elizabeth Monroe provides an excellent example: “Let’s say we have an orthopedic surgeon who really wants to spend most of their time in surgery. We would want to have that physician in surgery because that’s what their skill set, and licensure permits. With a nurse practitioner or physician assistant providing follow-up, post-operative care, that oftentimes is a much better model. It allows the physician to do the surgical cases only they can do, but it also eases patient access to care.”
This realignment of a physician’s schedule creates an opportunity to provide more patient services, which easily translates to improved patient satisfaction when, without this, they would likely be unable to see their provider when they felt they needed to be seen. While PA and APRN–rendered Medicare services are reimbursed at 85% instead of 100%, our experts say that the 15% differential shouldn’t dissuade practices and health systems from leveraging the integration.
“It’s a very short-sighted approach to just think about, ‘But we could be making 100% instead of 85% if we bill under the doctor,’ because ultimately, we are never able to do that 100% of the time, and it’s a higher risk than it is reward,” says D’Apuzzo.
Additionally, physicians with packed schedules and no other scheduling options may inadvertently rush through appointments to see each patient scheduled for that day. Patients who feel rushed may leave an appointment feeling unheard and like their problem is unresolved. Additionally, when a patient calls and asks for services but can’t be seen for multiple weeks or months, they may never make an appointment and instead turn to another provider for help.
All of this culminates in poor patient retention, which equals a loss of revenue for the practice. Dissatisfied patients will seek treatment elsewhere. However, when practices and health systems embrace an interprofessional team, patients are more likely to be able to schedule appointments when they feel they need to be seen, feel heard in an appointment and even spend less time in the office overall as they are not impacted by OR cases running late, and so on.
“Practices are better able to meet patient demand, and they’re able to really allow physician assistants, nurses… to add a tremendous value for the patients, offering them outstanding care,” Monroe says.
With both patient demand and physician scarcity placing the U.S. health system in crisis, many practices and health systems know they need to integrate PAs and APRNs into their workflows, but they don’t know how. VMG Health offers strategic advisory services that can guide this implementation to ensure practices are educated, compliant, and working within the care model they prefer.
“Our team would want to spend time really trying to identify the underlying care model that practices are trying to, you know, work inside of,” says Mack.
One approach is to assess patient needs and practice capabilities to determine the most effective roles for PAs and APRNS, such as providing primary care, specialty care, or supporting services like telemedicine. Implementing policies and workflows can ensure efficient PA and APRN utilization while maintaining quality and safety standards.
Finally, ongoing training, quality monitoring are essential to ensure their interprofessional integration into the practice or health system effectively meets patient needs, and care provided by PAs and NPs should be included into physician quality and compliance review processes.
“It starts with getting your appropriate documentation in place… [with] supervisory responsibilities and collaborating physician agreements,” says Mack. “It migrates to, ‘What’s the operational agreement among the team?’ and how cases are presented, or how the physician is consulted. So, it’s getting an underlying clinical service agreement among those professionals.”
Optimal PA and APRN utilization shows up in the numbers. When practices increase patient access to care without overburdening physicians, they can accommodate more patients, leading to increased revenue generation. Moreover, because PAs and APRNs often bill at a lower rate than physicians, integrating them efficiently can improve cost-effectiveness, thereby enhancing the overall financial performance of the practice.
“It should realize an ROI, and that ROI should be something more in terms of duties and tasks that other teammates can’t do,” says Mack. “Meaning, it would be unfortunate if a qualified healthcare professional is working at such a capacity whereby duties some of the day-to-day responsibilities should probably be done by teammates working at a higher level of their own individual license.”
Changing existing workflows can be difficult, but the rewards heavily outweigh the risks. Physicians must support interprofessional integration to successfully navigate the transition. Physicians are typically the leaders and decision-makers within medical practices, and their support is essential for implementing any significant changes in workflow or care delivery models, which includes having front office staff, medical assistants, nursing and administrative staff rely and respect the roles of PAs and APRNs. Without physician buy-in, resistance to change may arise, hindering smooth integration and retention.
Physicians play a vital role in collaborating and ensuring a seamless care model is implemented and sustained. By endorsing and supporting the integration of PAs and APRNS, physicians can foster a culture of teamwork and mutual respect within the practice. This collaborative approach promotes a cohesive care team to provide high-quality patient care.
It’s important for physicians to trust and communicate that PAs and NPs are qualified and capable of providing excellent patient care. Allowing them to care for an established patient does not sever the relationship between the physician and the patient; it can actually enhance the patient’s experience and trust in the practice.
“We want patients who have had a long-standing relationship with an MD to be able to see that doctor, and then we want to help the doctor know and understand how to appropriately transfer care over to an APRN within their system or within their practice,” says Monroe. “So, that provider can be still linked to the doctor, and the doctor can still be linked to the patient.”
Furthermore, physician buy-in is essential for maintaining continuity of care and ensuring patients feel confident in receiving treatment from both physicians and PAs and NPs. When physicians actively endorse interprofessional integration and communicate the benefits of team-based care to their patients, it builds trust and acceptance of the practice model. It also fosters billing transparency if a patient gets an EOB with the name of someone other than the physician as the rendering provider.
Physician engagement is critical for the long-term success and sustainability of integration initiatives. When physicians recognize the value that PAs and APRNs bring to the practice, including increased efficiency, expanded access to care, and improved patient outcomes, they are more likely to champion these initiatives and advocate for their continued support and development.
The integration of PAs and APRNs into medical practices and health systems presents a strategic opportunity to optimize patient care delivery and operational efficiency. By expanding access to healthcare services and alleviating the workload of overburdened physicians, integration improves patient and employee satisfaction, and enhances patient retention. However, successful integration requires careful attention to regulatory compliance, billing, and coding practices. VMG Health offers comprehensive billing, coding, and strategy advisory services to support practices in navigating the complexities of integration, ensuring compliance with Medicare regulations, and maximizing reimbursement while minimizing audit risk.
Optimal PA and APRN utilization yields tangible benefits, including increased patient access to care, improved patient satisfaction, and enhanced financial performance. By understanding their education, training, and scope, and by leveraging their unique skill sets, practices can accommodate more patients, reduce wait times, and deliver high-quality care cost effectively. Physician engagement is essential for the successful implementation of integration initiatives, as physicians play a pivotal role in endorsing and supporting interprofessional responsibilities within the care team. Through collaborative leadership and effective communication, physicians can foster a culture of teamwork and mutual respect, driving the long-term success and sustainability of integration efforts.
In summary, strategic integration presents a transformative opportunity for medical practices and health systems to meet evolving patient needs, enhance operational efficiency, and achieve sustainable growth. By partnering with VMG Health for expert guidance and support, practices can navigate the complexities of interprofessional integration with confidence, realizing the full potential of this innovative care delivery model.
Maureen C. Regan, MBA, PA-C, FACHE, DFAAPA, is the President-Elect and Past President of the New York State Society of Physician Assistants (NYSSPA) and a Delegate for the American Academy of Physician Associates (AAPA). She is recognized as a Fellow of the American College of Healthcare Executives (FACHE) and a Distinguished Fellow of the American Academy of Physician Associates (DFAAPA). The views expressed in this article are her opinion and do not represent the opinions of any organization or association she is affiliated with.
American Academy of Physician Associates. (n.d.). History of AAPA. Retrieved from https://www.aapa.org/about/history/
American Medical Association. (2022). AMA president sounds alarm on national physician shortage. Retrieved from https://www.ama-assn.org/press-center/press-releases/ama-president-sounds-alarm-national-physician-shortage
Centers for Medicare & Medicaid Services. (2023). Advanced practice nonphysician practitioners. Medicare Physician Fee Schedule. https://www.cms.gov/medicare/payment/fee-schedules/physician-fee-schedule/advanced-practice-nonphysician-practitioners
Centers for Medicare & Medicaid Services. (2023). Advanced Practice Registered Nurses (APRNs) and Physician Assistants (PAs) in the Medicare Program. Retrieved from https://www.cms.gov/medicare/payment/fee-schedules/physician-fee-schedule/advanced-practice-nonphysician-practitioners
Centers for Medicare & Medicaid Services. (2023). Incident-to billing. Medicare. https://www.cms.gov/medicare/payment/fee-schedules/physician-fee-schedule/advanced-practice-nonphysician-practitioners
Centers for Medicare & Medicaid Services. (2023). Medicare Physician Fee Schedule final rule summary for calendar year 2024. https://www.cms.gov/files/document/mm13452-medicare-physician-fee-schedule-final-rule-summary-cy-2024.pdf
Mujica-Mota, M. A., Nguyen, L. H., & Stanley, K. (2017). The use of advance care planning in terminal cancer: A systematic review. Palliative & Supportive Care, 15(4), 495-513. https://www.ncbi.nlm.nih.gov/pmc/articles/PMC5594520/