


Insights into Healthcare Provider Compensation Trends for 2024
Christa Shephard
March 4, 2024

Written by Christa Shephard, Maureen Regan
Physician assistants (PAs) and advanced practice registered nurses (APRNs), like nurse practitioners (NPs), midwives, CRNAs, and clinical nurse specialists, have been around for decades. The first class of PAs graduated from Duke University in1967, and in 1965, the first training program for NPs began at the University of Colorado. Since then, for many reasons, both professions have become integral to the quality delivery of healthcare. Through advanced practice nonphysician provider (APP) integration, patients experience increased access to the healthcare services they need, and they are more satisfied with the care they receive. Physicians experience greater job satisfaction, as APP integration helps to alleviate the burden on overburdened work schedules. Through these benefits, APP integration leads to better patient retention, physician satisfaction, and stronger financial health for practices and health systems overall.
The Centers for Medicare & Medicaid Services (CMS) certainly plays a role in the practice and reimbursement environment of PAs and APRNs; however, most of the legislative and regulatory environment for practice is determined at the state level. Due to the evolution of each profession and the historical and ongoing shortage of physicians, it’s important for health systems and practices to stay abreast of primary source legislative and regulatory guidance changes regarding scope, documentation, and billing compliance. These factors are also important to ensure an employer is capturing maximum reimbursement for clinical work done by both professions while minimizing their risk of an audit and resulting penalties. Systems and practices must uphold an ongoing, longitudinal review of Medical Staff Bylaws, delineation of privileges, policies, and processes.
CMS recognizes qualified billing providers to render services independently and establishes billing and coding rules for APPs to ensure accurate reimbursement and quality care delivery within the Medicare program. These rules outline the scope of practice and reimbursement guidelines for nurse practitioners, physician assistants, certified nurse-midwives, clinical nurse specialists, and certified registered nurse anesthetists. APPs must adhere to specific documentation requirements, including maintaining accurate patient records and submitting claims using appropriate evaluation and management (E/M) codes. Additionally, CMS provides guidance on incident-to billing, which allows certain services provided by APPs to be billed under a supervising physician’s National Provider Identifier (NPI). Understanding and following CMS billing and coding rules are essential for APPs to navigate the complexities of reimbursement and ensure compliance with Medicare regulations.
Because CMS recognizes APPs as qualified billing providers but not as physicians, APPs fall into a separate reimbursement category. When APPs are billing under their own NPI numbers, the reimbursement level is less than what it would be if the physician were to bill for the same services. Physicians may bill for a service that was rendered by an APP with incident-to services and with split/shared E/M services.
VMG Health Managing Director and coding and compliance expert Pam D’Apuzzo says, “There are two rules, which are where everybody gets themselves into trouble… Those two rules have specific guidelines, both from a documentation and a billing standpoint. The patient type, the service type—everything needs to be adhered to.”
To bill for incident-to and split/shared E/M services, practices must meet specific criteria outlined by Medicare. For incident-to services, the criteria include:
For split/shared E/M services, the criteria include:
These criteria ensure that incident-to and split/shared services are billed appropriately and in compliance with Medicare guidelines. Practices must continually educate and train so that they can successfully adhere to these criteria to avoid billing errors and potential audits. Additionally, practices must continuously monitor to ensure all documentation, billing, and coding processes are followed correctly.
There are tools and services that allow for easier monitoring. “We utilize a tool called Compliance Risk Analyzer, which provides us with statistical insight on coding practices,” D’Apuzzo says. “So, we can data mine ourselves and see what’s happening just based on our views. And this is what the payors, specifically, and the government does as well: They can see the [relative value unites] RVUs are for a physician or off the chart, or that a physician has submitted claims for two distinct services at two different locations on the same day.”
This is more common than you might think.
“What’s normally happening in those interactions is that [a doctor with two locations] realizes he can’t keep up with all of that patient flow in two places, so they hire a PA and put them at location number two,” D’Apuzzo says. “But now all that billing goes under the doctor, so it flags for Medicare.”
With VMG Health’s Compliance Risk Analyzer (CRA), practices can see the same data mining and areas of risk, as the program would flag the RVUs as a potential audit risk. This gives practices the opportunity to self-audit and refine their processes to ensure they are billing and coding appropriately.
VMG Health offers multiple comprehensive services that help health systems and practices implement and follow new procedures like APP utilization without issue, from honoring existing care models to ensuring provider compensation is fair, compliant, and reasonable.
Cordell Mack, VMG Health Managing Director, says, “We’ve spent a lot of time trying to make sure we get that right, both in terms of the underlying, practice-level agreements as well as the ways in which the compensation model works for both the physician and the APP.”
In many practices, physicians struggle to handle their case load, which means their busy schedules can prevent them from seeing existing patients when they need services and from taking on new patients. Bringing APPs into the fold allows physicians to offload some of their patient care so that they can see new patients while APPs see more established patients.
BSM Consulting (a division of VMG Health) Senior Consultant and subject matter expert Elizabeth Monroe provides an excellent example: “Let’s say we have an orthopedic surgeon who really wants to spend most of their time in surgery. We would want to have that physician in surgery because that’s what their skill set and licensure permits. With a nurse practitioner or physician assistant providing follow-up, post-operative care, that oftentimes is a much better model. It allows the MD to do the surgical cases only they can do, but it also eases patient access to care.”
This expansion of a physician’s schedule creates an opportunity to provide more patient services, which easily translates to improved patient satisfaction when, without this expansion, they would likely be unable to see their provider when they felt they needed to be seen. While APP-rendered services are reimbursed at 85% instead of 100%, our experts say that missing 15% shouldn’t dissuade practices and health systems from leveraging the APP integration.
“It’s a very short-sighted approach to just think about, ‘But we could be making 100% instead of 85% if we bill under the doctor,’ because ultimately, we are never able to do that 100% of the time, and it’s a higher risk than it is reward,” says D’Apuzzo.
Additionally, physicians with packed schedules and no APP support may inadvertently rush through appointments to see each patient scheduled for that day. Patients who feel rushed may leave an appointment feeling unheard and like their problem is unresolved. Alternatively, when a patient calls and asks for services but can’t be seen for multiple weeks or months, they may never make an appointment and instead turn to another provider for help.
All of this culminates in poor patient retention, which equals a loss of revenue for the practice. Dissatisfied patients will seek better treatment and better outcomes elsewhere. However, when practices and health systems embrace APP support, patients are more likely to be able to schedule appointments when they feel they need to be seen, feel heard in an appointment with an APP who has the time to sit and listen, and even spend less time in the doctor’s office overall, as patient wait times significantly decrease with APP appointments.
“Practices are better able to meet patient demand, and they’re able to really allow physician assistants, nurses… to add a tremendous value for the patients, offering them outstanding care,” Monroe says.
With both patient demand and physician scarcity placing the U.S. health system in crisis, many practices and health systems know they need to integrate APPs into their workflows, but they don’t know how. VMG Health offers strategic advisory services that can guide this implementation to ensure practices are educated, compliant, and working within the care model they prefer.
“Our team would want to spend time really trying to identify the underlying care model that practices are trying to, you know, work inside of,” says Mack.
One approach is to assess patient needs and practice capabilities to determine the most effective roles for APPs, such as providing primary care, specialty care, or supporting services like telemedicine. Implementing standardized protocols and workflows can ensure efficient APP utilization while maintaining quality and safety standards.
Finally, ongoing training, supervision, and quality monitoring are essential to support APPs and ensure their integration into the practice or health system effectively meets patient needs.
“It starts with getting your appropriate documentation in place… [with] supervisory responsibilities and collaborating physician agreements,” says Mack. “It migrates to, ‘What’s the operational agreement among the APP and the doctor?’ and how cases are presented, or how the physician is consulted. So, it’s getting an underlying clinical service agreement among those professionals.”
Optimal APP utilization shows up in the numbers. When practices increase patient access to care without overburdening physicians through APP utilization, they can accommodate more patients, leading to increased revenue generation. Moreover, because APPs often bill at a lower rate than physicians, utilizing them efficiently can improve cost-effectiveness, thereby enhancing the overall financial performance of the practice.
“It should realize an ROI, and that ROI should be something more in terms of duties and tasks that other teammates can’t do,” says Mack. “Meaning, it would be unfortunate if an advanced practice professional is working at such a capacity whereby duties some of the day-to-day responsibilities should probably be done by teammates working at a higher level of their own individual license.”
Changing existing workflows can be difficult, but the rewards heavily outweigh the risks. Physicians must support APP integration to successfully navigate the transition. Physicians are typically the leaders and decision-makers within medical practices, and their support is essential for implementing any significant changes in workflow or care delivery models. Without physician buy-in, resistance to change may arise, hindering the smooth integration of APPs into the practice.
Physicians play a vital role in collaborating with APPs and delegating tasks effectively. By endorsing and supporting the integration of APPs, physicians can foster a culture of teamwork and mutual respect within the practice. This collaborative approach promotes a cohesive care team where APPs work alongside physicians to provide high-quality patient care.
It’s important for physicians to trust that their APPs are qualified and capable of providing excellent patient care. Allowing an APP to care for an established patient does not sever the relationship between the physician and the patient; it can actually enhance the patient’s experience and trust in the practice.
“We want patients who have had a long-standing relationship with an MD to be able to see that doctor, and then we want to help the doctor know and understand how to appropriately transfer care over to an APP within their system or within their practice,” says Monroe. “So, that provider can be still linked to the doctor, and the doctor can still be linked to the patient.”
Furthermore, physician buy-in is essential for maintaining continuity of care and ensuring patients feel confident in receiving treatment from both physicians and APPs. When physicians actively endorse the role of APPs and communicate the benefits of team-based care to their patients, it builds trust and acceptance of APP-provided services.
Physician engagement is critical for the long-term success and sustainability of APP integration initiatives. When physicians recognize the value that APPs bring to the practice, including increased efficiency, expanded access to care, and improved patient outcomes, they are more likely to champion these initiatives and advocate for their continued support and development.
The integration of APPs into physician practices and health systems presents a strategic opportunity to optimize patient care delivery and operational efficiency. By expanding access to healthcare services and alleviating the workload of overburdened physicians, APP integration improves patient and employee satisfaction, and enhances patient retention. However, successful integration requires careful attention to regulatory compliance, billing, and coding practices. VMG Health offers comprehensive billing, coding, and strategy advisory services to support practices in navigating the complexities of APP integration, ensuring compliance with Medicare regulations, and maximizing reimbursement while minimizing audit risk.
Optimal APP utilization yields tangible benefits, including increased patient access to care, improved patient satisfaction, and enhanced financial performance. By leveraging APPs’ unique skill sets, practices can accommodate more patients, reduce wait times, and deliver high-quality care cost-effectively. Physician engagement is essential for the successful implementation of APP integration initiatives, as physicians play a pivotal role in endorsing and supporting APPs within the care team. Through collaborative leadership and effective communication, physicians can foster a culture of teamwork and mutual respect, driving the long-term success and sustainability of APP integration efforts.
In summary, strategic APP integration presents a transformative opportunity for physician practices and health systems to meet evolving patient needs, enhance operational efficiency, and achieve sustainable growth. By partnering with VMG Health for expert guidance and support, practices can navigate the complexities of APP integration with confidence, realizing the full potential of this innovative care delivery model.
American Academy of Physician Assistants. (n.d.). History of AAPA. Retrieved from https://www.aapa.org/about/history/
American Medical Association. (2022). AMA president sounds alarm on national physician shortage. Retrieved from https://www.ama-assn.org/press-center/press-releases/ama-president-sounds-alarm-national-physician-shortage
Centers for Medicare & Medicaid Services. (2023). Advanced practice nonphysician practitioners. Medicare Physician Fee Schedule. https://www.cms.gov/medicare/payment/fee-schedules/physician-fee-schedule/advanced-practice-nonphysician-practitioners
Centers for Medicare & Medicaid Services. (2023). Advanced Practice Registered Nurses (APRNs) and Physician Assistants (PAs) in the Medicare Program. Retrieved from https://www.cms.gov/medicare/payment/fee-schedules/physician-fee-schedule/advanced-practice-nonphysician-practitioners
Centers for Medicare & Medicaid Services. (2023). Incident-to billing. Medicare. https://www.cms.gov/medicare/payment/fee-schedules/physician-fee-schedule/advanced-practice-nonphysician-practitioners
Mujica-Mota, M. A., Nguyen, L. H., & Stanley, K. (2017). The use of advance care planning in terminal cancer: A systematic review. Palliative & Supportive Care, 15(4), 495-513. https://www.ncbi.nlm.nih.gov/pmc/articles/PMC5594520/
At VMG Health, we’re dedicated to sharing our knowledge. Our experts present at in-person conferences and virtual webinars to bring you the latest compliance, strategy, and transaction insight. Sit down with our in-house experts in this blog series, where we unpack the five key takeaways from our latest speaking engagements.
I spoke with King and Spalding attorney Kim Roeder on different, hot-button issues that arise when structuring and valuing different value-based arrangements. It started off as a presentation of different case studies and focused on what Roeder has encountered from a legal perspective and what I have encountered from a valuation perspective. We often receive questions when it comes to structure or even value drivers, and we wanted to present solutions to what we saw or clients struggling with so that they could develop a better understanding of them.
The focus on the metrics themselves and how carefully they need to be considered seemed to be the most surprising. Recent regulations have been really focused on metrics, and that’s what we get the most questions about. I think our audience was also surprised to learn that Kim had experienced those questions as well, and metrics aren’t just a consideration on the valuation perspective. Both legal and valuation perspectives must carefully consider metrics.
Our presentation was a very pragmatic way of illustrating six key issues that often come up during valuation. It’s a great resource for healthcare leaders to reference as they go through and check the boxes to ensure they have thought through all of the considerations that we often see as eleventh-hour issues.
I co-wrote a section of the 2023 Physician Alignment: Tips and Trends Report that discusses quality incentives for providers. It captures key factors to consider, from a valuation perspective, when looking to enter value-based arrangements and where to start.
Value-based arrangements require a very orchestrated balance between legal and compliance, operational champions, and valuation teams. Operational teams should be able to focus on what changes and improvements they want to implement, valuation teams must have an understanding of those goals, and legal and compliance must be involved to ensure the approach is appropriate and compliant. Without cohesion between these three groups, we see those eleventh-hour issues pop up.
Our team serves as the single source for your valuation, strategic, and compliance needs. If you would like to learn more about VMG Health, get in touch with our experts, subscribe to our newsletter, and follow us on LinkedIn.
Written by Cordell Mack, MPT, MBA
Hospitals and health systems have been developing strategies for vertical integration with physician groups for decades. Through the premise of integrated care delivery, “defined as a coherent set of methods and models on the funding, administrative, organizational, service delivery and clinical levels,” U.S. policymakers, healthcare operators and payors expect to improve the quality, service and efficiency of healthcare services. Results of value generated through integrated delivery models are mixed, and the operating model is often confounded with varying market dynamics (payor concentration, culture, physician supply/demand, leadership, etc.) by community.
Regardless of integrated care delivery success, health system employment continues to increase and today accounts for greater than 50% of all practicing physicians. Interestingly and unknown to many, other strategics (private equity, Optum, CVS, etc.) account for approximately another 25%, leaving approximately a quarter of physicians organized in a private practice.

Source: Physicians Advocacy Institute: Physician Practice Trends Specialty Report
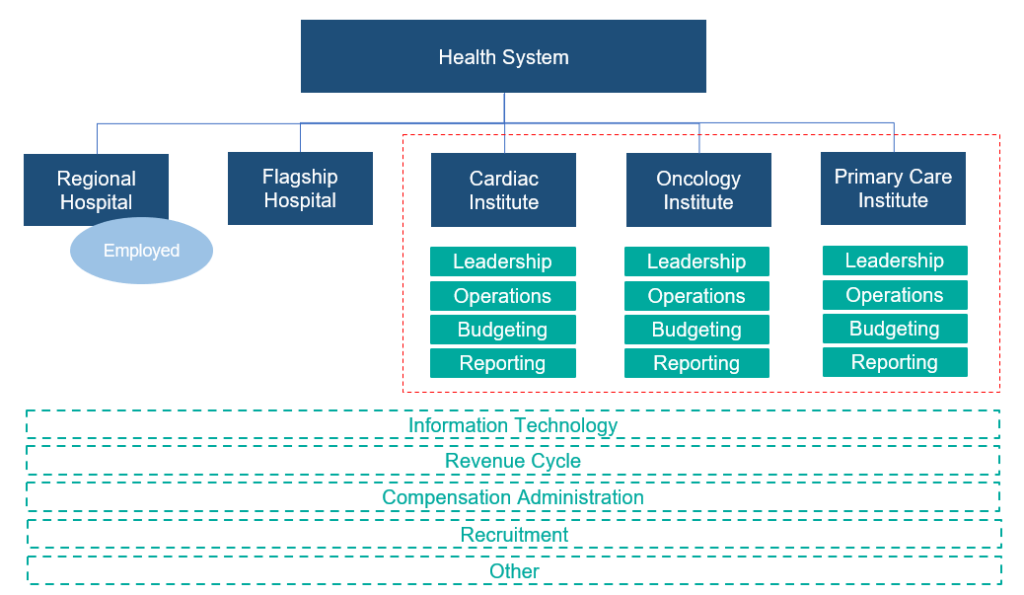
Across many integrated delivery systems, physicians are organized under a formal medical group structure, often with supporting leadership, governance, and practice management systems. This structure essentially groups the collective interests of primary care, surgical subspecialists, medical subspecialists, and hospital-based physicians together. Unlike independent, multispecialty practices who have an underpinning of sharing economics, most multispecialty groups in integrated delivery systems lack material financial alignment across subspecialties.
To this end, there are several challenges with a multispecialty group structure in health systems, including an aggregation of physician losses whereby various revenue streams (e.g., in-office ancillaries) have been integrated with hospital operations, sensitivity to practice losses based on confounding facts as to the true operating performance, silo board and/or decision making, and frustration by large clinical service lines due to widely held convention that everything needs to be the same for all physicians across the physician enterprise. Figure 2 outlines the most prevalent medical group structure and its multispecialty orientation.

Financial system reporting remains inconsistent across organizations; however, there are data repositories that suggest continued median subsidies for employed providers. As figure 3 outlines, regardless of timing and/or subspecialty orientation, there remains a significant net investment per provider.
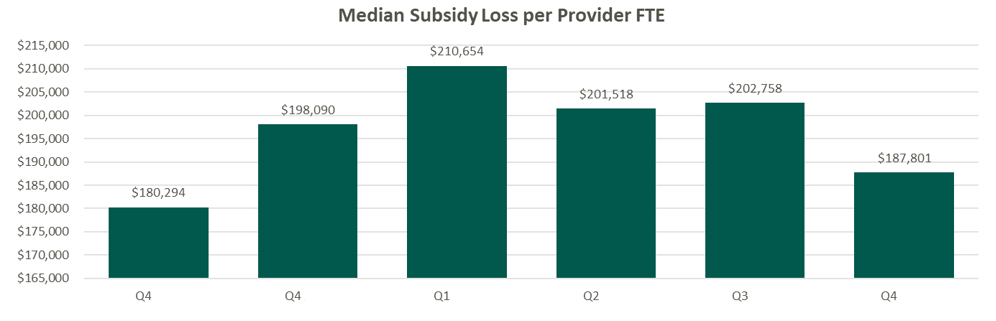
Source: Kaufman Hall Flash Reports
Based on VMG Health’s experience, significant financial reporting subsidies lead to suboptimized decision making, as significant pressure is placed on medical group leadership to reduce practice losses and improve overall practice performance. This has led to a variety of strategic missteps for organizations operating in competitive markets.
As an alternative, VMG Health has been working with clients to reorganize physician enterprise offerings inside of integrated delivery systems, including the development of financial reporting, management, and governance systems that better align care delivery across service lines. These more contemporary structures, while variable system to system, are all designed to:
The landscape of physician organizational structures within hospitals and health systems remains in transition. While traditional, multispecialty group practice models remain prevalent, challenges such as physician losses and inconsistent financial reporting have spurred the need for more contemporary structures. Through strategic reorganization and improved governance, health systems can enhance physician loyalty, accountability, growth, and operational efficiency, ultimately optimizing care delivery and aligned (or improved) financial performance.
Heeringa, J., et. al. (2020). Horizontal and Vertical Integration of Health Care Providers: A Framework for Understanding Various Provider Organizational Structures. National Library of Medicine. https://www.ncbi.nlm.nih.gov/pmc/articles/PMC6978994/
Written by Carla Zarazua, Preston Edison, and James Tekippe, CFA
Radiopharmaceutical drugs (RPs) are “radioactive substances used for diagnostic or therapeutic purposes.” To effectively diagnose and treat diseases, physicians need to have access to radiopharmaceutical agents that will assist with detecting and treating medical conditions. The current pricing methodology for RPs under the Centers for Medicare and Medicaid Services (CMS) has created a financial burden on hospitals and health systems. In addition, it has created a barrier to patient access when considering the utilization of diagnostic RPs in hospital outpatient departments. This article will outline the challenges created by the current CMS payment structure and outline steps hospitals and health systems can take to remain compliant with fair market value (FMV) and commercial reasonableness (CR) while CMS reconsiders its position.
In the 2008 Hospital Outpatient Prospective Payment System (HOPPS) final rule, CMS opted to categorize all diagnostic RPs as supplies rather than drugs. Under this current pricing structure, the reimbursement for diagnostic RPs is bundled into the technical procedure rate, known as a “policy-packaged drug.” CMS categorizes procedures with similar costs and clinical work effort into an ambulatory payment classification (APC) group. All procedures in an APC group are reimbursed at the same rate based on the average cost of all the procedures within that APC, inclusive of the primary service, ancillary service, and drug. As such, there is a set price for procedures in an APC group regardless of the policy-packaged drug in use. Unfortunately, this pricing methodology can create a misalignment in the expense incurred to acquire an RP and the reimbursement received from CMS, especially for high-cost drugs.
A report issued by the U.S. Government Accountability Office indicated that CMS will encourage hospitals to use the most effective resource that minimizes costs while still being able to meet the patient care needs. In addition, the structure does not incentivize medically unnecessary services and encourages hospitals to negotiate drug purchase pricing with manufacturers.
There is a temporary exception to the pricing for RPs for new and high-costs drugs, which can qualify for a pass-through period of two to three years. Under the pass-through methodology, the RP will be paid separately from the technical procedure rate at the average sales price + 6% incurred by a provider for the RP. Although this provides some relief to the misalignment of costs and reimbursement for RPs, the pass-through period is finite for an RP, and once outside of the pass-through period, an RP will be bundled or “packaged” within the APC procedure rate. Although CMS’ intent is understandable, under the current pricing model, hospitals may face a challenging financial burden, and providers may be confronted with difficult decisions that may impact patient care.
In the post-COVID era, hospitals have increased focus on increasing margins and reducing costs, and the current payment structure for RPs is putting increased pressure on the hospitals’ and health systems’ bottom line. Various stakeholders have voiced concerns about the economic burden resulting from CMS’ payment structure for RPs. For example, the American Medical Association indicated that, for financial reasons, hospitals may need to limit or end the use of radiopharmaceuticals, especially the high-cost or newer ones, given the misalignment in reimbursement. In addition, the American Hospital Association has put out a statement that the 2024 HOPPS final rule is an “inadequate update to hospital payments.” Hospitals and health systems unfortunately face heavy financial risk if a provider chooses to select a policy-packaged, high-cost drug that is more than the APC payment rate for a procedure. For this reason, hospitals may want to limit the use of the high-cost drugs by its providers, which may cause patients to receive sub-optimal care.
Given this dynamic, providers may choose not to utilize more expensive or advanced RPs, although it may be better off for a patient in the long term. As indicated by the Medical Imaging & Technology Alliance (MITAS), utilizing an advanced RP would be more beneficial in the patient’s overall treatment management, as these RPs have earlier, more accurate detection and can actually reduce the use of other unnecessary treatments because physicians will be in a better position to understand and treat the disease. Even more challenging, some advanced RPs truly have no alternative or substitute, so concerns about costs may result in the use of a less effective RP, which could result in misdiagnoses and ill-tailored treatment plans. Lastly, the lack of reimbursement inhibits innovation and development of new drugs because drug manufacturers would not be incentivized to continue the research and development if the drugs have a low clinical use.

As demonstrated above, there are several issues with the current pricing structure for RPs, but CMS has asked for comments on potential remedies. In the 2024 CMS proposed rule, CMS outlined the following five alternative payment models for RPs:
While various stakeholders appreciate CMS requesting and seeking recommendations on changes to the structure, many stakeholders such as MITAS and the American College of Radiology (ACR) recommend that “CMS establish separate payment for diagnostic radiopharmaceuticals, including a per day cost threshold based on average sales price (ASP) + 6% methodology.” Stakeholders believe this method will allow for adequate reimbursement and treatment access options for patients.
Unfortunately, CMS did not make a decision on how to move forward with the reimbursement structure for radiopharmaceuticals in the 2024 HOPPS final rule. Given the potential, pending changes in reimbursement, and the fact that CMS reimburses some RPs at a lower amount than it costs to acquire them, it is important for hospital outpatient departments to document and outline a plan with their care teams on how best to use RPs within their organization to remain compliant when it comes to FMV and CR. As such, VMG Health has outlined some important factors to consider for each compliance component in the interim.
Fair Market Value:
Although, the price paid for the drug may be within market range upon determining FMV, CMS may not reimburse at this rate for certain RPs. As such, given that CMS is the most widely cited market comparable and a market maker in terms of how these drugs are reimbursed, hospitals may find that they are losing on these types of arrangements. For this reason, it is important to document the legitimate business purpose of the use of the RP:
Commercial Reasonableness:
While CMS hasn’t reached a solution on the changes to reimbursement for RPs, it is important for hospitals and health systems to consider the financial and patient care implications of what RPs providers use. Developing compliance protocols around how best to determine the utilization of these RPs can minimize the risk placed on patients and hospitals.
GAO. (2021). Medicare Part B Payments and Use for Selected New, High-Cost Drugs. United States Government Accountability Office. https://www.gao.gov/assets/720/712727.pdf
SNMMI. (2008). Radiopharmaceutical Reimbursement Under Meidcare: Recommendations for Reform. Socity of Nuclear Medicine and Molecular Imaging. https://s3.amazonaws.com/rdcms-snmmi/files/production/public/docs/Radiopharmaceutical_Reimbursement_Policy_Ltrhd_5-22-08.pdf
Klitzke, A. (2023). Passage of the Facilitating Innovative Nuclear Diagnostics (FIND) Act. American Medical Association Organized Medical Staff Section. https://www.ama-assn.org/system/files/i23-omss-resolution-7.pdf
American Hospital Association. (2023). In OPPS rule, CMS increases payment rates by 3.1%, modifies price transparency rules. AHA. https://www.aha.org/news/headline/2023-11-02-opps-rule-cms-increases-payment-rates-31-modifies-price-transparency-rules
Hope, P. (2023). Comments on CMS–1786–P: CY 2023 Medicare Program: Hospital Outpatient Prospective
Payment and Ambulatory Surgical Center Payment Systems; etc. MITA. https://www.medicalimaging.org/docs/librariesprovider3/mitadocuments/2023.09.11-mita-comments-on-cy-2024-hopps-proposed-rule.pdf?sfvrsn=7c8627e_3/
Stempniak, M. (2023). CMS seeks feedback on issuing separate payment for diagnostic radiopharmaceuticals. Radiology Business. https://radiologybusiness.com/topics/healthcare-management/healthcare-policy/cms-seeks-feedback-issuing-separate-payment-diagnostic-radiopharmaceuticals
American College of Radiology. (2023). ACR Submits Radiology-Specific Comments About the 2024 HOPPS Proposed Rule. ACR. https://www.acr.org/Advocacy-and-Economics/Advocacy-News/Advocacy-News-Issues/In-the-Sept-16-2023-Issue/ACR-Submits-Radiology-Specific-Comments-About-the-2024-HOPPS-Proposed-Rule
By: John Meindl, CFA
Academic Medical Centers (AMCs) are facing unique challenges and opportunities in the current environment. With healthcare systems becoming more complex and dynamic, AMCs are adapting their strategies to preserve their inherent strengths and capitalize on evolving industry dynamics. One of the main challenges facing AMCs is the shortage of physicians, which is predicted to become more acute in the coming years. At the same time, revenue from higher-margin care is eroding as new businesses are capturing market share. As AMCs play an outsized role in solving labor shortages, they have also been forced to adapt to the financial pressures. Here we examine some of the major financial and strategic opportunities available to AMCs.
Many successful academic medical centers have adopted a hub-and-spoke model where the AMC serves as the hub and partners with community hospitals, medical complexes, for-profit hospitals, and pure-play service providers as the spokes. This model can improve care coordination to the appropriate site of care while expanding the population basis to support the growth or addition of specialty service lines.
AMCs entering new partnerships are doing so from a position of strength. Typical AMCs have a unique ability to effectively deliver highly complex care. Additionally, most AMCs have a strong and trusted brand in the communities they serve. However, access has long been a traditional weakness with patients struggling to access AMC facilities promptly. To address the access issue while capitalizing on strengths, AMCs are rethinking their approach to partnerships to provide easier channels for reaching their patients. Access to a more diverse population improves patient experiences, lowers cost structures, and provides revenue opportunities. Successful AMC partnerships may even end up being site-of-care agnostic, achieving the most optimum clinical outcomes while compensating all parties for their respective contributions.
However, partnering with non-academic medical centers poses some challenges. AMCs need to ensure that their partners provide the same quality of care and adhere to best practices, while also maintaining the AMC’s own high standards.
Well-capitalized AMCs can invest individually in ancillary services to access additional revenue streams and expand their patient base. The right mix of ancillary service lines allow an AMC to expand its footprint, improve clinical offerings, and generate incremental revenue. AMC’s investing in ancillary service lines should consider whether or not to allow the ancillary to use the AMC’s brand name. As outlined below, AMCs typically have a trusted and strong brand name built on a history of excellence. Allowing the ancillary to use the brand can either 1) enhance the volume of ancillary services, 2) dilute the AMC brand name, or 3) a mix of both. Common ancillary services may include ASCs, imaging centers, urgent care, and other retail facilities.
As mentioned above, AMCs often maintain a strong reputation and brand name. This intellectual property reflects valuable consumer trust built on a history of clinical excellence. With the right strategic partner, AMCs can capitalize on their individual brand to become market makers through brand licensing, co-branding agreements, care network subscriptions, or external affiliations.
By building hub and spoke partnerships with community hospitals and medical complexes, academic medical centers can leverage their inherent strengths to maintain their industry reputation for excellence. AMCs that prefer an individualized approach may choose to invest directly in ancillary services or develop branding or affiliation agreements in order to generate additional revenue streams and expand patient access.
By: Madi Whyde, Savanna Ganyard, CFA, Jordan Tussy, and Madison Higgins
VMG Health reviewed the earnings calls of publicly traded healthcare operators that reported earnings for the third quarter that ended on September 30, 2022. By focusing on the major players in select subsectors defined below, we analyzed the frequency of certain keywords including inflation, COVID-19, interest rates, premium labor, and others. We used these keywords to identify which topics commanded the room this earnings season. Highlights from the calls are summarized in this article.
Volume: Although volume trends are unique to each industry sector nearly all operators remained focused on the impacts of COVID.
Poll: Did the earnings call mention COVID-19?
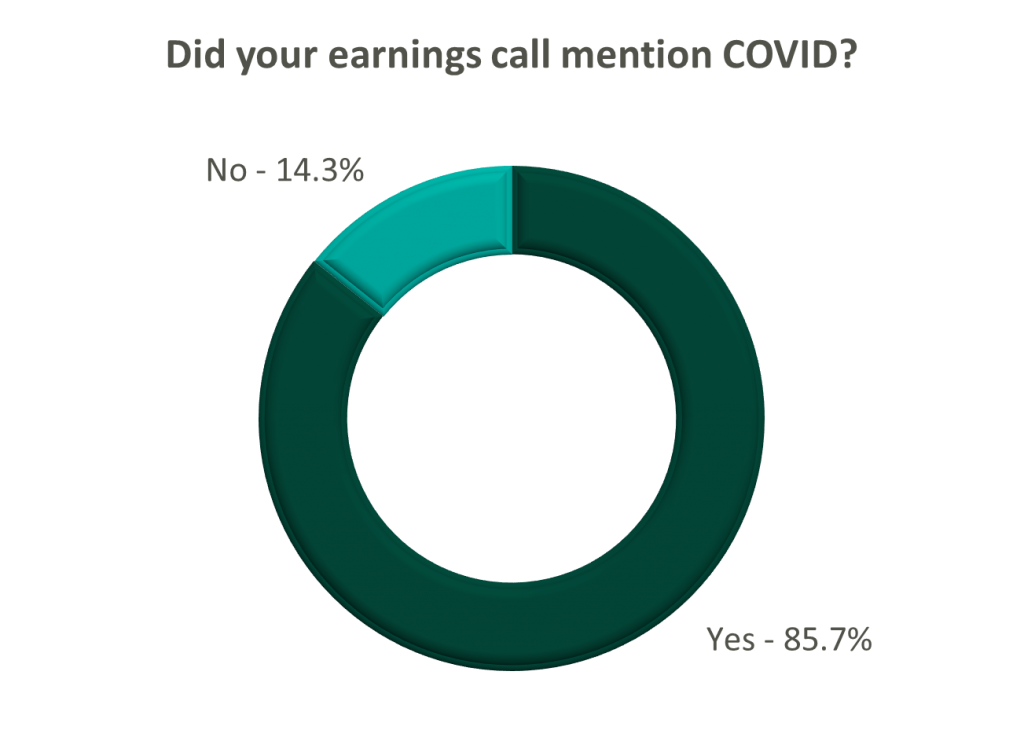
On a same-facility basis, admission volumes declined as much as 5.0% from the comparable prior year quarter (Q3 2021) for acute care hospital operators. Despite the weakening of COVID-19, the decline in volumes was attributed to higher-than-average cancellation rates (THC), the migration of certain procedures to outpatient status (CYH and HCA), and capacity constraints (HCA). Inpatient volumes generally remained at or below pre-pandemic levels.
Ambulatory surgery center (ASC) operators reaped the benefits of the migration to the outpatient setting and reported positive volume trends when compared to Q3 2021. Surgical volumes were reported as consistent with 2019 pre-pandemic levels (THC), and one operator claimed the business did not experience any material direct impact related to COVID-19 during Q3 2022 (SGRY).
The post-acute sector reported mixed results in volume trends. One operator reported a year-over-year decline of 14.0% in hospice admissions, citing capacity constraints and reduced referrals from acute care hospitals (EHAB). However, another operator indicated that increases in admissions in the second half of the third quarter showed growth that they “haven’t experienced since the start of the pandemic” (CHE).
Volume trends among other industry players including dialysis providers, risk-bearing organizations, and physician services were also affected by COVID-19 in Q3 2022. Headwinds in dialysis volumes are expected to persist for the foreseeable future (DVA), and inpatient volumes for risk-bearing organizations remain below pre-pandemic levels (AGL). Notably, AGL also reported a rebound in physician office visits and outpatient volumes were in line with pre-pandemic levels.
Reimbursement: Declining COVID-19 volumes mean less incremental government revenue for certain industry players who also now contend with an uncertain inflationary environment.
Poll: Did the earnings call mention inflation?
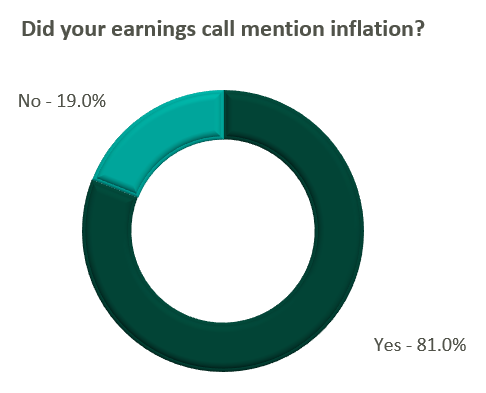
Declining COVID-19 volumes resulted in lower acuity patients and reduced incremental government reimbursement. This softened the reimbursement per admission for the acute care hospital segment. Further exacerbated by inflation, these dynamics were evident in reported EBITDA margins which declined as much as 17.0% (CYH) over Q3 2021. In response, some acute care hospital operators are turning to commercial payor negotiations. Rate increases for the next year are anticipated to range from a minimum of 3.0% (THC) to upwards of 6.0% (CYH).
The post-acute sector did not release specific figures regarding contract rate hikes. However, the sector is optimistically looking for high single-digit rate increases (SEM) to provide relief in the current inflationary environment.
Labor: Unsurprisingly, management teams across the sector were faced with questions about labor trends and management techniques during their earnings calls. Contract labor remained pivotal for the operations of some, but premium labor appears to have softened during the quarter.
Poll: Did the earnings call mention premium or contract labor?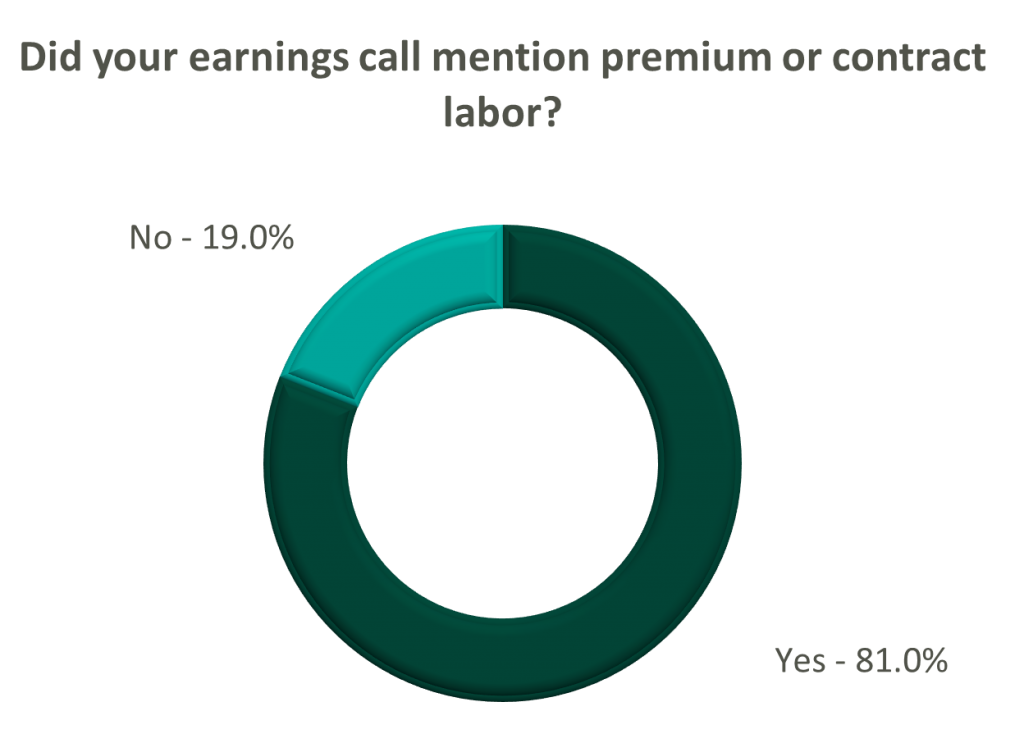
The reliance on contract labor continued its downward trend in Q3 helping moderate expenses. HCA even indicated overall labor costs were stable due to targeted market adjustments. However, contract labor and premium pay remain at uncomfortably high levels for most acute care hospital operators. UHS revealed during their call it will be unlikely to reach pre-pandemic levels in the near future.
Staffing challenges persisted among the post-acute operators and directly impacted volume by as much as 60.0% (AMED). Increased indirect labor costs including orientation, training, and sign-on bonuses were the leading drivers of decreased EBITDA (AMED). Wage inflation, particularly for nursing positions, is expected to rise as much as 5.0% next year (SEM). However, several management teams are optimistic wages will stabilize to historical levels (SEM, EHC) in the near future.
Other industry players, including dialysis and physical therapy providers, also faced challenges with contract labor during the quarter. USPH reported labor costs were approximately 200 basis points higher than Q3 2021 levels, and DVA indicated such costs showed no improvement.
Go Forward Expectations and Guidance: Considering the quarter’s performance, the companies we reviewed were divided relatively evenly in terms of revised FY 2022 revenue guidance, (i.e., raised, lowered, unchanged). In general, the quarter brought about a more pessimistic view of FY 2022 EBITDA, and the majority of public companies lowered their guidance for the year. Further, most stakeholders were left with no guidance for FY 2023.
Poll: Did the earnings call mention a recession?
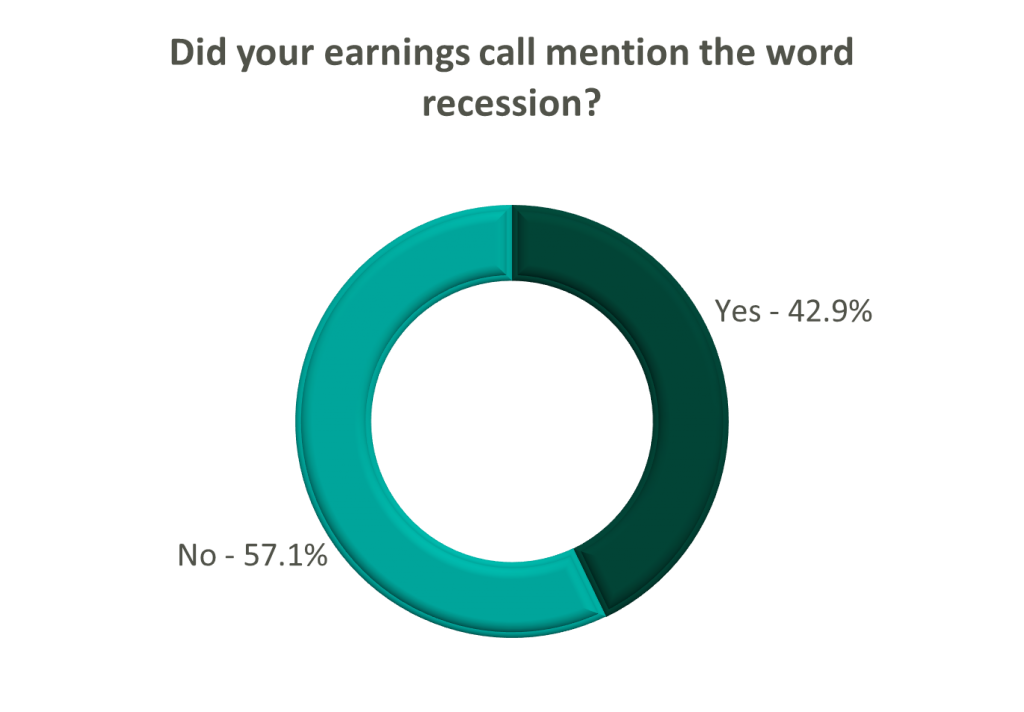
FY 2022 revenue and EBITDA guidance among the acute care hospital operators was generally left unchanged except for THC which lowered EBITDA guidance. However, all companies that were reviewed declined to provide FY 2023 guidance during the call, and primarily cited economic uncertainty (HCA).
The post-acute sector appeared nearly unanimous in the outlook for the rest of 2022, and most operators lowered their revenue and EBITDA guidance. Unsurprisingly, no one offered FY 2023 guidance during the earnings calls.
Interestingly, risk-bearing organizations mostly raised their revenue guidance for FY 2022 (AGL, CMAX, PRVA). However, EBITDA guidance was less predictable and was lowered (AGL, TOI), raised (PRVA), and unchanged (CMAX).
Most other healthcare operators followed similar patterns in terms of providing guidance for FY 2023. Of the companies we reviewed, only DVA revealed an outlook for the next year. The company anticipates revenue to be flat (driven by unfavorable volume trends) and margins to continue to feel the impact of labor market pressures.
Written by Quinn Murray and Ed McGrath
Not-for-profit health systems nationwide are experiencing material financial pressures as the industry recovers from the impact of the COVID-19 pandemic. Now providers are faced with the difficult task of adjusting to the new challenges that healthcare systems are experiencing in 2022. The VMG Health Strategic Advisory Services team works primarily with not-for-profit systems, which is one of the reasons we decided to complete this report and the associated analytics. A consistent theme in this study finds that few organizations have been immune to material declines in financial and operational performance in 2022. This performance is not sustainable for the long term.
In addition to the costs associated with labor, supply, purchased services, and other inflation pressures, not-for-profit healthcare systems are also experiencing increased competitive threats. These threats are coming from niche players supported by private equity and other financially backed organizations that are typically focused on more profitable commercial business instead of serving all, which is the historical tradition of not-for-profit healthcare systems.
This report is based on data from publicly available sources and represents a statistical sample size of various organizations across the nation, but with that said, our findings may not be applicable in all markets. However, the organizations reviewed for this report represent a large cross-section of not-for-profit health systems in the country. The composition of these systems is summarized below.

On a combined basis, the 21 systems analyzed as part of this study represent $184 billion in total operating revenue for fiscal year 2021. A significant portion of this total was generated from the systems operating 560+ hospitals with approximately 100,000 beds across 32 states.
Other advisory firms have also noted recent declines in industry performance. The contributing factors identified by other firms are wide-ranging, some of which are consistent with the findings of this report.
For example, KaufmanHall reported in September 2022 that for the first six months of CY 2022, hospital operating margins declined 100% compared to 2019 before the pandemic. In addition, KaufmanHall noted the number of hospitals with negative margins in 2022 is projected to be greater than pre-pandemic levels since hospital margins continue to be consistent with, or worse than, 2020 levels.
Another example from RevCycleIntelligence from July 2022 cited survey results from over 200 CFOs of health systems and large physician groups. The results indicated that only 8% reported they were on track to exceed 2022 goals. Additionally, RevCycleIntelligence noted hospitals and health systems are experiencing increases in volumes and patient revenues. Research completed for this report is consistent with the findings noted in the RevCycleIntelligence article.
As noted, the factors driving poor financial performance in 2022 are wide-ranging. Discussions with management for purposes of this report have indicated that some of the issues include the following:
The findings and forecast based on this report do not necessarily paint a pretty picture for not-for-profit systems. While our research is focused on healthcare systems, VMG Health’s experience with standalone hospitals in 2022 also indicates, in most cases, financial performance is weaker than what is being reported for several other systems.
Of the 21 systems analyzed for this report, in calendar year 2022, 16 are reporting negative operating margins (75+%). The other five are reporting breakeven or very minimal operating margins. Each of these systems reported positive FY 2019 operating margins before the pandemic.
The range of the operating margin declines in 2022 as compared to 2021 and/or pre-pandemic levels approximates from 4.0% to 7.0%. In other words, if the operating margin was a positive 2.0% in 2021, then the 2022 operating margins will likely approximate between -2.0% to -5.0%. Likewise, operating EBIDA for these systems has deteriorated materially to approximately 3.5% of total operating revenue in comparison to 8.0% in 2021 before the pandemic.

Similarly, these systems have experienced a significant decline in days cash, specifically in 2022, approximating -18% from 2021. The systems have also experienced material losses from investment income in 2022. Recognizing this mostly includes unrealized losses, these systems reported investment losses of approximately negative -$22 billion on a combined basis.
Negative operating margins in addition to poor investment performance (and other non-operating activity for certain organizations) are driving declining cash balances. 2022 performance indicates systems reporting somewhat material declines in days cash on hand. These 21 systems are reporting a 15% to 25% decline in days cash with an average of an 18% decline from fiscal year-end 2021.
As an additional consequence of the material losses, especially for smaller systems, debt service coverage ratio (DSCR) covenants may not be met. Most of the systems included in this report have the cash reserves necessary to avoid procedural requirements relative to the days cash covenant in their bond agreements, and this includes taking into account the poor 2022 performance.
Organizations in 2023 may be required to develop a financial improvement plan outlining the recovery path to fulfilling the DSCR covenant in a subsequent fiscal year. In many cases when a bond covenant such as DSCR is not met, systems are required to hire management consultants to report on their opinion relative to the likelihood the system can meet the DSCR threshold in the near term.
VMG Health recently completed one of these assignments for a large hospital in the northeast. Based on this assignment and discussions with others, based on 2022 performance it appears other organizations will unfortunately need this type of study completed by experts such as VMG Health.
It is clear most organizations will not be able to shrink their way to success, and over time, strategic growth is imperative to long-term success. The following are example actions either undertaken or being contemplated by VMG Health clients to address recent performance:
Not-for-profit healthcare systems are experiencing extreme challenges in 2022. Based on conversations with many of these organizations and other clients, this is unlikely to improve materially in 2023. Not-for-profit hospitals and systems need to explore other innovative avenues to work smarter and more efficiently so they can be well-positioned for success in the future. VMG Health has a history of experience developing long-term relationships with clients through providing assistance across a variety of areas. These areas primarily consist of financial and strategic related assistance, which has prepared and positioned VMG Health to provide support and insight to not-for-profit hospitals and health systems. As we continue to assess the not-for-profit landscape, VMG Health has the experience to add value and help systems address some of the issues outlined in this report.
The assistance VMG Health’s experts are able to provide can take many forms. Some examples are:
While the valuation of a public company is dependent on macroeconomic, industry, and company-specific factors, VMG Health has attempted to isolate key drivers of the recent market pullback of public healthcare operators. Specifically, VMG Health has isolated two variables:
VMG Health reviewed the change in enterprise value, EBITDA, and the implied forward multiple, as defined below, of 17 publicly traded healthcare operators from December 31, 2021, to June 10, 2022. We then quantified the impact on enterprise value for each of the identified companies in Exhibit A resulting from fluctuations in EBITDA as compared to the implied forward multiple over the observed period.
Based on a review of 17 publicly traded healthcare operators, aggregate total enterprise value declined by approximately $46.1 billion, or 15.0%, from December 31, 2021, to June 10, 2022. While 10 of the 17 companies now have lower consensus EBITDA estimates, this appears to account for only 10.9% of the enterprise value decline. The overwhelming reduction in the total enterprise value is due to multiple contraction with 13 of the 17 companies currently trading at a lower implied multiple.
Furthermore, 14 of the 17 public operators experienced a decline in enterprise value over the last six months, whereas Acadia Healthcare Company, Inc., LHC Group, Inc., and U.S. Physical Therapy, Inc. were the only three companies that saw an enterprise value increase over the same period [2]. Unsurprisingly, these companies also did not experience multiple contraction.
The two publicly traded diagnostic laboratory businesses, Laboratory Corporation of America Holdings and Quest Diagnostics Incorporated, experienced the most significant enterprise value decline because of multiple contraction. On average, the implied forward EBITDA multiples decreased by approximately 4.0 turns of EBITDA, from around a 13.0x to approximately a 9.0x.

Select Medical Holdings Corporation (“Select”) saw the most significant enterprise value decline due to a decrease in consensus EBITDA estimates. Select’s EBITDA has declined by almost $150.0 million over the last 6 months, which has resulted in a 15.6%, or $1.2 billion, reduction in enterprise value. Overall, the trading multiples for public operators within the post-acute care sector have remained relatively flat, but consensus EBITDA estimates have declined by approximately 6.7% with an approximately $2.6 billion impact on enterprise value.

Among the publicly traded acute-care hospital operators, HCA Healthcare, Inc. experienced the most significant dollar reduction in enterprise value, decreasing $19.6 billion, or 17.0%, from $115.3 billion to $95.8 billion. Of this change, approximately 62.6% was due to multiple contraction and 37.4% was due to consensus EBITDA decline. Collectively, enterprise value for the acute care hospital sector decreased by approximately 14.2%, or $24.0 billion, driven primarily by a contraction in trading multiples of nearly 1.0 turn of EBITDA.

Of the other publicly traded healthcare operators observed, Surgery Partners Inc. experienced the most significant impact on enterprise value, on a percentage basis, due to the contraction in implied multiple. The company’s multiple declined by almost 5.0 turns of EBITDA from December 31, 2021, to June 10, 2022, resulting in a $1.9 billion, or 21.8%, reduction in enterprise value. Overall, declines in consensus EBITDA estimates did not have as significant of an impact on enterprise value as implied multiple contraction for the other companies with two of the five operators experiencing growth in their consensus EBITDA estimates over the observed period.

The equity markets continue to react to macroeconomic factors, such as interest rate fluctuations, as well as industry-specific information, including rising labor costs. While many of the public companies currently have lower consensus EBITDA estimates for FY 2022, the market seems to have also pulled back on valuations, as evidenced by the decline in the implied forward multiples. It is yet to be determined if this reduction is short-term in nature, and VMG Health will continue to monitor the public markets.
[1] VMG Health relied on S&P Capital IQ for the FY 2022 consensus EBITDA estimates as of December 31, 2021, and June 17, 2022. The consensus EBITDA as of December 31 is primarily based on analyst estimates following companies’ Q3 2021 earnings calls through December 2021. Similarly, the consensus EBITDA as of June 17 is largely comprised of analyst estimates following the Q1 2022 earnings calls through June 2022.
[2] While VMG Health’s analysis focuses on the effect of two variables on enterprise value, we understand there are additional factors impacting public company valuations. For example, following the March 29, 2022 announcement of UnitedHealth’s plan to acquire LHC Group, LHC’s price and forward multiple increased and have remained elevated based on the market expectations of this transaction.

As we enter 2022, we look back to reflect on the major trends that shaped the healthcare sector over the past year. COVID-19 continued to be a major player throughout 2021, forcing healthcare systems to adapt to new variants, rising labor pressures, financial activity, and new regulations. Despite these challenges, the sector remains optimistic and ready to adapt.
Here are five key takeaways we believe defined the healthcare sector over the past year:
After the Q2 earnings season, VMG Health released an article analyzing post-COVID healthcare operator guidance. Generally, we found that healthcare operators were optimistic about the recovery of their revenue and adjusted EBITDA metrics over pre-pandemic levels, with most operators increasing their FY 2021 guidance with each subsequent reporting period.
While optimism for recovery to pre-pandemic levels remains, it appears that the post-acute operators have tempered some of their recent growth expectations. Based on disclosures of the public operators, the recent resurgence of COVID-19 through the Omicron variant has caused additional strain on the post-acute sector. During the J.P. Morgan Healthcare Conference, Universal Health Services (“UHS”) CFO, Steve Filton noted that the company was struggling to find providers who can accept COVID patients once they are ready to be discharged from the hospital.
Post-acute providers appear to have been hit especially hard by the recent labor shortages in the healthcare industry (discussed further below). As compared to the hospital operators, the financial performance of these post-acute providers has been affected disproportionally by the labor shortages. While hospital operators have been receiving additional reimbursement for COVID patients, helping to offset a portion of the increased staffing costs, the post-acute care providers have not received a similar subsidy.
Due to these recent pressures, Select Medical Holdings Corporation (“SEM”) released an expected earnings announcement in advance of the actual results, in which it noted “the unpredictable effects of the COVID-19 pandemic, including the duration and extent of disruption on Select Medical’s operations and increases to our labor costs, creates uncertainties about Select Medical’s future operating results and financial condition.”
While we have seen increasing optimism by healthcare providers over the past few quarters, the recent disclosures from the post-acute sector illustrate that the effects of COVID continue to ripple through the healthcare sector. With the fourth quarter results being released over the coming weeks (HCA and Encompass recently released), it will be interesting to hear if other sectors report similar headwinds.
Healthcare labor expenses continued to exceed historical levels with a 12.6% year-over-year increase based on a recent analysis of over 900 hospitals. Labor expenses grew at a faster rate than the number of clinical hours worked, which supports the notion that rising labor costs were not due to increased staffing levels but rather due to labor shortages driving higher pay to improve employee retention. Part of the labor shortage can be credited to the surge of Delta and Omicron variants in the second half of 2021 that resulted in high volumes of quarantined staff and a reliance on costly contract labor and travel nurses. At the Bank of America December 2021 Home Care Conference, LHC Group announced a decrease in quarantined staff throughout Q4 from a high of 4% down to 1% in December. This indicates that the labor market issues will see some improvement as health systems’ dependence on pandemic-related contract labor declines as COVID-19 surges dissipate going into 2022.
A more concerning challenge faced by all sectors was the shrinking workforce, coined the “Great Resignation.” The Bureau of Labor Statistics reported healthcare and social assistance workers had the second highest quit rate in November 2021 at 6.4% due to increasingly high levels of professional burnout. The waning labor force has prompted companies to offer additional incentives such as shift and retention bonuses. For example, HCA reported during Q3 a 10-12% annual increase in FTEs being in the premium pay categories. Many large public players have voiced an anticipation of continued high levels of premium pay, competitive bases, and higher annual wage inflation to attract and maintain adequate staffing levels in 2022.
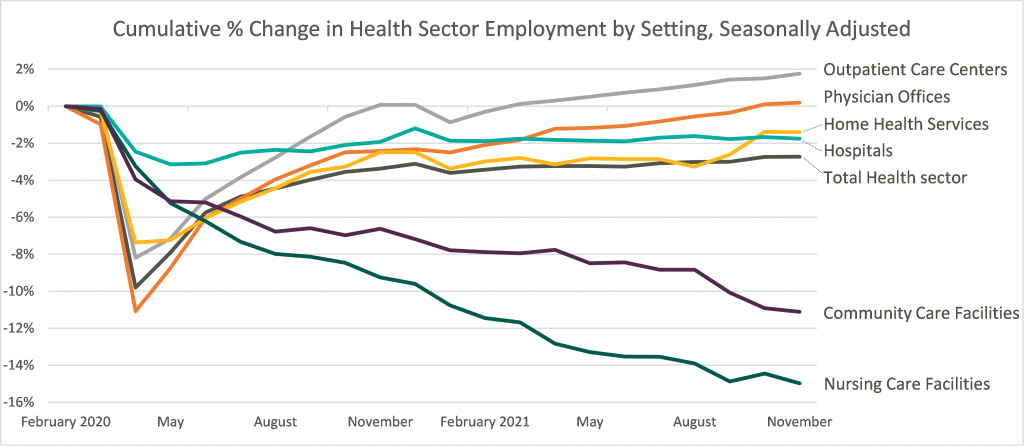
Leaders in the industry have announced initiatives to decrease labor pressure primarily by focusing on recruiting and retention to bounce back to pre-pandemic levels of employment. With a heightened focus on attracting and maintaining adequate levels of hired staff as opposed to contract labor, it appears the overall industry expectation for 2022 is that labor costs will likely decrease compared to 2021 although not to pre-pandemic levels. The chart below shows the percentage change in employment across the healthcare sector from the Bureau of Labor Statistics Job Openings & Labor Turnover Survey from February 2020 to November 2021. This highlights the steady recovery toward pre-pandemic staffing levels for outpatient care and physician offices, the continued employment challenges in home health and hospital settings, and the notable struggle for community and nursing care facilities to return to a state of normalcy.
Deal activity within the healthcare sector was strong in 2021 with industry-specific multiples that reached or in many cases exceeded 2019 levels. Experiencing a noticeable rebound from 2020, volume and value of deals grew by substantial margins on a year-over-year basis. Deal volume in the health services industry rose by 56% while value rose 227% in the TTM 11/15/21 period. Long-term care led all sectors with the highest volume of deals, as seen historically, and continues to remain a hot spot in the transaction space. Similarly, physician medical groups and the rehabilitation sector experienced the largest growth transaction volumes year-over-year.
Physician medical groups have received vast interest in physician employment from private equity firms, new-age value-based care organizations, services arms of managed care giants (Optum, Neue Health), and health systems. This, coupled with independent physician group operating challenges from COVID-19 related volume impact and looming Centers for Medicare and Medicaid Services (CMS) cuts, is creating a robust transaction environment that is expected to continue during 2022. For the rehabilitation sector, strong demographic tailwind, along with the lifted CON moratorium in Florida and continued joint venture interest between health systems and strong rehabilitation operators (Select, Kindred, Encompass), has resulted in material deal volume in the space.
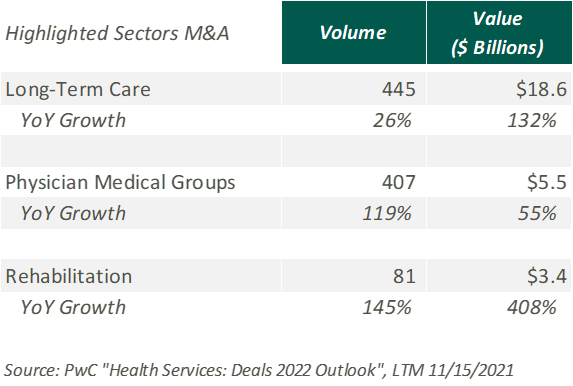
Hospitals and health systems were the only sector to see a decline in volume of deals, down 26% from the previous year. Despite the decline, the total transaction size of deals only dropped slightly year over year, indicating larger deal-size on a per-transaction basis. The acceleration of megadeals taking place, the shifted focus on scale, and the diversification of their business models all drove average total size per deal higher than seen before in 2021.
Effective January 1, 2021, the Centers for Medicare and Medicaid Services (CMS) implemented a price transparency rule requiring hospitals in the United States to provide accessible pricing information to patients about the cost of the care they may receive. Hospitals must display negotiated rates for all items and services, in a machine-readable format, so that patients can compare prices before arriving at the hospital.
Though, in July 2021, a study was published by PatientsRightsAdvocate.org detailing that a vast majority of hospitals were not compliant with the new rule. At the release of the study, the penalty for non-compliant hospitals was $300 per hospital, per day. While many patients advocate for CMS to stiffen penalties for non-compliant hospitals, healthcare professionals argue against the rule, stating CMS did not provide enough clarity on what the rule should entail.
A vice president of a large U.S. health system discussed the ambiguities around the rule with Fierce Healthcare. “One interpretation is you simply publish your rate schedule – whatever your rate exhibits are in your contracts, publish that and that’s compliant. Another one is to summarize these [CMS] packages [and] what your negotiated charges are.” For many health systems, the resources required to implement their rates in a machine-readable format far outweigh the penalty of remaining non-compliant. The VP stated that he believes many hospitals already provide their rates in a clear, understandable way, but the rule’s lack of clarity and the requirement for a machine-readable format make compliance difficult and costly.
In November 2021, CMS released the 2022 Outpatient Prospective Payment System (OPPS)/Ambulatory Surgery Center (ASC) Payment System final rule (OPPS Final Rule). Within this rule, CMS increased penalties for hospitals that are not compliant with the price transparency rules and removed barriers for patients accessing online pricing information.

While the Final Rule may be beneficial for patients, Stacey Hughes, Executive Vice President for the American Hospital Association (AHA), states that they “are very concerned about the significant increase in penalties for non-compliance with the hospital price transparency rule, particularly in light of the many demands place on hospitals over the past 18 months, including both responding to COVID-19, as well as preparing to implement additional, overlapping price transparency policies.”
The new penalties, visible in the chart above, went into effect on January 1, 2022.
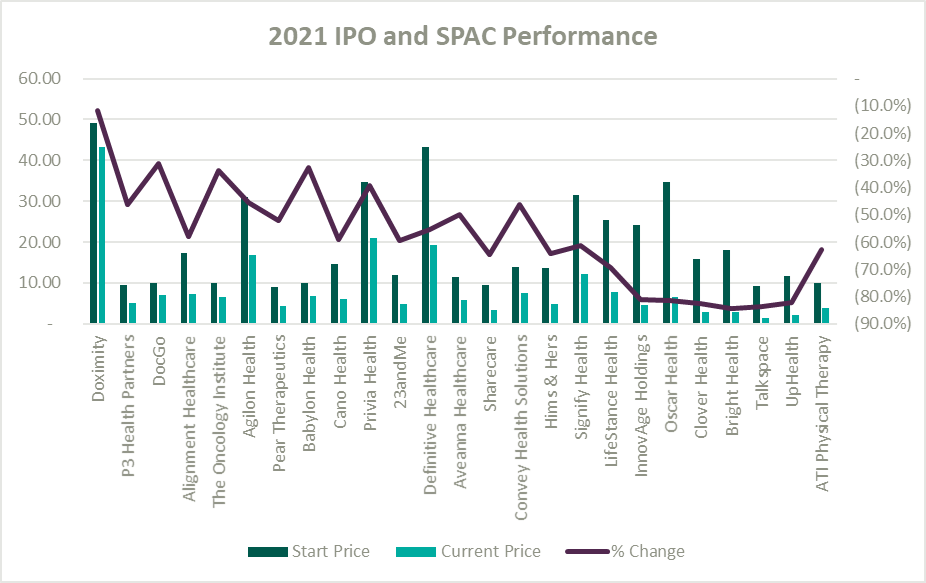
A record number of health and health services companies went public during 2021 by way of SPAC or IPO. Rebecca Springer, a private equity analyst with PitchBook noted, “The multiples in public markets are very, very strong right now, so you can get, all else equal, a better return on your investment if you go public with your company rather than selling it to a strategic investor.”
Unfortunately, while the stock market might be performing well, the recently public healthcare operators have not faired as well since their initial offerings. The Healthy Muse Health Tech Index (“HTI”) generally underperformed the overall performance of the stock market, with the majority of the players finishing in red; the HTI declined 35% as opposed to the 27% gain for the S&P 500 during 2021. The public markets seemed like a perfect place for an exit strategy given the multiples observed in the public markets. All recent entrants finished the year below the original IPO price and while the reasons for the price declines varied it is clear the public markets are less forgiving with valuations if an organization does not achieve expectations.
Overall, the healthcare sector experienced highs and lows during 2021 as it continued to navigate a post-COVID world. As pandemic pressures continue into 2022, healthcare institutions will have to keep a close eye on staffing costs and abide by new regulations. Despite these challenges, the appetite for M&A transactions and market participation in the sector remains strong. We look forward to a new year of challenges, wins, and continued changes in this interesting industry.
https://www.cms.gov/medicare/covid-19/new-covid-19-treatments-add-payment-nctap
https://www.pwc.com/us/en/industries/health-industries/library/health-services-deals-insights.html
https://www.policymed.com/2021/12/cms-announces-increased-fines-for-transparency-violations.html
Contributors: Blake Madden, Chris Madden, Alex Malin, Eric Noyer, and Olivia Wilson
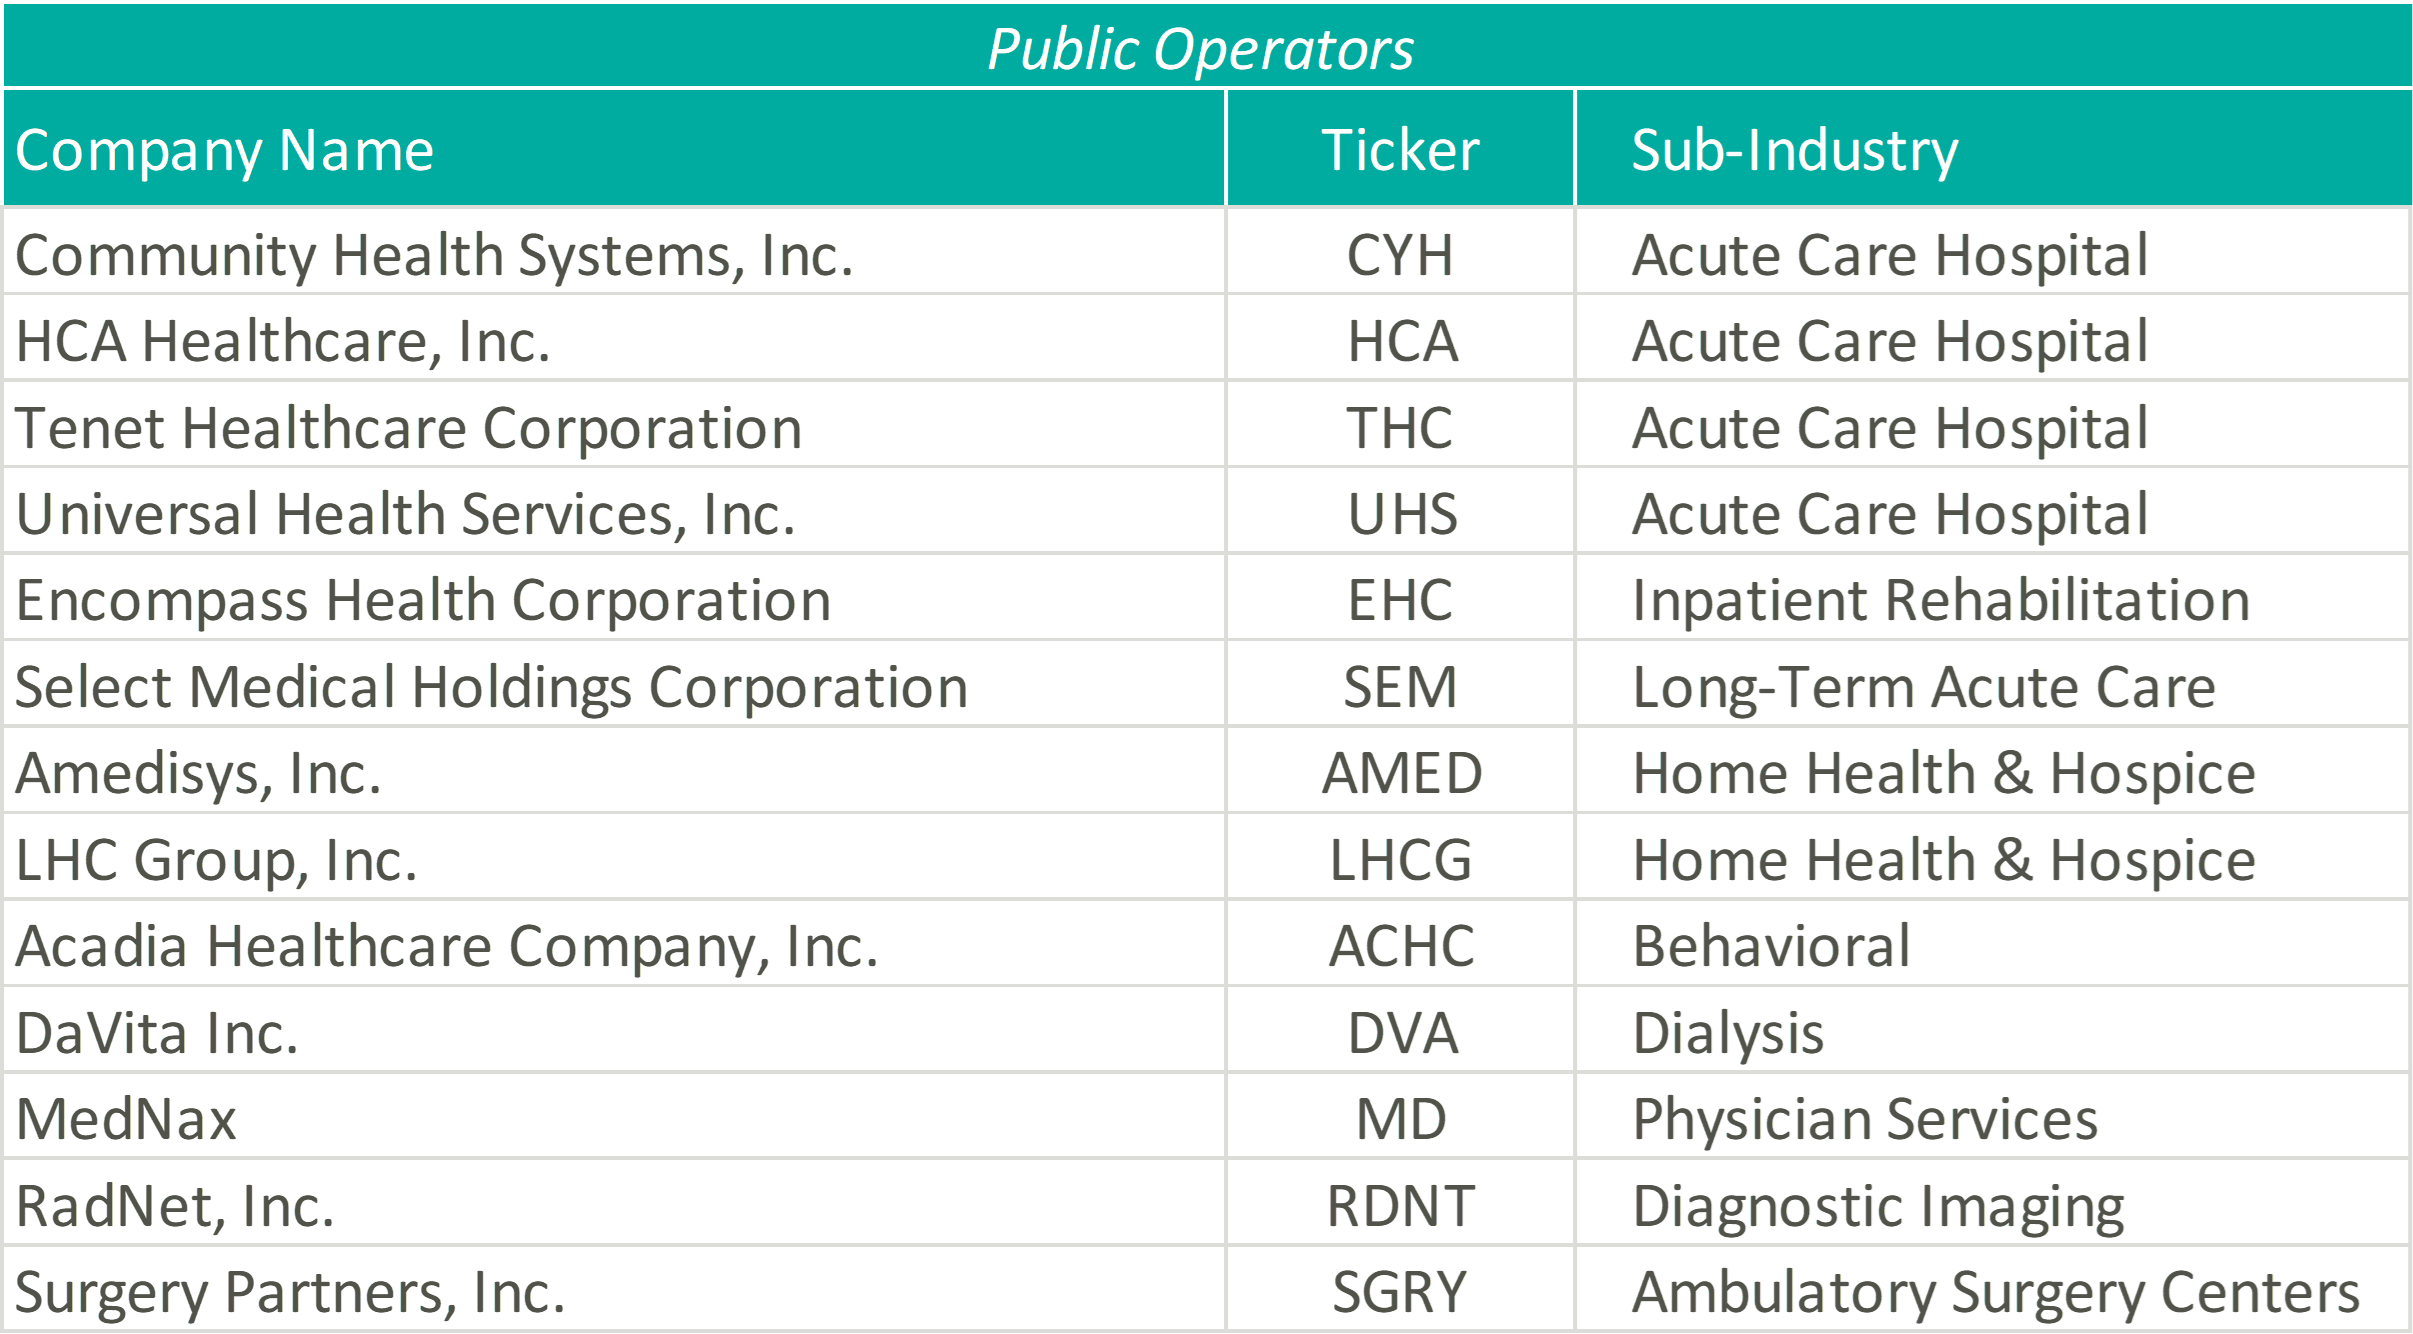
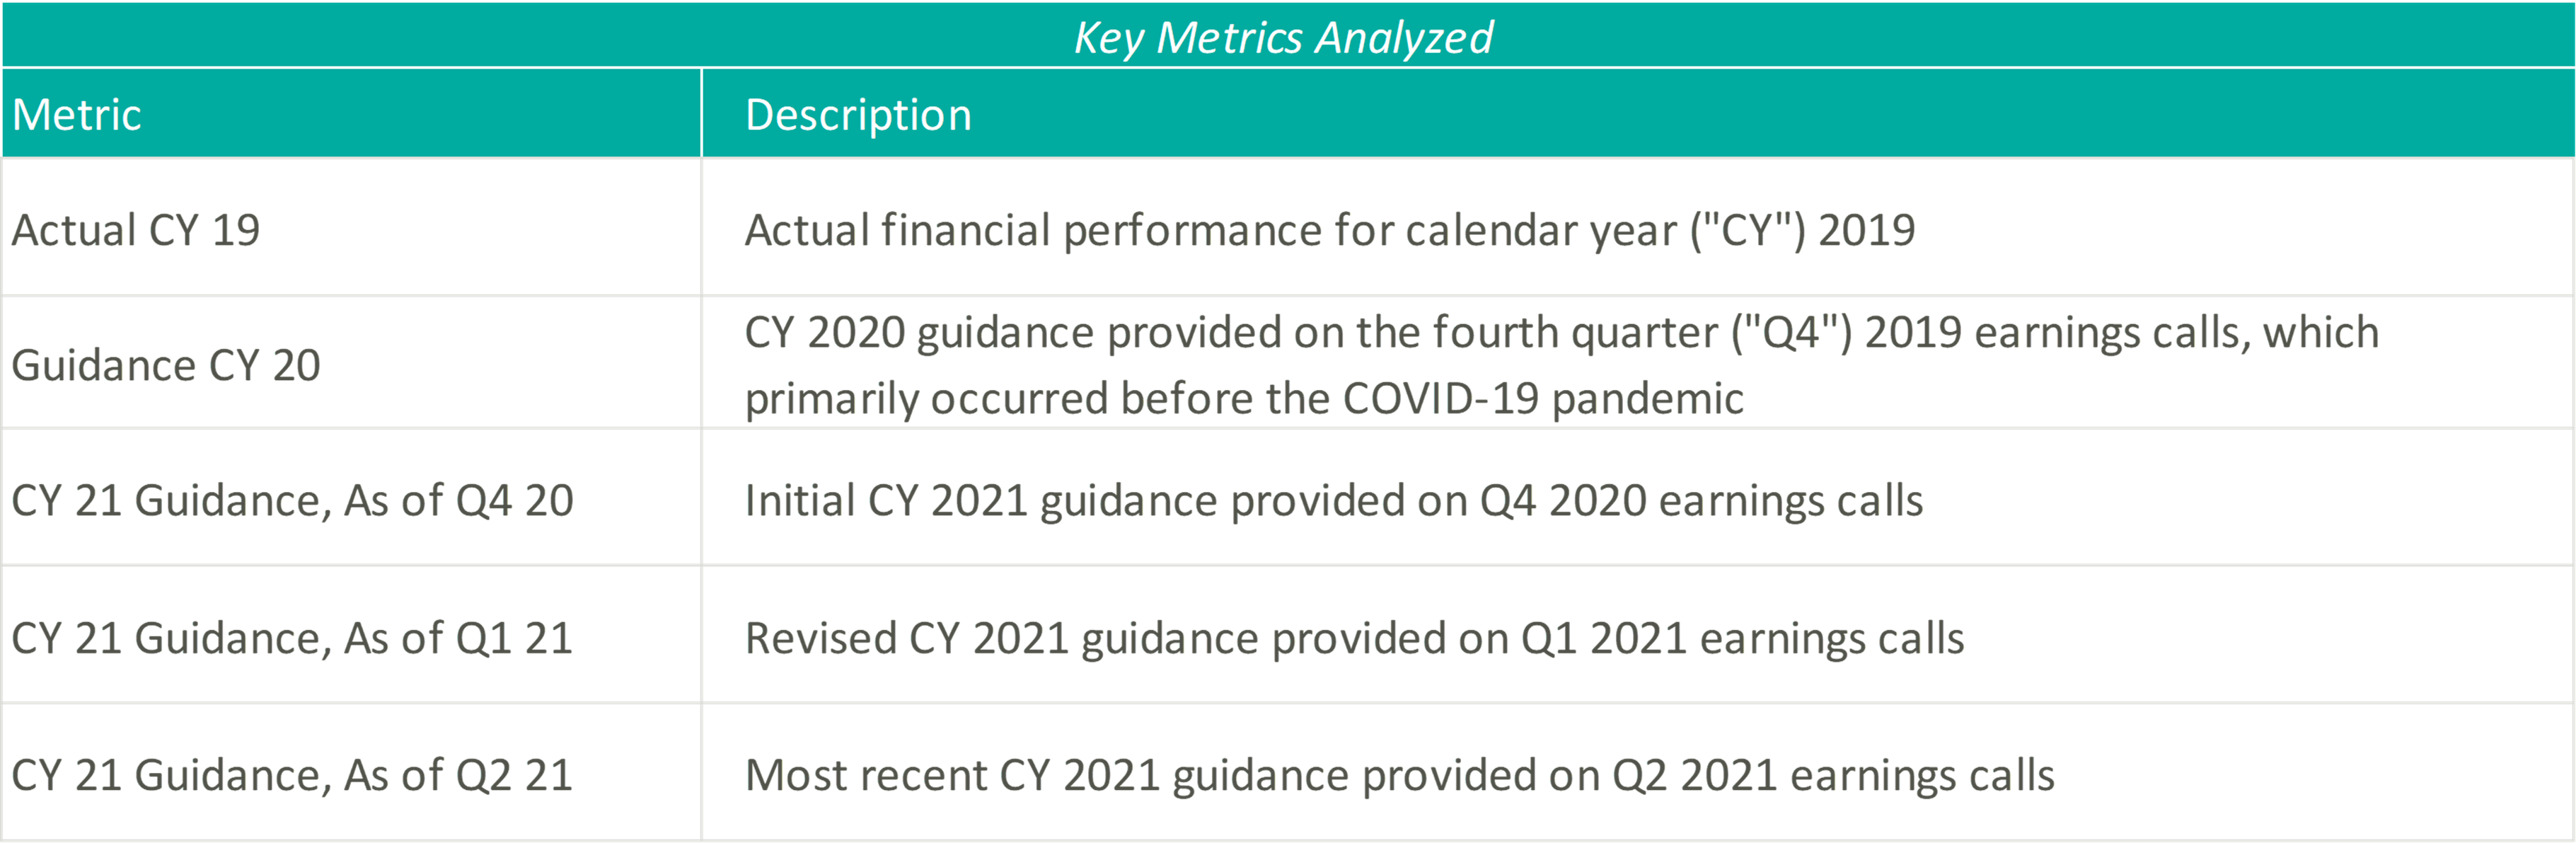
In March 2020, the coronavirus (“COVID-19”) pandemic began reshaping the world economy. At the time, many factors about the disease were unknown and impossible to predict. Some of these factors include the evolution of the disease, timeline to produce a vaccine, and the economic effects of worldwide lockdowns. The healthcare industry was uniquely affected, and many healthcare operators felt that they were not in the position to forecast future financial performance. After a year of operations in a COVID-19 impacted world, operators resumed the disclosure of earnings guidance. VMG analyzed guidance figure trends from publicly traded acute care hospitals, post-acute providers, home health and hospice companies, and a variety of other operators to better understand how the industry is recovering and evolving as the pandemic continues.
Please see below for a list of the companies examined, as well as further detail regarding the various metrics considered.
The pandemic’s grip on acute care moderated through Q2 2021 resulting in significant revenue increases for the public hospital operators. Management, often with a tone of surprise, cited strong demand for services as the primary driver of the revenue upticks and reports of double-digit volume growth frequented earnings call highlights.
Samuel N. Hazen, CEO of HCA noted, “On a year-over-year basis, revenues grew 30.0% to $14.4 billion… To highlight a few areas, outpatient surgeries were up 53.0%, emergency room visits grew 40.0%, cardiology procedures increased 41.0%, and urgent care visits were up 82.0%.”
Similarly, Tim L. Hingtgen, CEO and Director of CYH revealed, “For the second quarter, on a same-store basis, net revenue increased 30.2% year-over-year… For the full quarter, year-over-year, same-store admissions increased 17.0%, while adjusted admissions were up 28.5%. Surgeries increased 43.7% and ER visits were up 39.2%.”
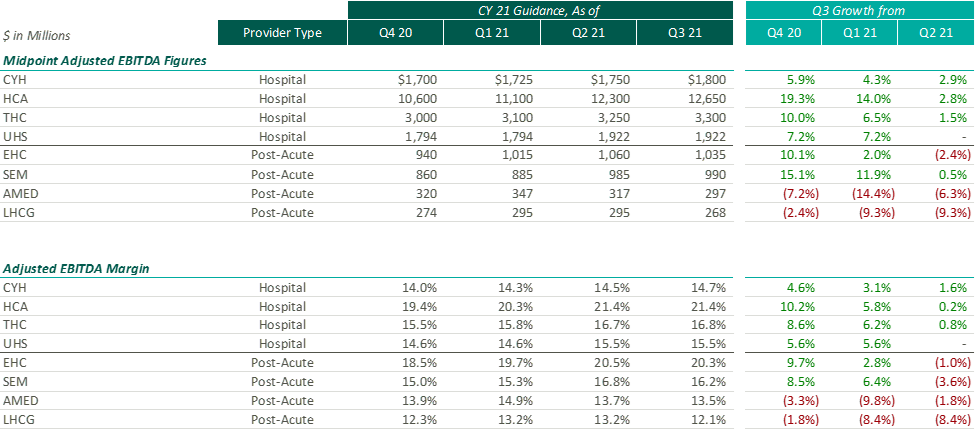
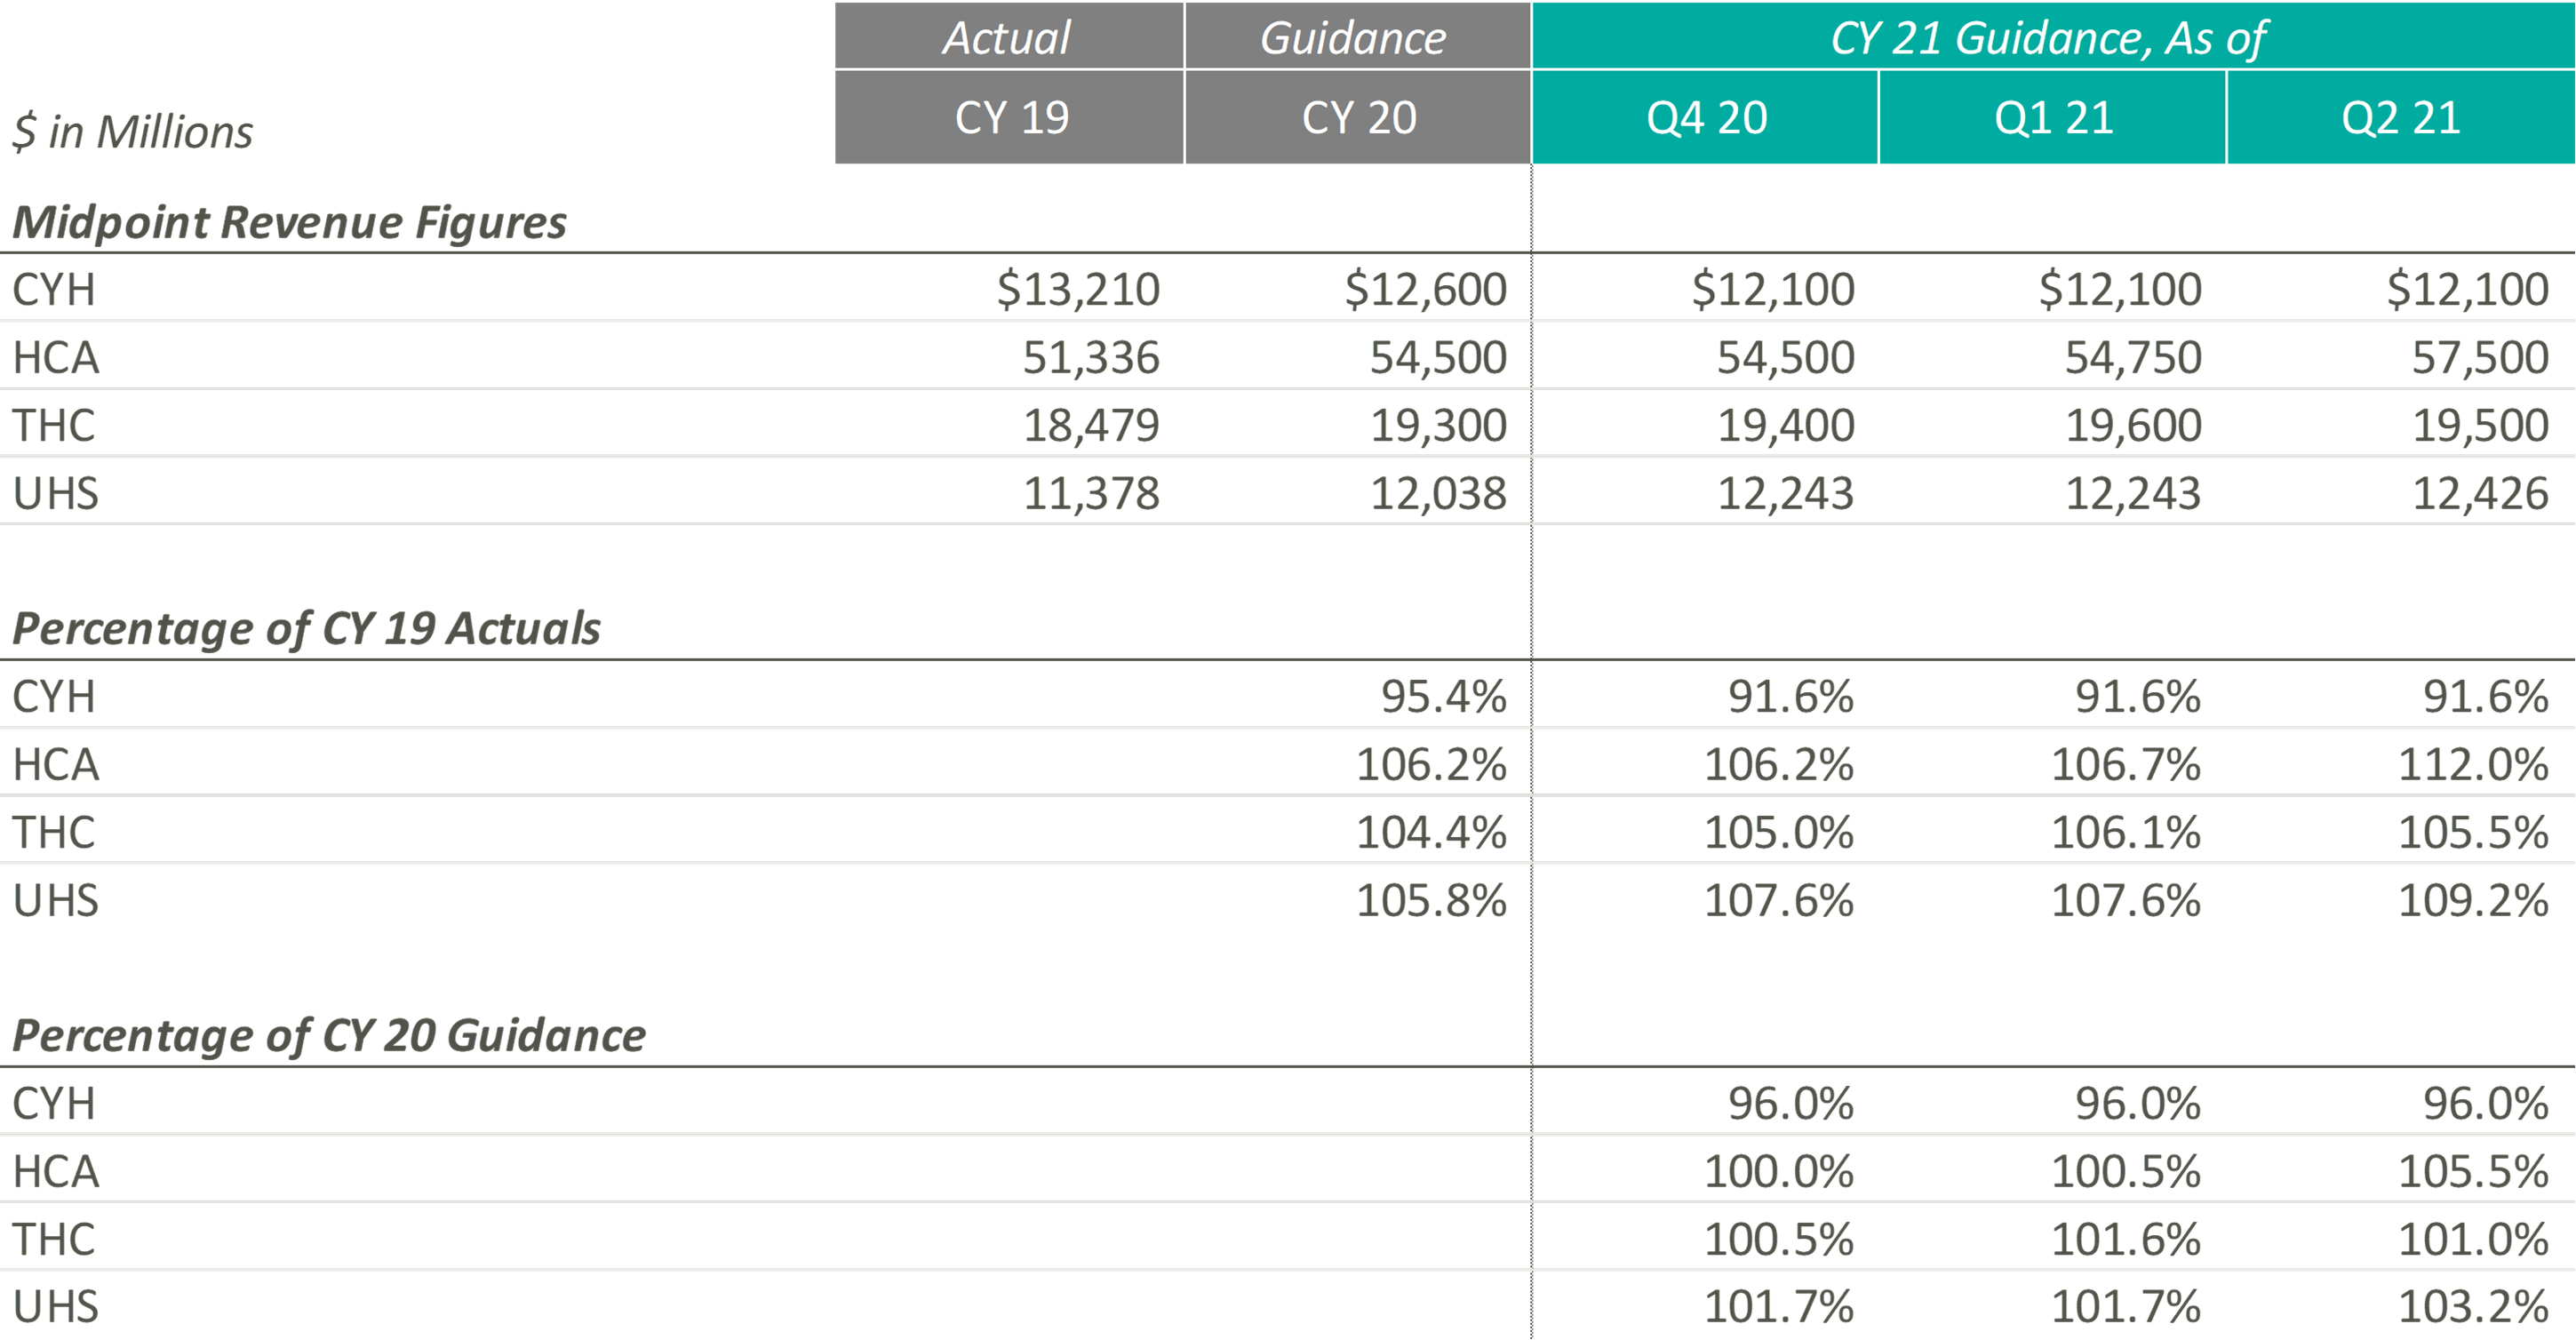
As a result of the performance of Q2 2021, public hospital operators further increased their guidance for CY 2021. Still, 2021 revenue guidance remains relatively in-line with pre-COVID 2020 estimates indicating revenue stagnated in 2020. The outlier, CYH, completed a planned divestiture program at the end of 2020, making it difficult to compare post-COVID revenue guidance to the pre-COVID figures.

In terms of profitability, HCA and THC were the earliest Acute Care Hospital operators to predict CY 2021 adjusted EBITDA to exceed the figures estimated at the beginning of CY 2020 and CY 2019, which they publicly estimated as early as Q4 2020. In light of the positive results reported during Q2 2021, CYH and UHS joined their peers in predicting favorable improvements in profitability. As of Q2 2021, the public hospital operators were unanimous in their guidance for the full year in terms of exceeding pre-COVID CY 2020 adjusted EBITDA.
Steve G. Filton, CFO and Secretary of UHS noted, “This robust recovery in volumes exceeded the pace of our original forecast and drove the favorable operating results even in the face of continuing labor pressures in both of our business segments.”
On a margin basis, all Acute Care Hospital operators have estimated CY 2021 adjusted EBITDA margins to exceed CY 2019 and 2020 levels. The pandemic has forced Acute Care Hospitals to take a closer look at their expense structures and streamline operations, leading to the predicted EBITDA margin growth.
The management teams have all reacted positively to a successful first half of 2021, as all four operators expect CY 2021 revenue and adjusted EBITDA levels near or above their initial CY 2021 estimates. However, although the guidance figures seem positive, CY 2021 levels are only at or slightly above pre-COVID CY 2020 expectations, proving that these operators are remaining cautious when providing forward-looking estimates. The Acute Care Hospital industry, while showing signs of recovery after the initial peak of the pandemic, is still experiencing the effects of the COVID crisis, and the recent rise of the Delta variant could further exacerbate the impacts that the COVID-19 pandemic had on the Acute Care Hospital providers.
During UHS’ Q2 2021 earnings call, Steve G. Filton, CFO and Secretary of UHS, cautioned, “During the past 4 to 6 weeks, many of our hospitals have experienced significant surges in the number of COVID patients, and it is not evident that this surge has yet reached its peak. Given the uncertain impact of this most recent surge on non-COVID volumes and on labor shortages, we based our guidance for the second half of the year, primarily on our original internal forecast.”

In CY 2021, Post-Acute Care operators expect growth above both CY 2019 revenues and expected pre-COVID CY 2020 revenues. Most notably, when these operators released their original CY 2020 guidance, they projected mid-single digit growth. Looking at their CY 2021 guidance as a percentage of CY 2019 levels and as a percentage of CY 2020, it appears that they expect to still achieve mid-single digit growth on a compounded annual basis from CY 2019. These data points suggest that the Post-Acute Care operators’ growth trajectory was likely not hindered or set back a year by the COVID-19 pandemic.
Additionally, both Post-Acute Care operators have continued to raise their CY 2021 guidance over the past two quarters. During EHC’s most recent earnings call, management highlighted that the return of elective procedures has been fueling inpatient rehabilitation facility (“IRF”) discharge growth. In addition, EHC is experiencing growth in IRF revenue per discharge due to strong reimbursement rates, continued suspension of sequestration, improved discharge destination, and cost report adjustments. These tailwinds, along with the improvement of home health and hospice volumes and IRF M&A activities, resulted in the continued increase of revenue guidance for EHC.
Similarly, SEM has experienced a rebound in volumes in all four segments (i.e., IRFs, long-term acute care hospitals (“LTACHs”), occupational health, and outpatient rehabilitation) at levels well above pre-pandemic levels, resulting in the continued increase in CY 2021 guidance figures. As stated in SEM’s Q1 2021 earnings press release, “In March 2021, both Select Medical’s outpatient rehabilitation clinics and Concentra centers experienced patient visit volume approximating the levels experienced in January and February 2020, the months preceding the widespread emergence of COVID-19 in the United States.”
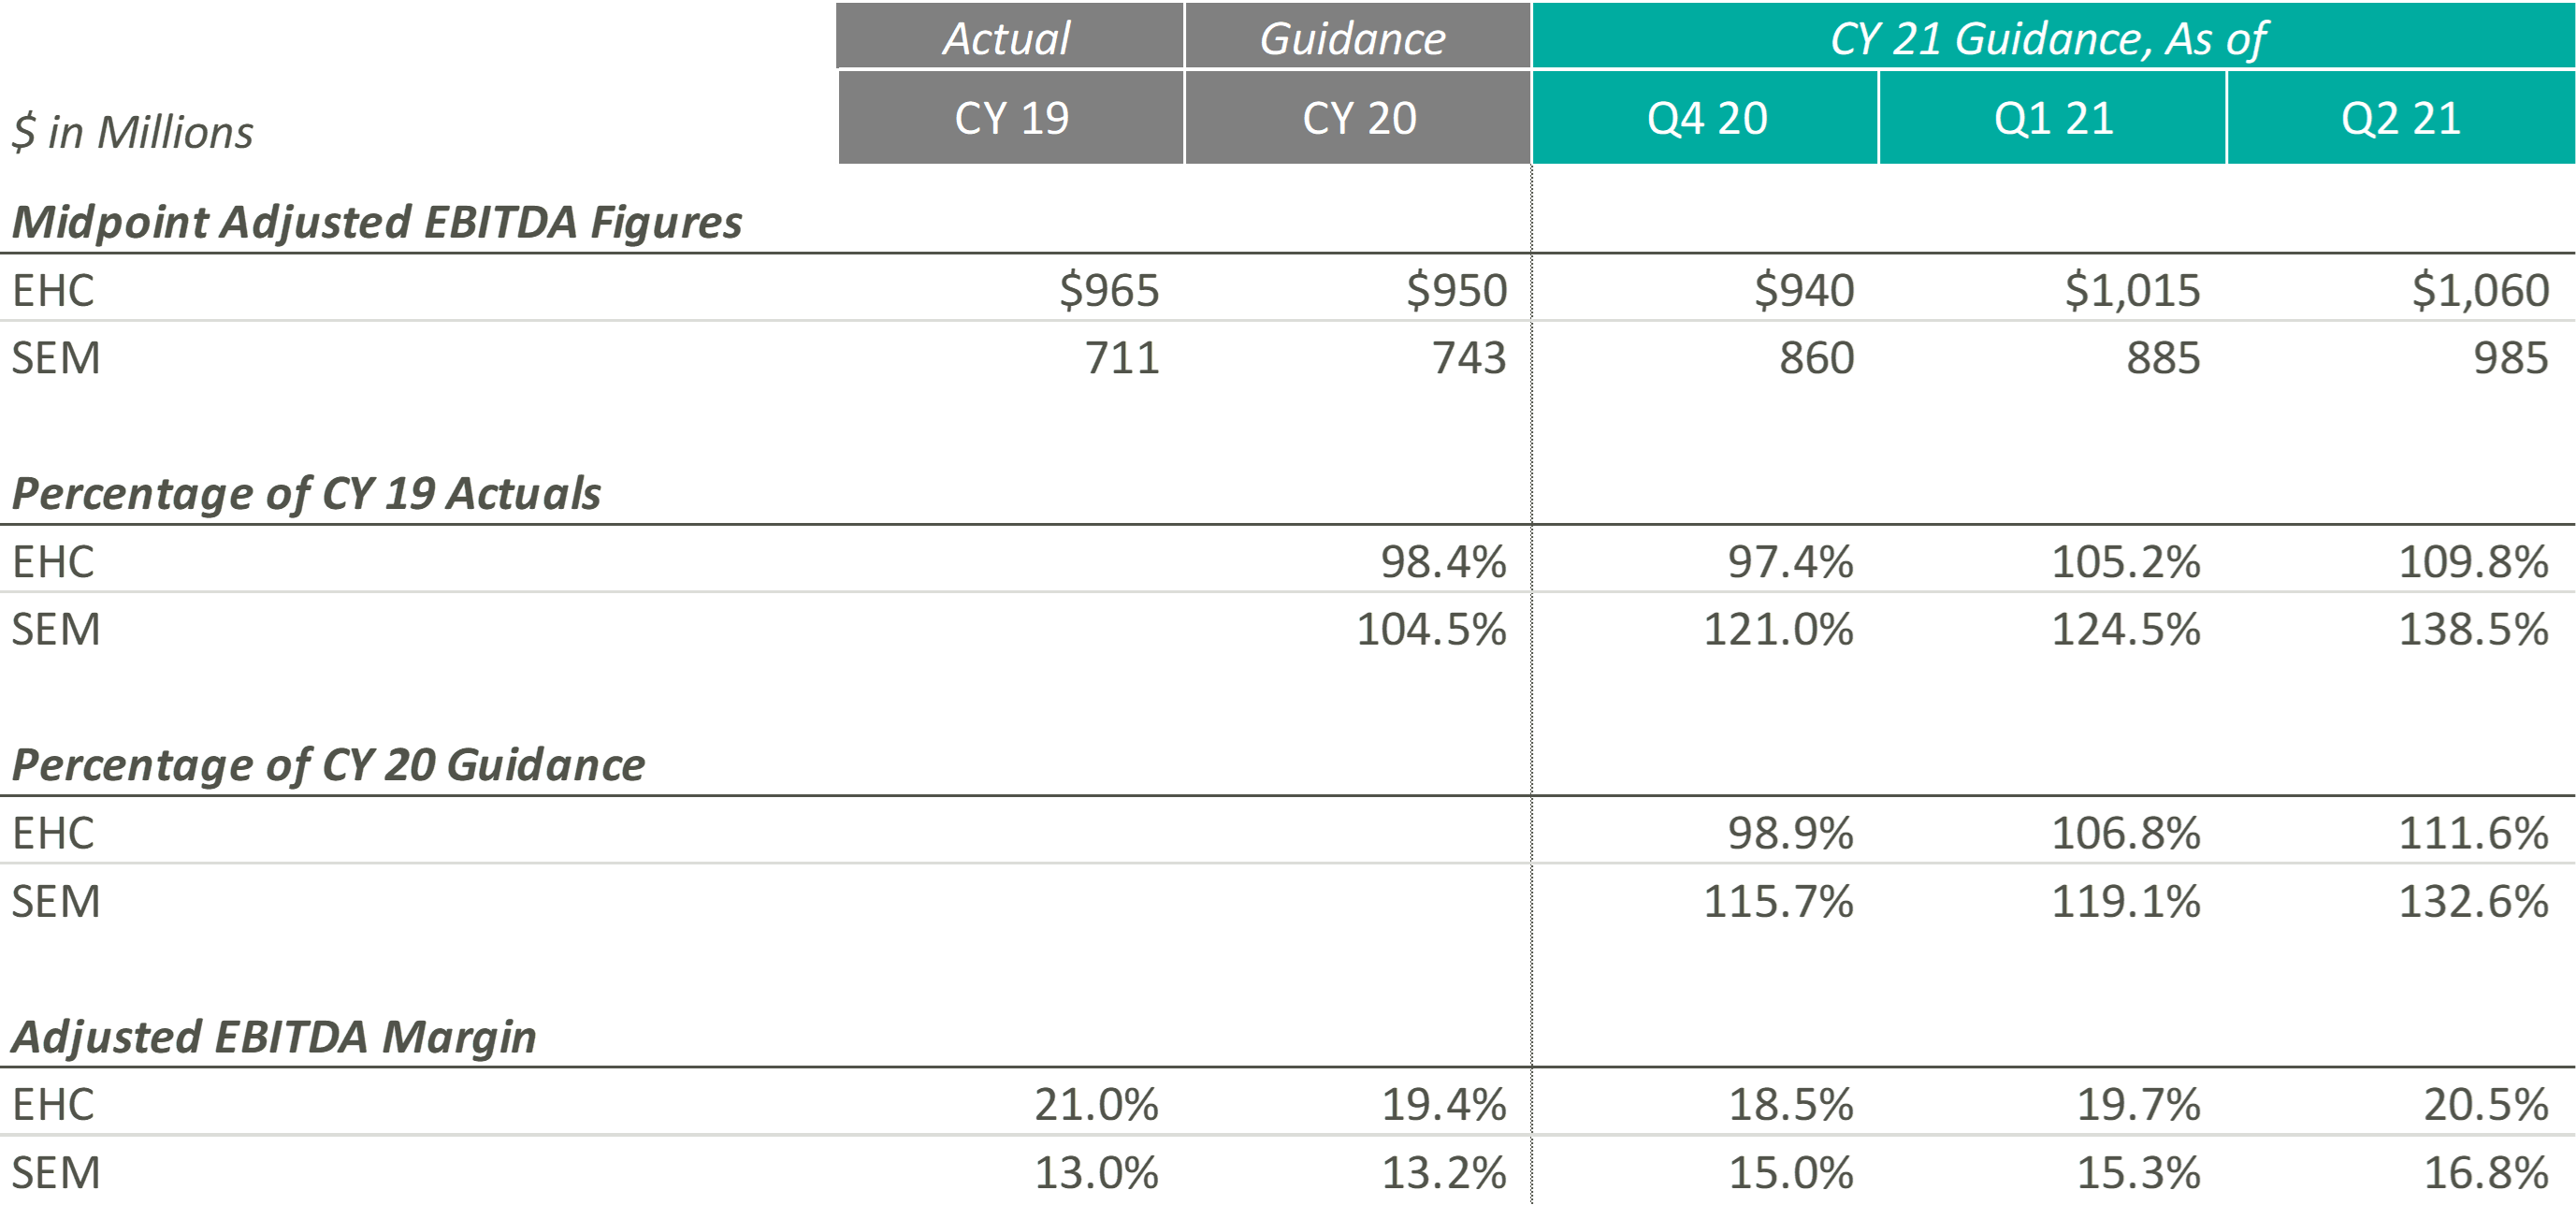
Similar to their CY 2021 revenue guidance figures, EHC and SEM have continued to raise their CY 2021 Adjusted EBITDA guidance ranges. According to EHC’s Q1 2021 earnings release, EHC increased CY 2021 guidance “to reflect Q1 performance and the extension of suspension of sequestration.” Similarly, in Q1 2021, SEM cited revenue growth as the primary driver of adjusted EBITDA growth, with revenue growth resulting from favorable pricing, a new joint venture, a higher acuity patient mix, increased reimbursement rates, and the suspension of sequestration.
Even with the COVID-19 pandemic affecting performance in CY 2020, SEM beat its original CY 2020 midpoint guidance figures by approximately $57.0 million, primarily driven by revenue growth in its inpatient segments. As SEM’s outpatient segments return, SEM’s Adjusted EBITDA performance continues to improve in CY 2021. During SEM’s Q2 2021 earnings call, the Co-Founder & Executive Chairman, Robert A. Ortenzio, stated, “In addition to the volume growth, the inpatient and outpatient rehabilitation hospitals and clinics posted their highest quarters for adjusted EBITDA in the history of the company.”
On the margin side, although EHC has continued to increase its expected CY 2021 Adjusted EBITDA margin throughout the past two quarters, management has cited pressures in nursing staffing across the country that may result in “a little bit of cost climb as we move into 2021 and throughout the year.” On the other hand, SEM has projected Adjusted EBITDA margins at levels well above those expected pre-pandemic. As SEM continues to raise their expected Adjusted EBITDA margin, management has noted that their expenses are being managed well, resulting in current Adjusted EBITDA margins that are “the highest in the history of the company.”
Overall, both Post-Acute Care operators have reacted positively to successful performances over the first half of CY 2021. To this point, Mark Tarr, CEO and President of EHC, noted “the combination of the return of our former market, along with new referral sources we’ve added throughout COVID, leave us very encouraged about the strong organic growth opportunities beginning in the back half of the year.”
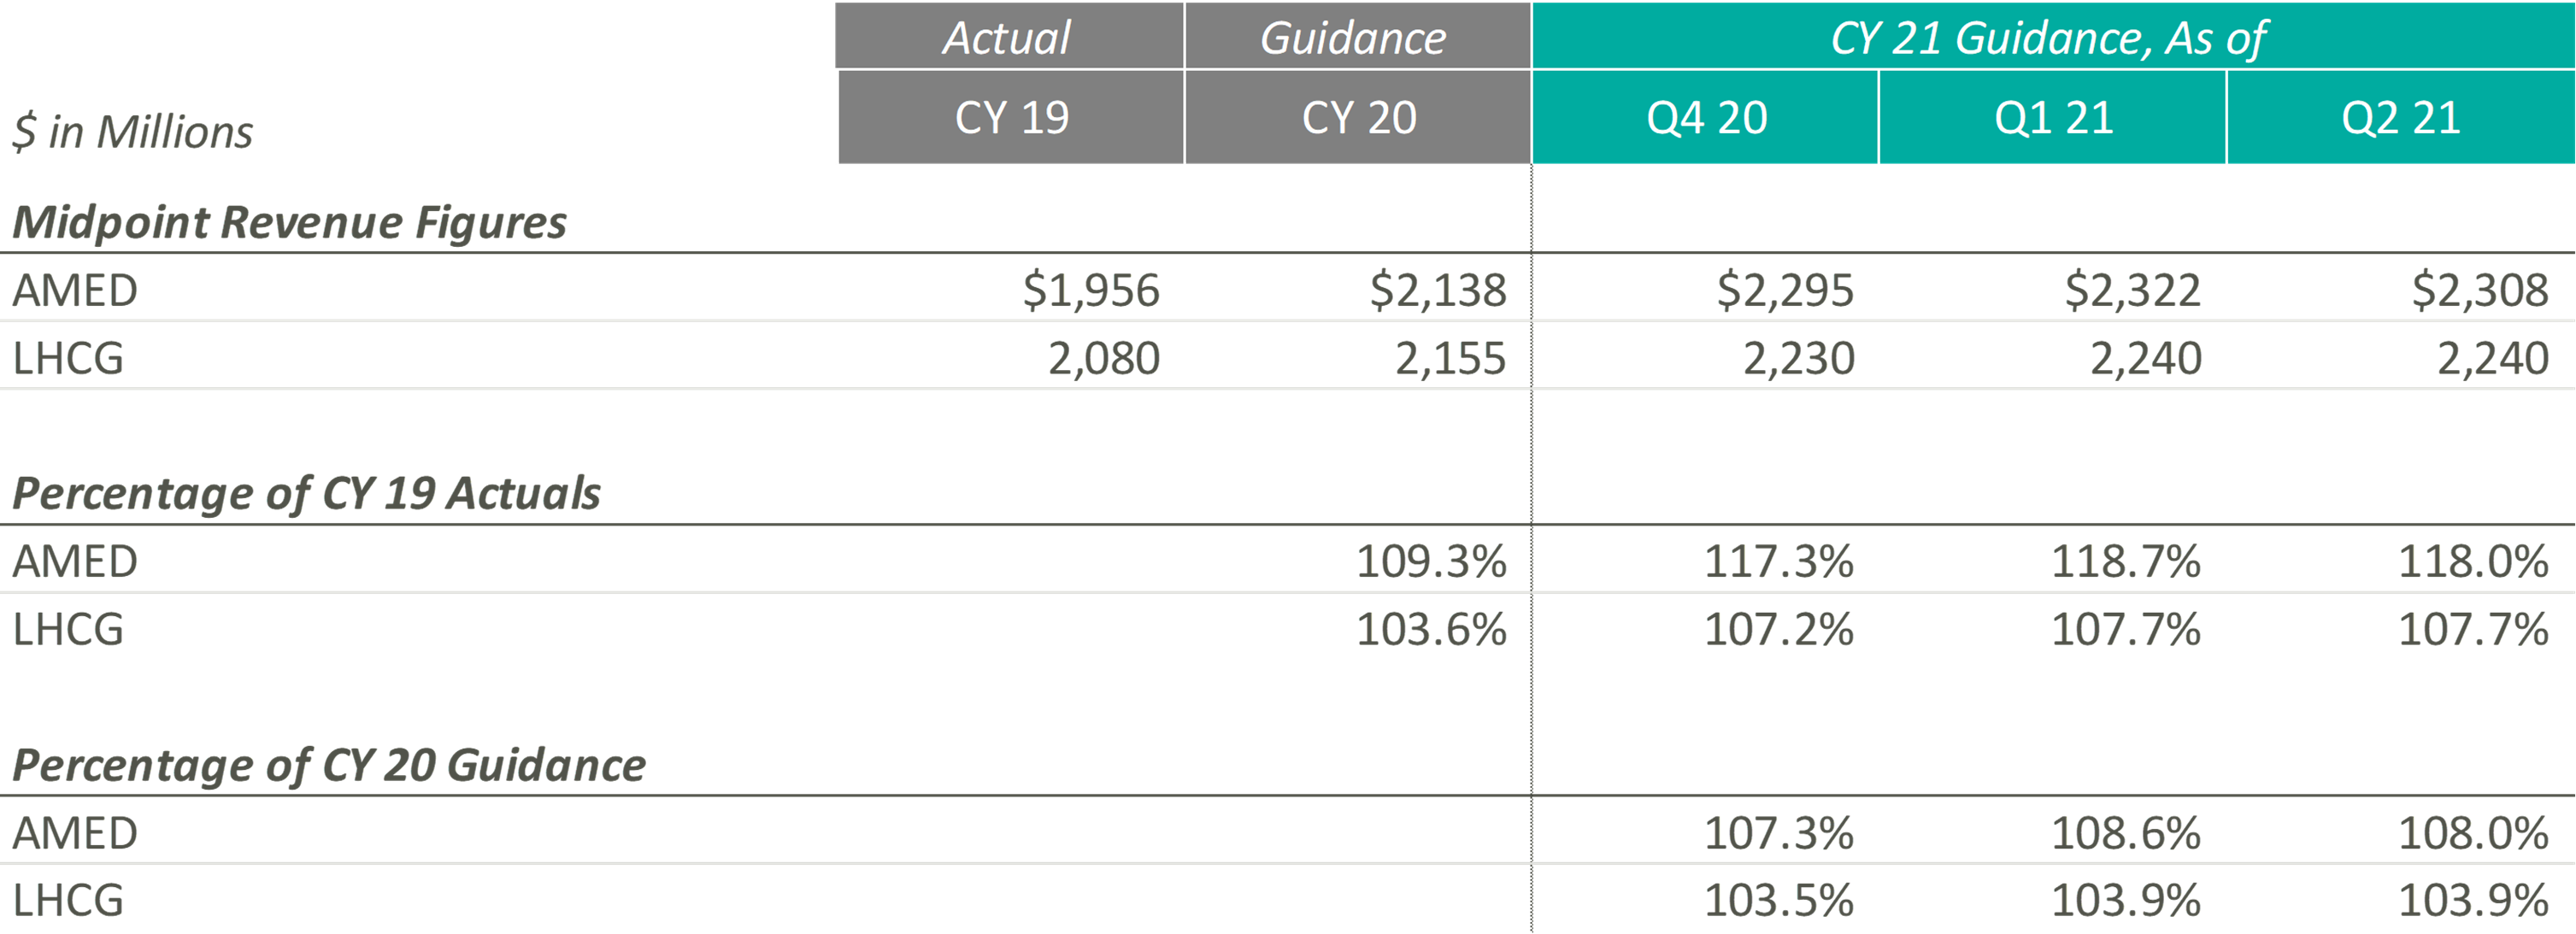
Since the end of CY 2019, AMED and LHCG have both steadily increased their observed revenue estimates, until the most recent quarter. In fact, AMED lowered its CY 2021 guidance during its most recent earnings call citing more conservatism due to the “prolonged, and now, resurgent impact of COVID on our hospice business.” More specifically, the pandemic has resulted in a continued decline and suppression of occupancy rates in senior living facilities (a major referral source), a decrease in length of stay, and an increase in hospice staff turnover. AMED’s management noted that when previously releasing CY 2021 guidance, they had not expected the continuation of COVID impacts during the second half of the year. LHCG discussed similar headwinds but did not adjust the projected guidance figures.
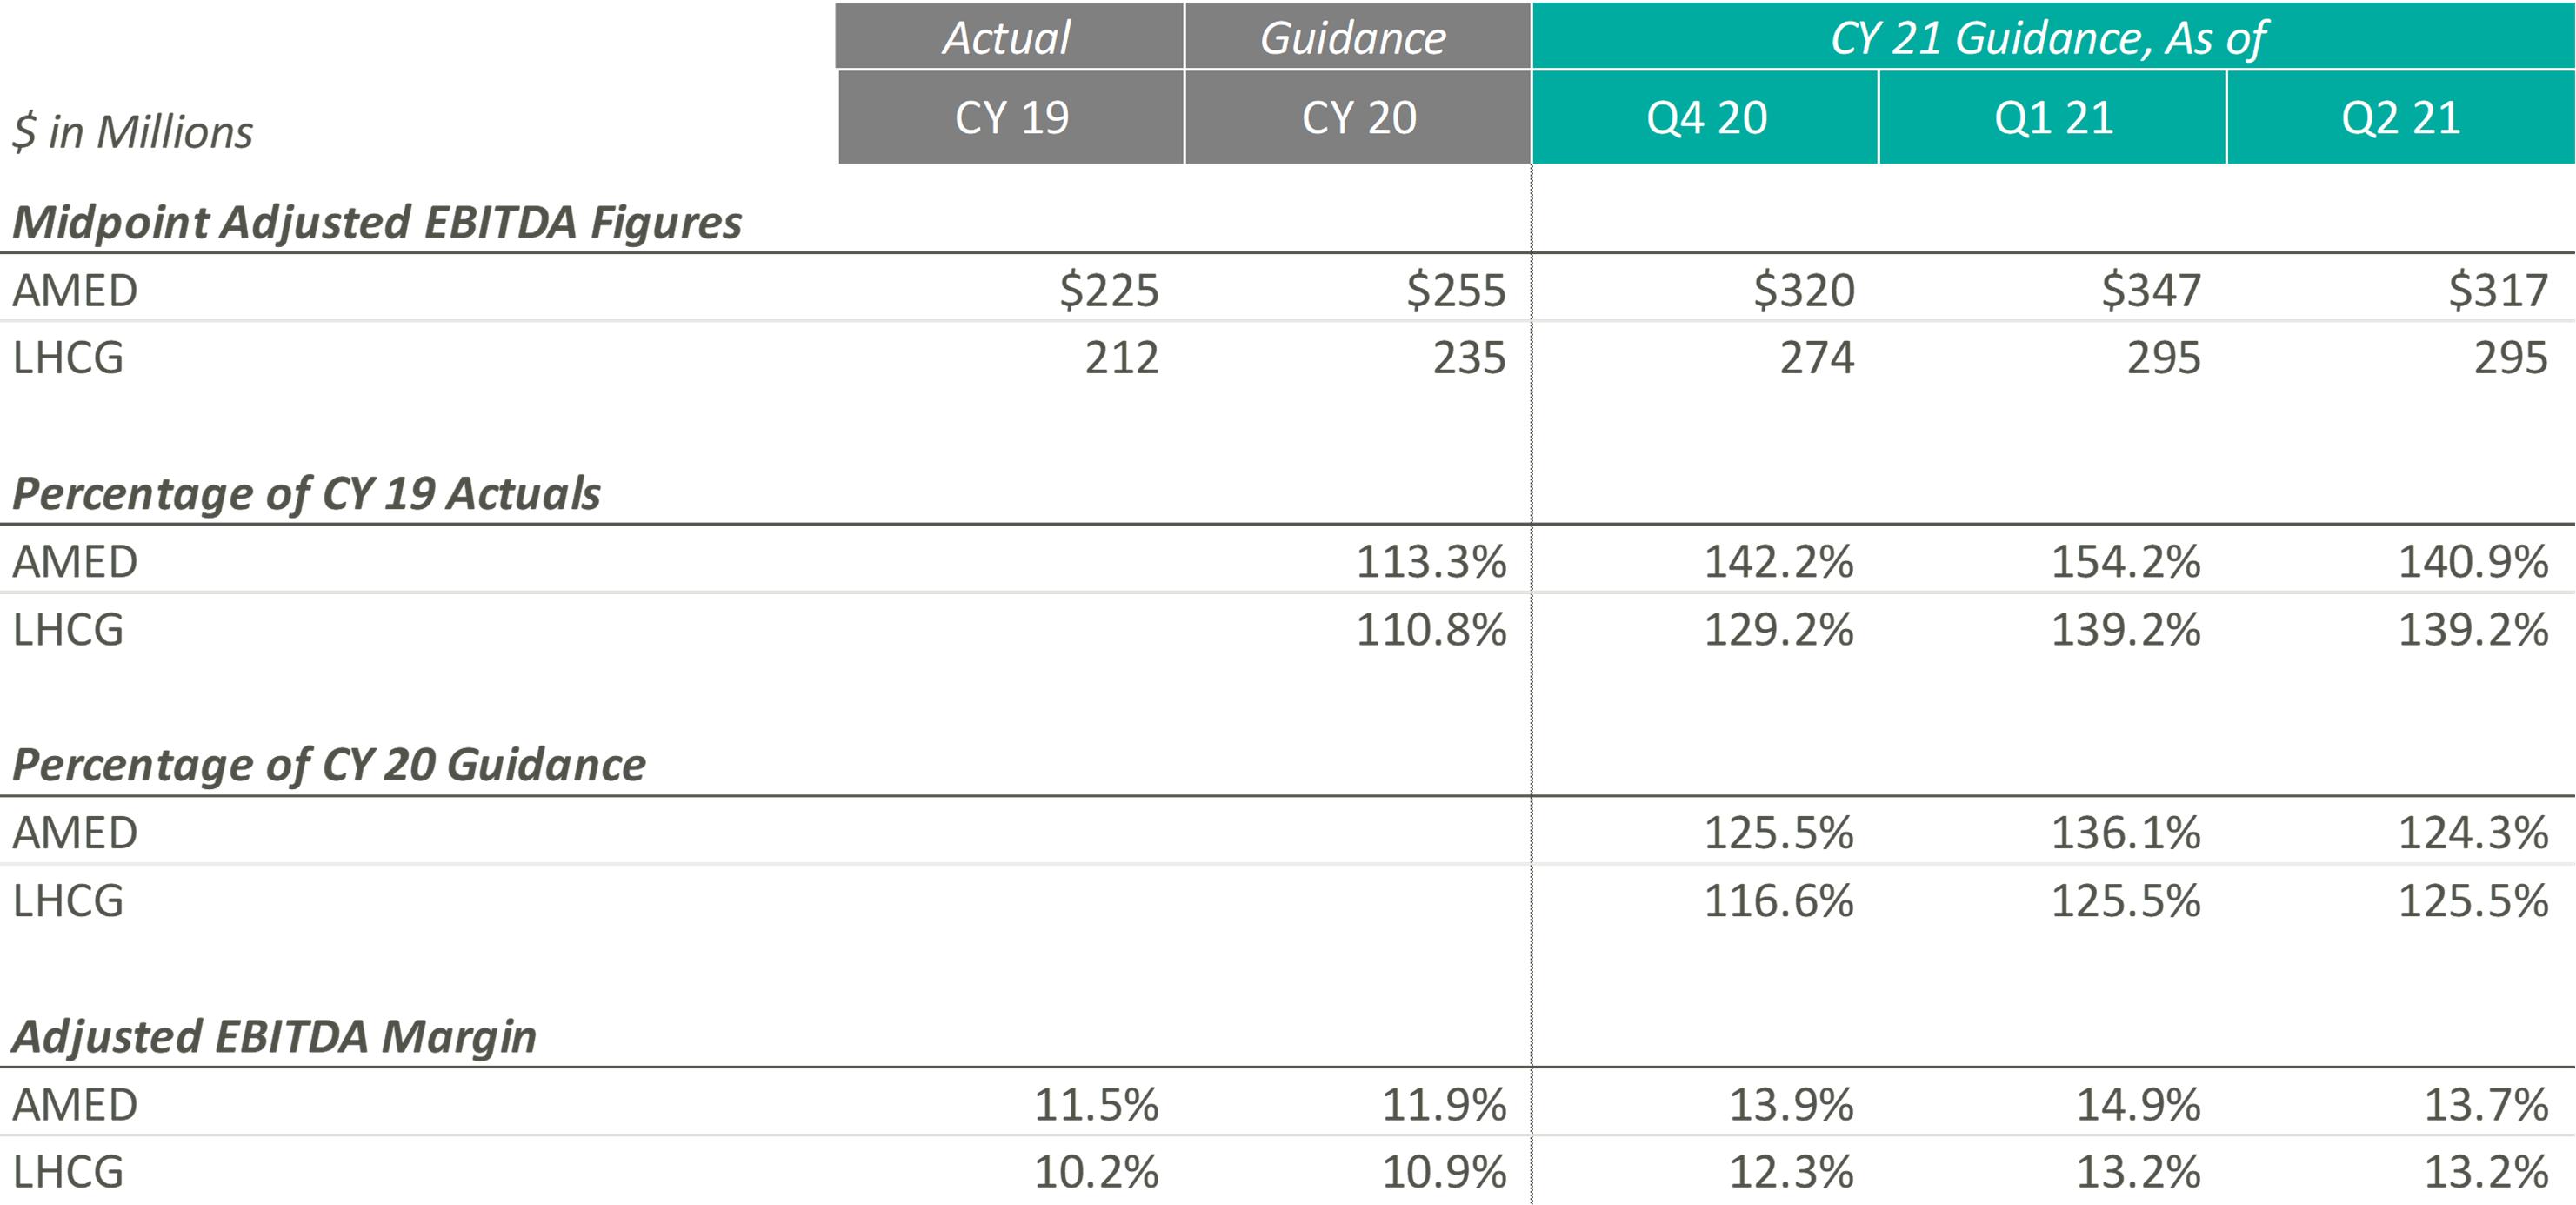
During Q4 2020 and Q1 2021, the Home Health & Hospice operators expected to significantly improve upon their CY 2019 and pre-COVID CY 2020 adjusted EBITDA guidance levels. Keith Myers, CEO of LHCG, discussed the company and overall industry’s success, stating “We are also benefiting from an improved legislative and regulatory outlook as legislative initiatives from Congress, innovation from CMS and stated budget and stimulus priorities of the Biden Administration are all emphasizing the need for at home care.” In addition to improved expected adjusted EBITDA levels since the pandemic, the adjusted EBITDA margin for the Home Health & Hospice operators has also increased compared to CY 2019 and pre-COVID expected CY 2020 levels.
While these Home Health & Hospice operators expected strong performance as they emerge from the pandemic, referrals from senior housing have remained low since the pandemic. Kevin McNamara, CEO and President of Chemed, a company in the space that does not provide guidance for its Home Health & Hospice subsidiary, stated, “The most complex issue still facing [our subsidiary] is the disruptive impact that the pandemic has had on traditional hospice referral sources and low occupancy in senior housing. This disruption continues to impact our admissions and traditional patient census patterns.” This sentiment was reflected in AMED’s Q2 2020 earnings call, where they decreased guidance to reflect the headwinds discussed previously.
Despite the recent concerns related to the continuation of COVID, operators remain optimistic about the future of the space, specifically the demographic tailwinds. During the Q4 2020 earnings call, Paul Kusserow, CEO and President of AMED stated “[Demographics are] in our favor with the baby boomers creating a potential surge of patients in the coming year, with more people turning 65 years old than ever before. The burgeoning 75-plus population, coupled with ever-increasing unsustainable health care costs puts us in a very advantageous position.”
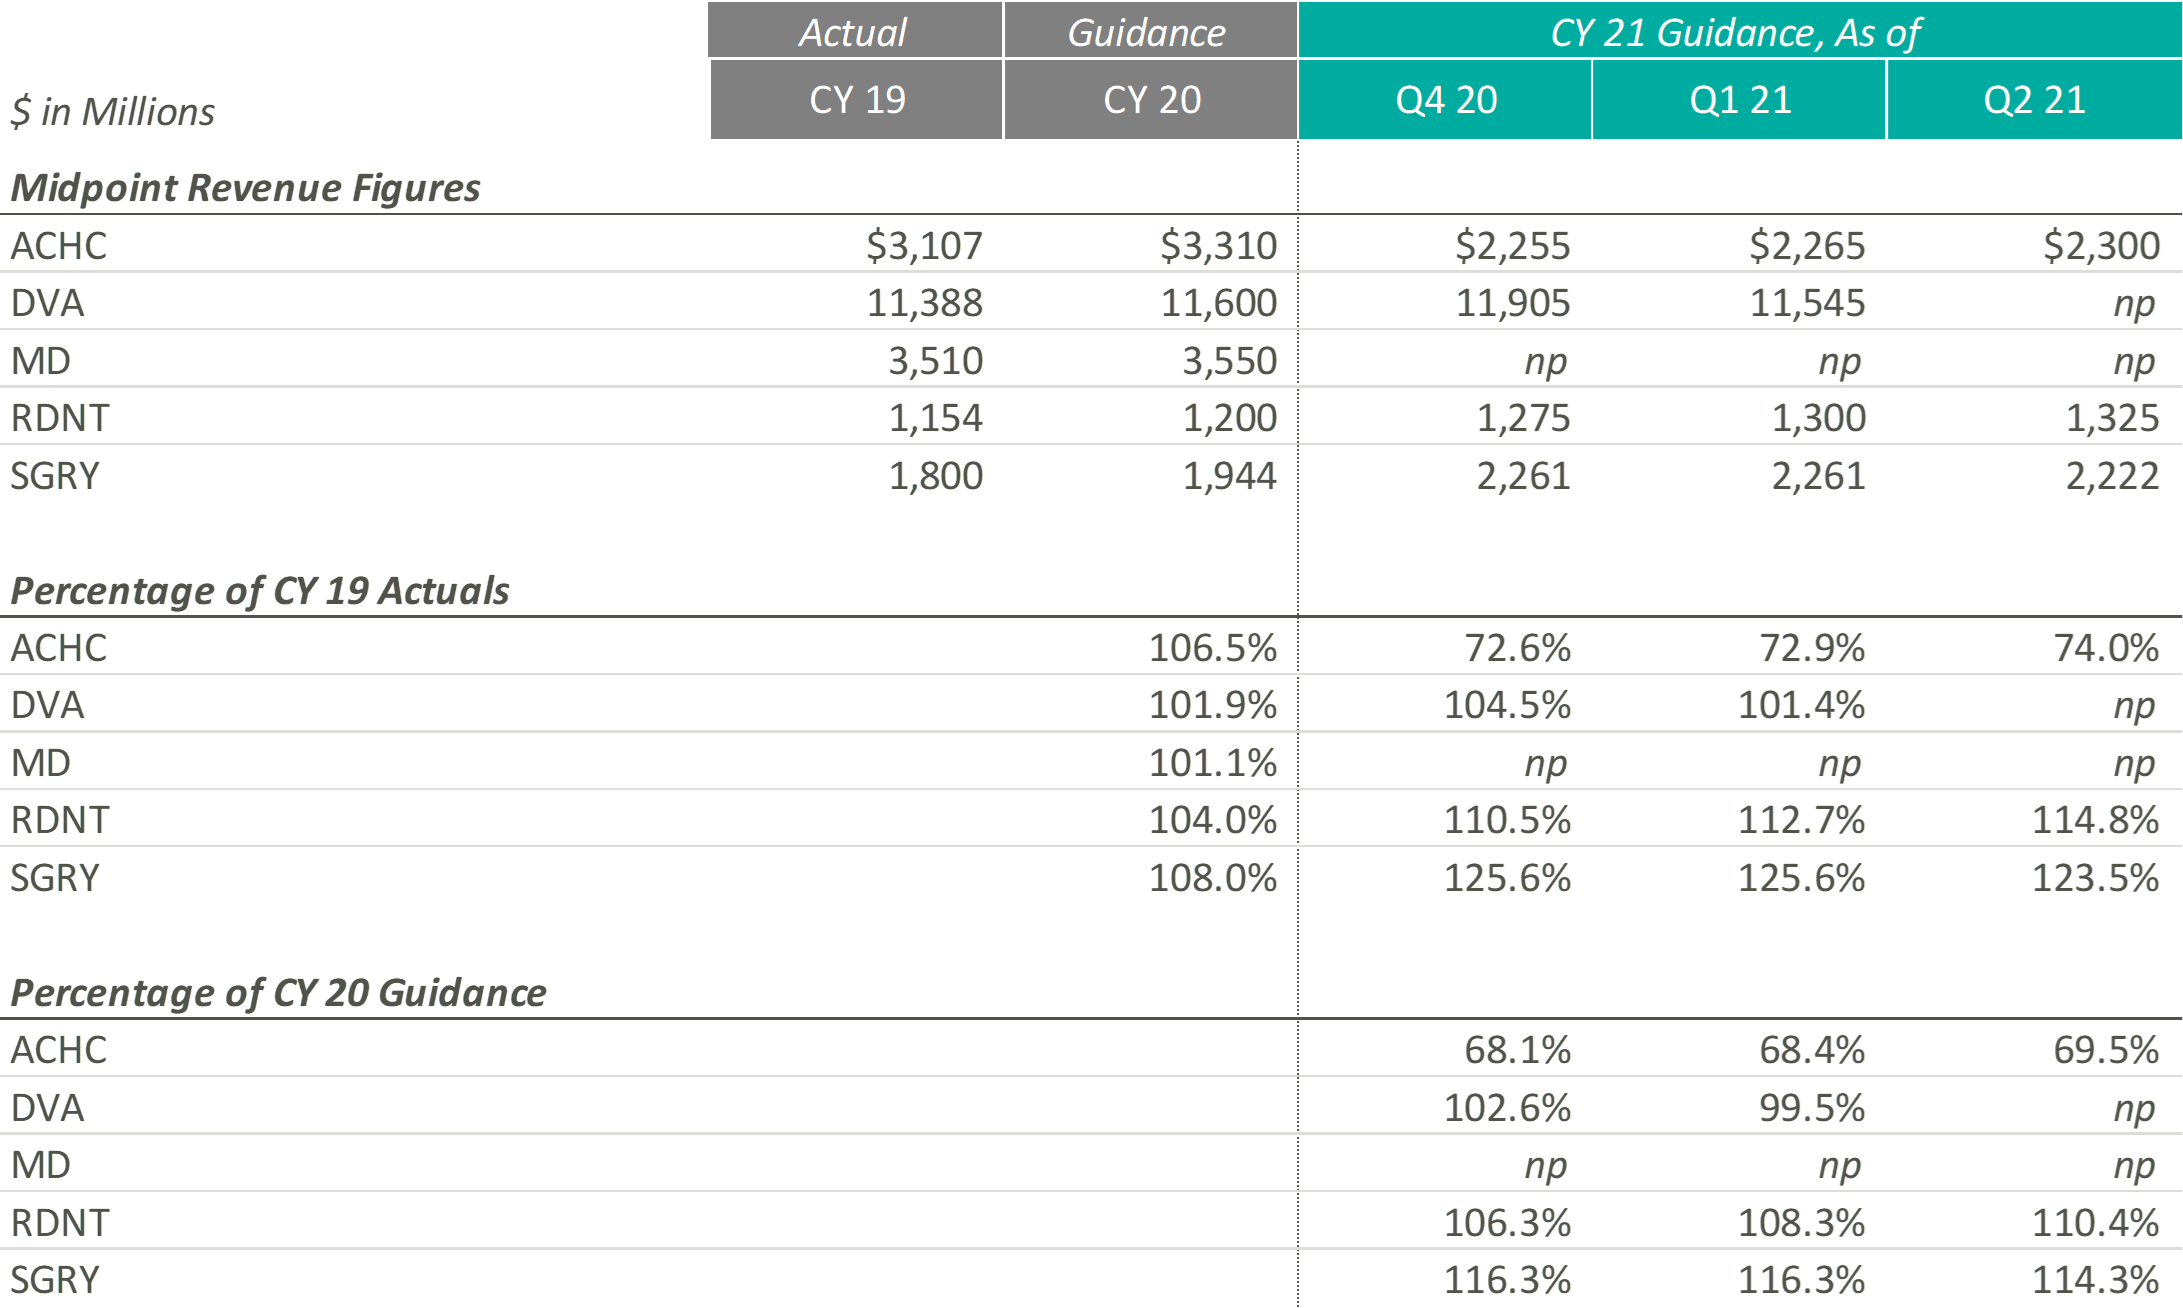
Revenue projections for Outpatient and Other operators are varied as they represent a variety of industries and markets that have been affected by COVID-19 in different ways. RDNT, which provides diagnostic imaging services, and SGRY, which runs ambulatory surgery centers, expect growth above both CY 2019 revenues and expected pre-COVID CY 2020 revenues. RDNT increased their revenue guidance as volume, in virtually all areas of the business, has increased as the states in which they operate have loosened COVID-19 restrictions. While still higher than CY 2019 and CY 2020, SGRY has decreased their CY 2021 revenue guidance as low acuity cases are expected to represent a larger portion of the case mix than previously thought.
On the other end, ACHC, a behavioral health company, expects growth below both CY 2019 revenue and expected pre-COVID CY 2020 revenues. However, ACHC is an outlier as they sold UK operations to a private equity firm in December 2020, making it difficult to compare going forward guidance estimates with historical estimates. ACHC increased CY 2021 guidance as patient volume increased due to the mental health crisis that evolved during the pandemic as well as an increase due to the societal acceptance of mental health services.
DVA, which performs dialysis services, did not provide CY 2021 guidance during the most recent earnings call. Additionally, MD, a physician-led medical group that partners with hospitals, health systems and health care facilities to offer women’s and children’s care, has still not resumed guidance since they announced in their Q1 2020 earnings report that they would no longer provide guidance due to the rapidly evolving nature of the COVID-19 pandemic.
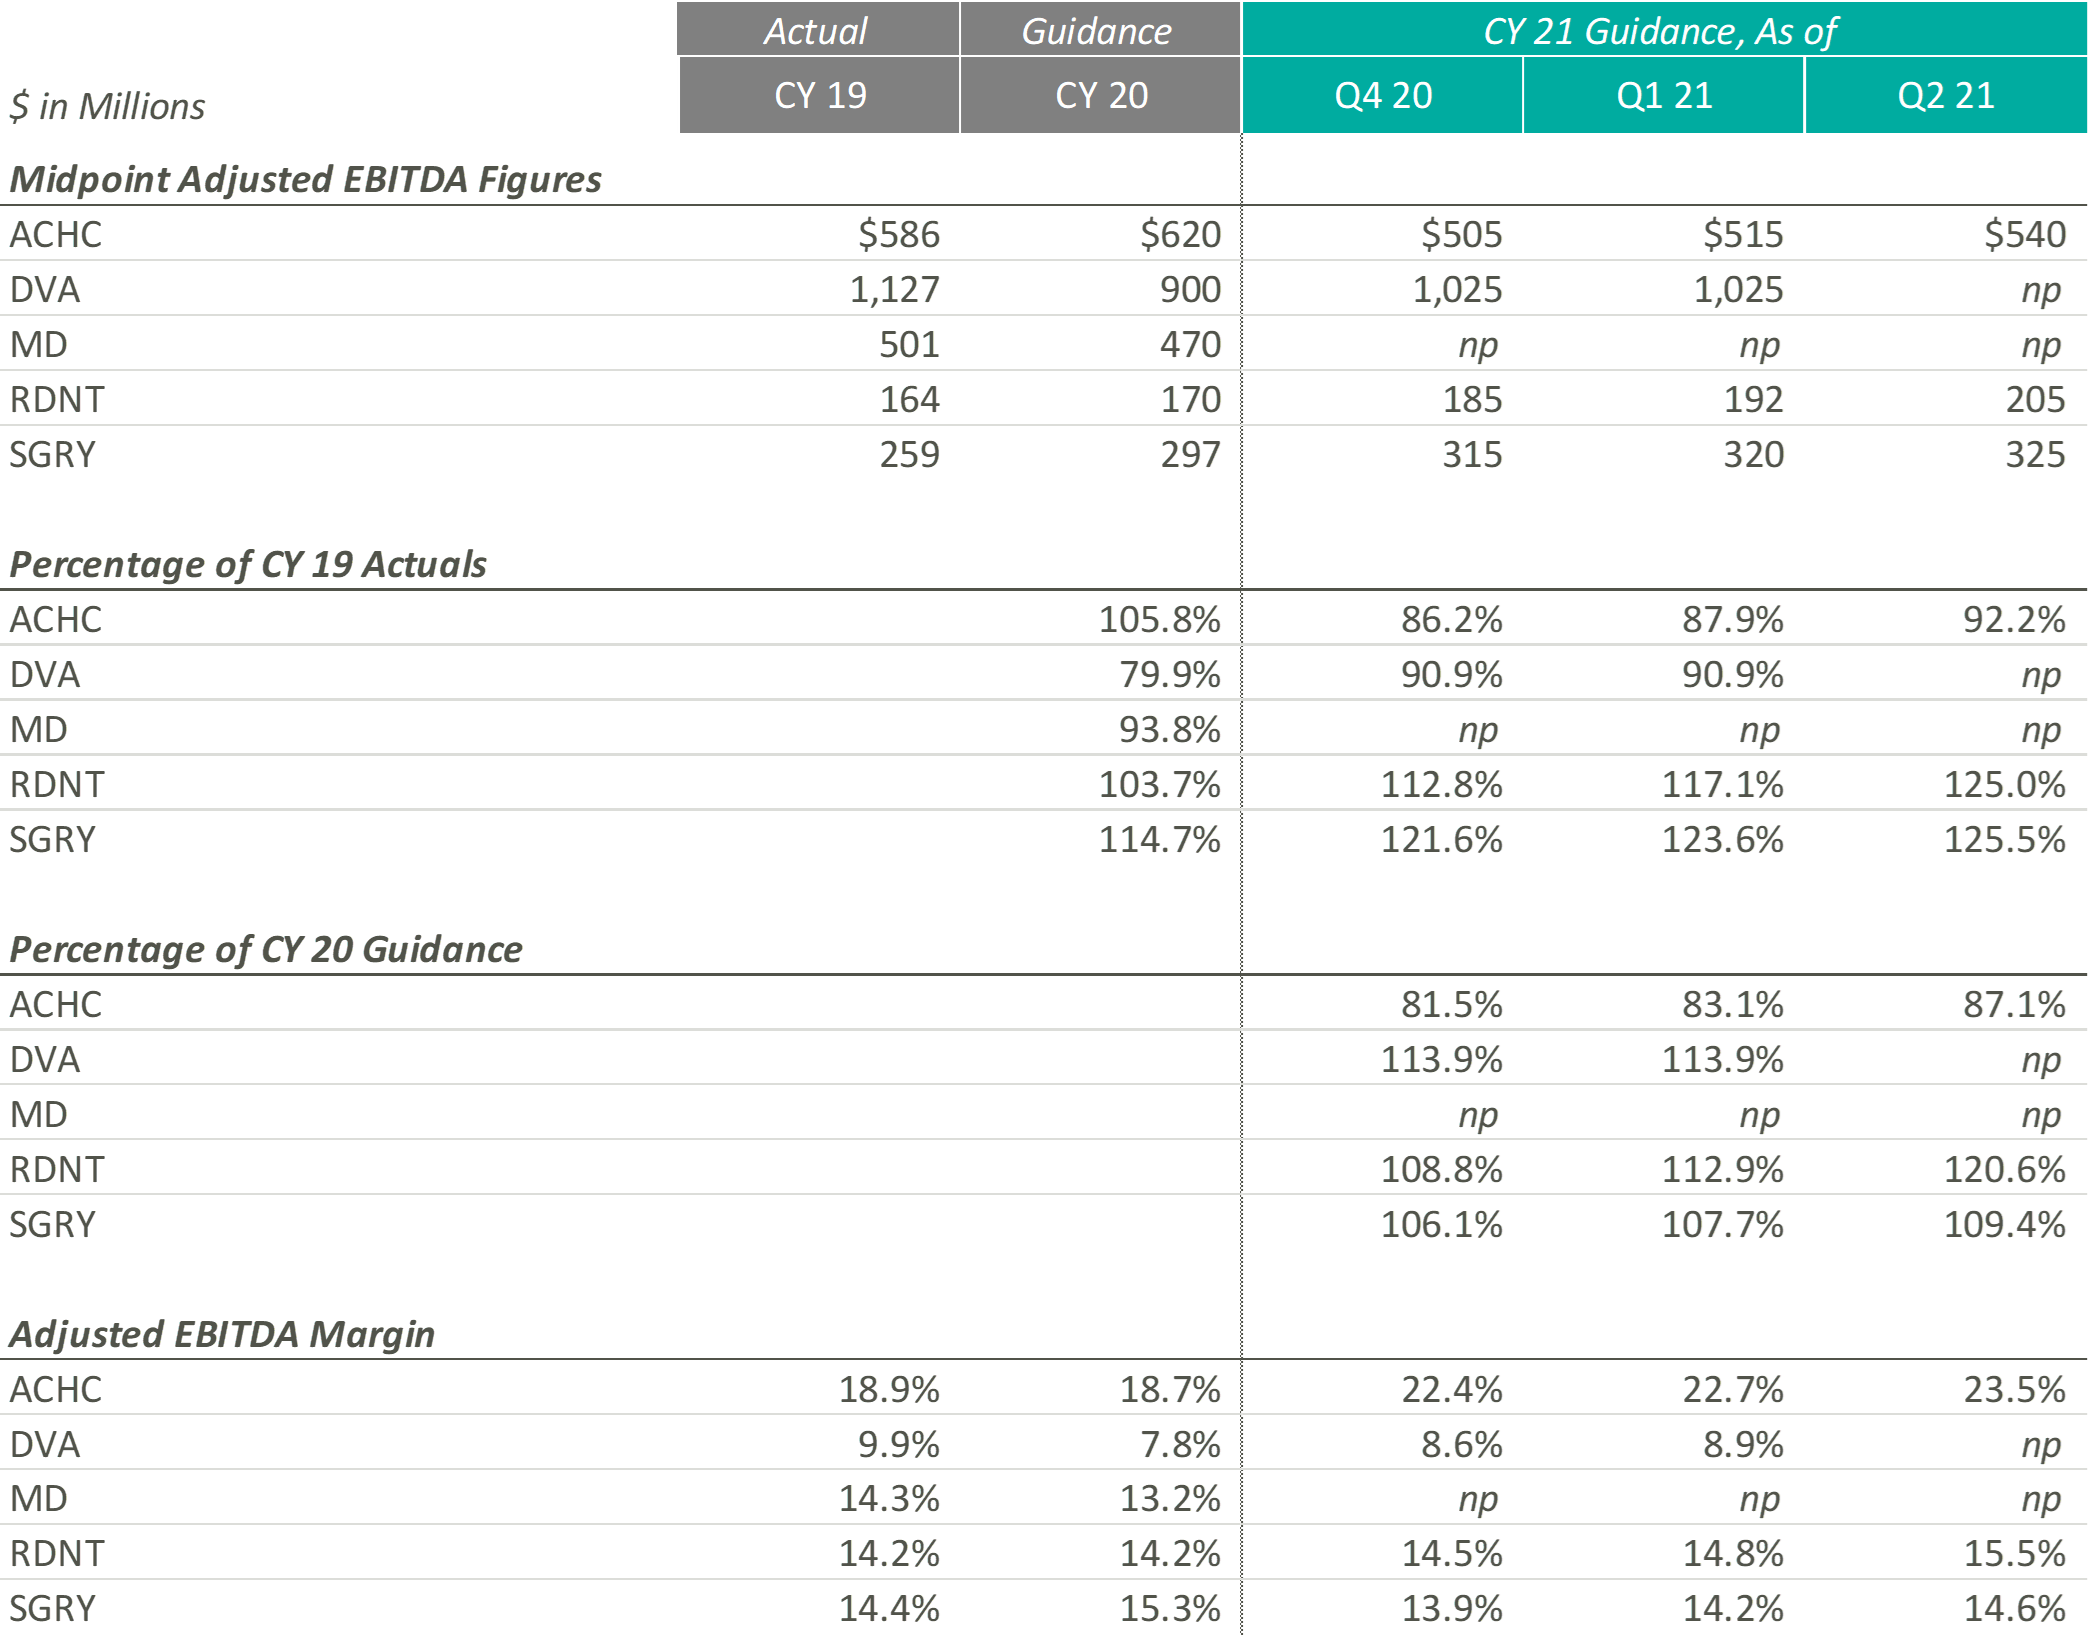
During the most recent earnings calls, every entity that provided guidance increased their CY 2021 guidance figures. ACHC increased adjusted EBITDA guidance due to a rise in patient volume and the expectation that the demand for mental health services is expected to increase. ACHC also expects their adjusted EBITDA margin to increase as more cost synergies are realized with the addition of new beds and facilities.
While DVA did not provide adjusted EBITDA guidance, the CFO & Treasurer, Joel Ackerman, stated “we’re also expecting an uptick on costs related to testing, vaccinations and teammate support as a result of the Delta variants” during the company’s Q2 2021 earnings call.
During the most recent earnings call, RDNT raised their CY 2021 EBITDA guidance from $192m to $205m. According to Mark D. Stolper, the Executive VP & CFO, RDNT’s adjusted EBITDA margins have improved due to regional cost efficiencies and an increase in reimbursement due to previous investments in new equipment. Howard G. Berger, President & CEO of RDNT, recently stated in the company’s Q2 2021 earnings call that “with patient volume returning to more normal levels and through implementing aggressive cost-cutting and cost containment programs, our same-store growth and performance model has returned.”
Like RDNT, SGRY has increased their most recent CY 2021 adjusted EBITDA guidance due to the expectation of volume increases due to seasonality and a rise in higher-acuity procedures. J. Eric Evans, CEO & Director of SGRY, stated in the Q2 2021 earnings call that margins “are projected to increase in the back half of 2021, consistent with historical performance as seasonal commercial mix intensifies.”
The entities in this section represent a variety of sub-industries that were all affected by the pandemic in a unique way. Overall, it appears that the companies that were able to create cost efficiencies and see a notable recovery in volume increase their guidance figures, while those who dealt with increasing expenses and continued volume variability decreased or did not provide guidance.
Although each industry and operator reacted to the pandemic uniquely, the overall outlook among these operators remains positive. Comparing the most recent guidance figures to CY 2019 performance, eight out of eleven operators with sufficient guidance data expect higher revenue in CY 2021 according to their most recent Q2 2021 earnings reports. Furthermore, nine of the same eleven operators estimate similar performance with adjusted EBITDA.
Comparing Q2 2021 guidance to the CY 2020 estimates released before the pandemic can provide additional insight on which companies not only survived but continued to grow throughout the COVID-19 pandemic. Eight out of the eleven operators expect CY 2021 revenue to exceed estimated revenue levels at the beginning of CY 2020. Additionally, ten out of eleven predict similar trends with adjusted EBITDA. However, it is interesting to note that some of these operators, specifically in the Acute Care Hospital sectors, expect CY 2021 estimates to outperform CY 2020 estimates only by a slim margin. Since these operators are only predicting a small amount of revenue and adjusted EBITDA margin expansion from 2020 to 2021, it appears they might not have experienced normal levels of development throughout the pandemic. The Post-Acute Care and Home Health & Hospice operators, on the contrary, expect to significantly outperform pre-COVID CY 2020 estimates in 2021, illustrating that these two sub-industries may not have experienced a “lost year” of growth in 2020 as a result of the COVID-19 pandemic.
Lastly, to understand how these operators’ performance has trended throughout CY 2021, we have compared the most recent CY 2021 guidance figures to those released during the Q4 2020 earnings calls. Nine out of eleven companies have adjusted revenue guidance to levels at or above the initial figures, and ten out of the eleven have either increased adjusted EBITDA estimates or left them equal. Based on these statistics, it appears operators have successfully started CY 2021.
Despite the lingering COVID-19 pandemic, it appears healthcare operators are optimistic about the recovery of their revenue and Adjusted EBITDA metrics over pre-pandemic levels. Further, many healthcare operators have taken the past year and a half to implement new strategies that will allow them to become more efficient long-term. Overall, it appears the healthcare operators have adapted during these times and are optimistic about their future performance despite the lingering COVID-19 pandemic.
Related Content