

Five Key Analyses for Healthcare Financial Due Diligence
Christa Shephard
May 20, 2024

Written by Matthew Marconcini, CPA
Selling your company can be an exciting time, filled with potential opportunities for growth and new horizons. Whether your company is accrual based, following GAAP, or it reports on a cash basis, proper preparation for the sale of your company is extremely important. This journey often involves a complex web of financial transactions and negotiations, with numerous parties at the table. Among the critical elements in this process are financial due diligence and performing a quality of earnings (QOE) analysis. The QOE process is a critical aspect of financial reporting and analysis that helps stakeholders, like investors and creditors, assess the reliability and sustainability of a company’s reported earnings.
The QOE analysis can play a pivotal role in shaping the outcome of the sale and can significantly impact the perceived value of your business. Therefore, as management, it is essential to be well-prepared and proactive in assessing and evaluating the quality of your business’ earnings, as it influences the selling price and builds trust and confidence among potential investors and other stakeholders. We have outlined eight steps management can take to best prepare for the QOE process.
Management should have a clear understanding of what QOE means. It assesses the underlying economic substance of reported earnings, ensuring they are not distorted by accounting manipulations or one-time events.
Accurate financial record-keeping is fundamental to high-quality earnings. Management must ensure that financial statements are free from material misstatements and that all transactions are properly recorded.
Transparency is crucial. Ensure all material transactions, both positive and negative, are adequately disclosed in the financial statements and related footnotes.
Maintain consistency in financial reporting practices. Frequent changes in accounting policies can raise questions about the QOE. If policies do change, explain the rationale behind it and the financial impact of the change.
Recognize revenue in accordance with accounting standards only when it’s earned and realizable. Avoid prematurely recognizing revenue or engaging in overly aggressive practices. If your company reports on a cash basis, pulling together the proper data that will show revenue based on date of service rather than the collection date will be key.
Clearly distinguish between one-time or non-recurring events and ongoing operations in financial reporting. Disclose the nature and impact of such events to prevent misinterpretation.
Be prepared to provide a comprehensive and honest analysis of the company’s financial results. Explain the drivers of earnings, changes in accounting policies, and potential future risks and uncertainties. The more support you can provide related to both historical performance and future growth initiatives, the more accurate and comprehensive your analysis.
Take the time to review the various systems used to operate the business and start pulling data together. If certain systems are maintained by third parties, informing them of the situation and discussing what they need to do will create a smoother process. If certain reports don’t have the necessary inputs or data, be prepared to discuss that and what alternative information would be useful.
By considering these guidelines and implementing the underlying thought processes, management can best prepare for the QOE process, demonstrating a commitment to transparency, accuracy, and integrity in financial reporting. This, in turn, builds trust and credibility with investors and other stakeholders, creating a smooth transaction process for management.
Written by Christa Shephard and Maureen Regan, President Elect, NYSSPA
Physician assistants (PAs), soon to known as physician associates and advanced practice registered nurses (APRNs), like nurse practitioners (NPs), midwives, CRNAs, and clinical nurse specialists, have been around for decades. The first class of PAs graduated from Duke University in 1967, and in 1965, the first training program for NPs began at the University of Colorado. Since then, for many reasons, both professions have become integral to the quality delivery of healthcare. Although they have different education, training, and scope (PAs trained in medicine and APRNs in an advanced theory of nursing practice model) integrating these professionals into a practice can elevate the patient experience, as their access to the healthcare services they need will increase, and there could be an increase to the bottom-line financials of a practice as a result. Physicians experience greater job satisfaction, as PA and APRN integration helps to alleviate overburdened work schedules, including on-call obligations. Through these benefits, interprofessional integration leads to better patient retention, patient referrals, physician satisfaction, and stronger financial health for practices and health systems.
The Centers for Medicare & Medicaid Services (CMS) certainly plays a role in the practice and reimbursement environment of PAs and APRNs; however, most of the legislative and regulatory environment for practice is determined at the state level. Due to the evolution of each profession and the historical and ongoing shortage of physicians, it’s important for health systems and practices to stay abreast of primary source legislative and regulatory guidance changes regarding scope, documentation, and billing compliance. These factors are also important to ensure an employer is capturing maximum reimbursement for clinical work done by both professions while minimizing their risk of an audit and resulting penalties. Systems and practices must uphold an ongoing, longitudinal review of Medical Staff Bylaws, delineation of privileges, policies, and processes.
CMS recognizes qualified billing providers to render services independently and establishes billing and coding rules for PAs and APRNs to ensure accurate reimbursement and quality care delivery within the Medicare program. These rules outline the scope of practice and reimbursement guidelines for nurse practitioners, physician assistants, certified nurse-midwives, clinical nurse specialists, and certified registered nurse anesthetists who must adhere to specific documentation requirements, including maintaining accurate patient records and submitting claims using appropriate evaluation and management (E/M) codes, like physicians. Additionally, CMS provides guidance on incident-to billing, which allows certain services provided by PAs and APRNs to be billed under a supervising physician’s National Provider Identifier (NPI). Understanding and following CMS billing and coding rules are essential to navigate the complexities of reimbursement and ensure compliance with Medicare regulations.
Because CMS recognizes PAs and APRNs as qualified billing providers but not as physicians, they fall into a separate reimbursement category. When billing under their own NPI, the reimbursement level is less than what it would be if the physician were to bill for the same services. This reimbursement differential does not adversely impact a practice’s bottom line, as remuneration for a PA or APRN is less than a physician and malpractice cost is less.
Physicians may bill for a service that was rendered by a PA or APRN with incident-to services and with split/shared E/M services. VMG Health Managing Director and coding and compliance expert Pam D’Apuzzo says, “There’s two rules, which is where everybody gets themselves into trouble… Those two rules have specific guidelines, both from a documentation and a billing standpoint. The patient type, the service type—everything needs to be adhered to.”
To bill for incident-to and split/shared E/M services, practices must meet specific criteria outlined by Medicare. For incident-to services, the criteria include:
For split/shared E/M services, the criteria include:
These criteria ensure that incident-to and split/shared services are billed appropriately and in compliance with Medicare guidelines. Medicare also dictates that the “substantive portion” of a split or shared visit is more than half of the time a physician or non-physician practitioner spends performing the visit or a “substantive part” of the medical decision making. Practices must continually educate and train all medical staff so that they can successfully adhere to these criteria to avoid billing errors and potential audits. Additionally, practices must continuously monitor to ensure all documentation, billing, and coding processes are followed correctly.
There are tools and services that allow for easier monitoring. “We utilize a tool called Compliance Risk Analyzer, which provides us with statistical insight on coding practices,” D’Apuzzo says. “So, we can data mine ourselves and see what’s happening just based on our views. And this is what the payers, specifically, and the government does as well: They can see the [relative value units] RVUs are for a physician or off the chart, or that a physician has submitted claims for two distinct services at two different locations on the same day.”
This is more common than you might think.
“What’s normally happening in those interactions is that [a physician with two locations] realizes he can’t keep up with all of that patient flow in two places, so they hire a PA and put them at location number two,” D’Apuzzo says. “But now all that billing goes under the physician, so it flags for Medicare.”
With VMG Health’s Compliance Risk Analyzer (CRA), practices can see the same data mining and areas of risk, as the program would flag the RVUs as a potential audit risk. This gives practices the opportunity to self-audit and refine their processes to ensure they are billing and coding appropriately.
VMG Health offers multiple comprehensive services that help health systems and practices implement and follow new procedures and new provider utilization without issue, from honoring existing care models to ensuring provider compensation is fair, compliant, and reasonable.
Cordell Mack, VMG Health Managing Director, says, “We’ve spent a lot of time trying to make sure we get that right, both in terms of the underlying, practice-level agreements as well as the ways in which the compensation model works for both the physicians and the PAs and APRNs.”
In many practices, physicians struggle to handle their case load, which means their busy schedules can prevent them from seeing existing patients and from taking on new patients. Bringing PAs and APRNs into the fold allows physicians to create capacity in their schedules so that they can see new patients.
BSM Consulting (a division of VMG Health) Senior Consultant and subject matter expert Elizabeth Monroe provides an excellent example: “Let’s say we have an orthopedic surgeon who really wants to spend most of their time in surgery. We would want to have that physician in surgery because that’s what their skill set, and licensure permits. With a nurse practitioner or physician assistant providing follow-up, post-operative care, that oftentimes is a much better model. It allows the physician to do the surgical cases only they can do, but it also eases patient access to care.”
This realignment of a physician’s schedule creates an opportunity to provide more patient services, which easily translates to improved patient satisfaction when, without this, they would likely be unable to see their provider when they felt they needed to be seen. While PA and APRN–rendered Medicare services are reimbursed at 85% instead of 100%, our experts say that the 15% differential shouldn’t dissuade practices and health systems from leveraging the integration.
“It’s a very short-sighted approach to just think about, ‘But we could be making 100% instead of 85% if we bill under the doctor,’ because ultimately, we are never able to do that 100% of the time, and it’s a higher risk than it is reward,” says D’Apuzzo.
Additionally, physicians with packed schedules and no other scheduling options may inadvertently rush through appointments to see each patient scheduled for that day. Patients who feel rushed may leave an appointment feeling unheard and like their problem is unresolved. Additionally, when a patient calls and asks for services but can’t be seen for multiple weeks or months, they may never make an appointment and instead turn to another provider for help.
All of this culminates in poor patient retention, which equals a loss of revenue for the practice. Dissatisfied patients will seek treatment elsewhere. However, when practices and health systems embrace an interprofessional team, patients are more likely to be able to schedule appointments when they feel they need to be seen, feel heard in an appointment and even spend less time in the office overall as they are not impacted by OR cases running late, and so on.
“Practices are better able to meet patient demand, and they’re able to really allow physician assistants, nurses… to add a tremendous value for the patients, offering them outstanding care,” Monroe says.
With both patient demand and physician scarcity placing the U.S. health system in crisis, many practices and health systems know they need to integrate PAs and APRNs into their workflows, but they don’t know how. VMG Health offers strategic advisory services that can guide this implementation to ensure practices are educated, compliant, and working within the care model they prefer.
“Our team would want to spend time really trying to identify the underlying care model that practices are trying to, you know, work inside of,” says Mack.
One approach is to assess patient needs and practice capabilities to determine the most effective roles for PAs and APRNS, such as providing primary care, specialty care, or supporting services like telemedicine. Implementing policies and workflows can ensure efficient PA and APRN utilization while maintaining quality and safety standards.
Finally, ongoing training, quality monitoring are essential to ensure their interprofessional integration into the practice or health system effectively meets patient needs, and care provided by PAs and NPs should be included into physician quality and compliance review processes.
“It starts with getting your appropriate documentation in place… [with] supervisory responsibilities and collaborating physician agreements,” says Mack. “It migrates to, ‘What’s the operational agreement among the team?’ and how cases are presented, or how the physician is consulted. So, it’s getting an underlying clinical service agreement among those professionals.”
Optimal PA and APRN utilization shows up in the numbers. When practices increase patient access to care without overburdening physicians, they can accommodate more patients, leading to increased revenue generation. Moreover, because PAs and APRNs often bill at a lower rate than physicians, integrating them efficiently can improve cost-effectiveness, thereby enhancing the overall financial performance of the practice.
“It should realize an ROI, and that ROI should be something more in terms of duties and tasks that other teammates can’t do,” says Mack. “Meaning, it would be unfortunate if a qualified healthcare professional is working at such a capacity whereby duties some of the day-to-day responsibilities should probably be done by teammates working at a higher level of their own individual license.”
Changing existing workflows can be difficult, but the rewards heavily outweigh the risks. Physicians must support interprofessional integration to successfully navigate the transition. Physicians are typically the leaders and decision-makers within medical practices, and their support is essential for implementing any significant changes in workflow or care delivery models, which includes having front office staff, medical assistants, nursing and administrative staff rely and respect the roles of PAs and APRNs. Without physician buy-in, resistance to change may arise, hindering smooth integration and retention.
Physicians play a vital role in collaborating and ensuring a seamless care model is implemented and sustained. By endorsing and supporting the integration of PAs and APRNS, physicians can foster a culture of teamwork and mutual respect within the practice. This collaborative approach promotes a cohesive care team to provide high-quality patient care.
It’s important for physicians to trust and communicate that PAs and NPs are qualified and capable of providing excellent patient care. Allowing them to care for an established patient does not sever the relationship between the physician and the patient; it can actually enhance the patient’s experience and trust in the practice.
“We want patients who have had a long-standing relationship with an MD to be able to see that doctor, and then we want to help the doctor know and understand how to appropriately transfer care over to an APRN within their system or within their practice,” says Monroe. “So, that provider can be still linked to the doctor, and the doctor can still be linked to the patient.”
Furthermore, physician buy-in is essential for maintaining continuity of care and ensuring patients feel confident in receiving treatment from both physicians and PAs and NPs. When physicians actively endorse interprofessional integration and communicate the benefits of team-based care to their patients, it builds trust and acceptance of the practice model. It also fosters billing transparency if a patient gets an EOB with the name of someone other than the physician as the rendering provider.
Physician engagement is critical for the long-term success and sustainability of integration initiatives. When physicians recognize the value that PAs and APRNs bring to the practice, including increased efficiency, expanded access to care, and improved patient outcomes, they are more likely to champion these initiatives and advocate for their continued support and development.
The integration of PAs and APRNs into medical practices and health systems presents a strategic opportunity to optimize patient care delivery and operational efficiency. By expanding access to healthcare services and alleviating the workload of overburdened physicians, integration improves patient and employee satisfaction, and enhances patient retention. However, successful integration requires careful attention to regulatory compliance, billing, and coding practices. VMG Health offers comprehensive billing, coding, and strategy advisory services to support practices in navigating the complexities of integration, ensuring compliance with Medicare regulations, and maximizing reimbursement while minimizing audit risk.
Optimal PA and APRN utilization yields tangible benefits, including increased patient access to care, improved patient satisfaction, and enhanced financial performance. By understanding their education, training, and scope, and by leveraging their unique skill sets, practices can accommodate more patients, reduce wait times, and deliver high-quality care cost effectively. Physician engagement is essential for the successful implementation of integration initiatives, as physicians play a pivotal role in endorsing and supporting interprofessional responsibilities within the care team. Through collaborative leadership and effective communication, physicians can foster a culture of teamwork and mutual respect, driving the long-term success and sustainability of integration efforts.
In summary, strategic integration presents a transformative opportunity for medical practices and health systems to meet evolving patient needs, enhance operational efficiency, and achieve sustainable growth. By partnering with VMG Health for expert guidance and support, practices can navigate the complexities of interprofessional integration with confidence, realizing the full potential of this innovative care delivery model.
Maureen C. Regan, MBA, PA-C, FACHE, DFAAPA, is the President-Elect and Past President of the New York State Society of Physician Assistants (NYSSPA) and a Delegate for the American Academy of Physician Associates (AAPA). She is recognized as a Fellow of the American College of Healthcare Executives (FACHE) and a Distinguished Fellow of the American Academy of Physician Associates (DFAAPA). The views expressed in this article are her opinion and do not represent the opinions of any organization or association she is affiliated with.
American Academy of Physician Associates. (n.d.). History of AAPA. Retrieved from https://www.aapa.org/about/history/
American Medical Association. (2022). AMA president sounds alarm on national physician shortage. Retrieved from https://www.ama-assn.org/press-center/press-releases/ama-president-sounds-alarm-national-physician-shortage
Centers for Medicare & Medicaid Services. (2023). Advanced practice nonphysician practitioners. Medicare Physician Fee Schedule. https://www.cms.gov/medicare/payment/fee-schedules/physician-fee-schedule/advanced-practice-nonphysician-practitioners
Centers for Medicare & Medicaid Services. (2023). Advanced Practice Registered Nurses (APRNs) and Physician Assistants (PAs) in the Medicare Program. Retrieved from https://www.cms.gov/medicare/payment/fee-schedules/physician-fee-schedule/advanced-practice-nonphysician-practitioners
Centers for Medicare & Medicaid Services. (2023). Incident-to billing. Medicare. https://www.cms.gov/medicare/payment/fee-schedules/physician-fee-schedule/advanced-practice-nonphysician-practitioners
Centers for Medicare & Medicaid Services. (2023). Medicare Physician Fee Schedule final rule summary for calendar year 2024. https://www.cms.gov/files/document/mm13452-medicare-physician-fee-schedule-final-rule-summary-cy-2024.pdf
Mujica-Mota, M. A., Nguyen, L. H., & Stanley, K. (2017). The use of advance care planning in terminal cancer: A systematic review. Palliative & Supportive Care, 15(4), 495-513. https://www.ncbi.nlm.nih.gov/pmc/articles/PMC5594520/
Written by Joel Gomez, ASA
Before you begin the process of selling your medical practice, it is always in your best interest to ensure your practice’s value is accurately represented. Most buyers of medical practices, including healthcare systems and hospitals, begin the transaction process with a fair market value analysis of the business revenues to determine the purchase price. Unfortunately, many practices in the position of selling are in a break-even or negative cash–flow scenario. In these instances, the value of the practice may be most accurately represented by the fair market value of personal property and real property.
Some buyers opt to have personal property valued on a “desktop” scope of work, relying on data in the form of a depreciation schedule or practice inventory as the basis of the fair market value analysis. While acceptable for fair market value purposes, this approach may not capture all owned personal property.
The first approach for identifying personal property through accounting documents is the use of a depreciation schedule or fixed asset listing (FAL). While real property is easily identifiable (the space is either owned or rented), personal property listings are often less maintained, reliant on an accountant’s tracking of capitalized assets, and may not fully reflect what is owned. When preparing a valuation, an appraiser is always subject to the quality of available data. FALs maintained by an accountant only display equipment that meets the predetermined capitalization cost threshold determined by that accountant. Additionally, some capitalized assets are removed from the FAL once it has fully depreciated according to accounting standards. Providing an equipment appraiser, a FAL as the basis of their appraisal could mean valuable practice assets are not captured.
An on-site inspection and asset inventory by an appraiser allows them to capture all assets on a room-by-room basis, regardless of original purchase cost or visibility on the FAL.
Another alternative to an appraiser performing an on-site inspection is to have a practice employee create the inventory. While this may sound like a good approach initially, information captured by someone other than an appraisal expert tends to be inconsistent. Items captured in one room are missed in the next, and inconsistent asset descriptions will lead to follow-up information requests, requiring the selling practice to invest more work hours.
Hiring an appraisal expert to complete an on-site inventory and inspection of the practice’s tangible personal property ensures personal property listings are maintained, fully reflect what is owned, and include consistent asset descriptions from room to room. VMG Health reviewed a sampling of projects over the past 18 months, across several practice specialties, and noted that when completing a site visit as part of our valuation process, the fair market value conclusion of exam rooms was roughly 60%–70% higher on a per-room basis compared to relying on practice data/inventories.
VMG Health’s qualified equipment appraisers have the knowledge and experience to complete a discrete and comprehensive inventory, gathering all necessary data during the visit and minimizing interruptions to the practice operations and patient flow.
VMG Health’s team of equipment appraisers has over 55 years of experience in the equipment appraisal field across all sectors of the healthcare industry and includes three accredited senior appraisers with the American Society of Appraisers. Since 1995, VMG Health has earned the trust of our clients with extensive expertise in navigating the dynamic factors that influence value. If you are in the process of valuing your practice, use VMG Health’s equipment appraisers to complete an on-site inspection, inventory, and valuation of your personal property.
Written by Christa Shephard
Even in today’s ever-evolving world of leadership, there remains a belief that admitting vulnerability is a sign of weakness. However, in the latest episode of Coachify Over Coffee, Laura Baldwin and Savory Turman, leadership development coaches, challenge this misconception head on by diving into and emphasizing the importance of authenticity and its transformative power in leadership.
The fourth episode of Coachify Over Coffee, It’s OK Not to Be OK, addresses a common misconception among leaders in healthcare and across all industries: the fear that admitting they’re not okay diminishes their credibility. Our coaches discuss how authenticity breeds trust and connection, strengthening teams and organizations. They highlight lying about one’s well-being can undermine trust far quicker than acknowledging vulnerabilities.
It’s important to define what “fine” really means in different contexts. Rather than accepting superficial answers, Baldwin and Turman encourage leaders to dig deeper. When leaders ask probing questions and foster genuine conversations, they uncover the truth behind their team’s well-being. Recognizing signs of burnout early on can help leaders and teams address stress before it escalates, preventing the negative impacts of prolonged stress.
The conversation extends beyond individual leadership and acknowledges organizational culture. Baldwin and Turman share how fostering authenticity can positively impact employee morale and organizational trust. According to a recent survey by the Society of Human Resource Management, a significant percentage of organizations may claim to prioritize employee mental health, but many fail to implement meaningful strategies. Missing substantive opportunities to support employee mental health only reinforces the need for genuine, actionable steps toward creating supportive work environments.
Baldwin and Turman leave listeners and leaders with practical advice: Regularly self-assess and reflect, asking ourselves, “What do I need in this moment?” Though it may seem like a simple question, its answers may be complicated, which can inspire deep self-discovery and a more balanced approach to leadership. When leaders own and address their personal struggles, they both enhance their own credibility and create environments where others feel empowered to do the same.
If you’re looking to improve your leadership effectiveness and have a greater impact on your practice, Coachify Over Coffee offers valuable insights and actionable strategies. Learn to shift your mindset, view daily problems through a different lens, and apply a new approach to your leadership with the help of Laura Baldwin and Savory Turman, two certified coaches dedicated to sharing their expertise with listeners like you.
Written by Christa Shephard
As new tools come to the forefront of healthcare delivery, staying compliant with updated billing and coding policies is crucial. VMG Health’s Compliance Risk Analyzer (CRA) is designed to help health systems and practices navigate the shifting healthcare landscape with ease, ensuring they remain compliant and avoid small mistakes that can lead to big consequences, like audits. Additionally, the financial returns from the undercoding of E&M codes and the potential FTE savings through improved efficiency, resource reduction, and cost-effectiveness underscore the value of implementing CRA.
Analytics are increasingly driving healthcare and its delivery. Government agencies and private payors use advanced statistical models to identify improper claims and target providers for audits. To balance the scales, healthcare managers need a fundamental understanding of these statistical practices. A manager does not need to be an expert statistician, but a foundational understanding of statistics is critical to properly coding, billing, and understanding common mistakes. A fundamental understanding of trending analysis, time series, confidence intervals, and other factors empowers providers and managers to maximize the benefits of CRA’s data analytics.
Health systems and practices should closely monitor their billing and coding processes. It is crucial to efficiently perform internal, risk-based audits that produce accurate results that mimic how the government audits. Catching and addressing mistakes early is key.
CRA employs artificial intelligence to simplify the compliance process. Instead of requiring managers to become statisticians, CRA handles the heavy lifting. Through its sophisticated algorithms, CRA automates the complicated task of data analysis, allowing healthcare providers to conduct risk-based audits as efficiently and accurately as possible. It also employs predictive analytics to identify which claims or services will be most likely to be audited, allowing providers to take proactive, preventive measures, saving time and money.
Typically, organizations use about 1.3 full-time employees (FTEs) per 1,000 providers just to start identifying audit targets. CRA completely eliminates this step, saving much of the upfront work and boosting the accuracy of risk prediction by reviewing 100% of claims. Creating and implementing an audit plan usually takes 0.8 FTEs per 1,000 providers; CRA handles it in seconds with just one click. Finally, practices usually spend about 20% of their resources just digging through claims within the EHR to choose which claims to audit. CRA automates this process, picking claims based on statistically valid, random samples or non-probability convenience samples. This data-driven, proactive technology allows healthcare organizations to address potential issues before they escalate.
Ultimately, CRA is about empowerment. Understanding the basics of statistics and data analytics is vital to fully capitalizing on its services. CRA is designed to help healthcare providers protect themselves from unwarranted audits and compliance issues. By integrating advanced analytics into everyday operations, health systems practices can enhance their compliance strategies and focus on delivering exceptional patient care.
Stay tuned for more insights on how CRA and other VMG Health solutions are transforming healthcare compliance.
Written by Glenn Morley
The aesthetics industry has grown significantly over the past few years, driven mainly by investor-backed consolidation of practices. Whether large or small, buy- or sell-focused, organizations focused on growth should explore acquisition and de novo development strategies. Aligning the right and best growth strategy with your organizational vision is critical and requires an examination of the strategic advantages both options can offer.
Aesthetics practice consolidation typically refers to the trend of medical aesthetics practices and medical spas merging or being acquired by investor-backed organizations. Consolidation in medical aesthetics has gained momentum over the past five years for several reasons:
The de novo strategy is the process of opening a new practice or medical spa or expanding to a new location from scratch. When choosing the de novo path, it is crucial to understand your business model. You need to identify the target market that offers the most significant probability of success in your area. Key population factors to consider include age and financial bands, and the competitive landscape. Consider launching a target market analysis to focus on your ideal region and region and entail customers. You can also evaluate the demographic data in your practice management system, complete focus group research, or hire experts to ensure there will be demand when you build.
A de novo growth strategy can offer compelling advantages, including control over branding, culture development, service offerings, and management. This also allows you to initiate your build with the retail mantra: location, location, location. A de novo strategy may also require a lower initial investment than an acquisition. However, this strategy can be challenging and time-consuming due to factors such as building a patient base, recruiting providers, and a team willing and able to build from scratch. A less arduous approach to de novo location growth is securing an anchor practice poised for expansion, a target geographic location, or an organization with expertise building de novo in other sectors.
An acquisition growth strategy involves purchasing established medical aesthetics practices and integrating them into an existing organization. While this approach offers immediate access to an established patient base and can provide a steady revenue stream, it comes with its challenges and risks. When a business is acquired, careful due diligence is required to ensure the revenue streams, operations, and systems are reliable and scalable. It will also require integrating many components, starting with culture, HR/personnel, marketing, and operational and financial systems.
Owners looking to expand to multiple locations should carefully evaluate the pros and cons of both de novo and acquisition strategies. Furthermore, it is critical to align these strategies with long-term goals, your current organization’s ability to scale, risk tolerance, and existing market opportunities.
Many growth-minded medical aesthetics organizations seek expert guidance in this process. Engaging industry professionals, including financial advisors like VMG Health and BSM Consulting, can offer invaluable insights and steer you toward informed decisions that align with your strategic expansion goals. Once you have a plan, creating a model of your new acquisition or de novo location is essential for a thoughtful approach to growth.
Whether you build a practice from the ground up or acquire an existing one, you must complete thorough due diligence, including examining financial health through day-to-day operations. Early phase due diligence will reward you with greater prosperity and less disruption.
Acquisition or de novo growth strategies offer excellent business owner opportunities; the choice should align with your practice’s risk tolerance and growth goals. Regardless of your chosen strategic growth plan, stay abreast of the changing landscape and dynamics in the expanding medical aesthetics marketplace.
Written by Frank Fehribach, MAI, MRICS; Danny Cuellar
There was once a time when no one considered a lease as an asset. It was just an expense to be paid at the end of the month and ignored until the following month. Then ASC 842 came around in 2018 and operating leases became assets—right-of-use assets (ROUs), to be exact. ROU assets had to be put on the balance sheet and depreciated. Then they had to be tested for impairment. Now, for some firms that are downsizing their operations (or downsizing their physician practices), they must be impaired.
In the beginning, there was FAS 13, Accounting for Leases. For lessees, leases were either operating or capital leases. Operating leases were expensed and capital leases, if they passed the test, were put on the balance sheet. To be a capital lease, you had to meet one or more of the four criteria:
FAS 13, which came into effect in 1977, became known as ASC 840 under the codification of the accounting standards. ASC 840 would continue until it was replaced by ASC 842 in 2019 for public companies and 2021 for private companies. ASC 842 was developed over nearly a decade and released in 2016. The main difference between the ASC 840 and 842 was that all operating leases greater than 12 months in term would be recognized on the balance sheet as both an ROU asset and a liability. The Financial Accounting Standards Board had hoped this difference would increase transparency. It certainly had the effect of producing large lease guidance manuals from all the major accounting firms. It also produced a whole new category of assets that potentially need to be tested for impairment, and to be impaired if they failed.
Accounting firm guidance indicates that ROU assets are subject to ASC 360-10 impairment guidance applicable to long-lived assets. ROU assets must be assessed for potential impairment if there is an internal or external indicator, like the decision to vacate a leased space entirely or partially. However, vacating a leased space does not mean that it has been abandoned. Abandonment accounting would only apply if the space were vacated and not used at all (even for storage) without intent to sublease the space.
ASC Topic 360, Property, Plant, and Equipment was issued in August 2001. Because of ASC 842, former operating leases of more than one year are now long-lived assets. These leases are subject to the same asset impairment guidance in ASC 360 that applies to any other property, plant, and equipment assets. ASC 360-10-35-23 states, “For purposes of recognition and measurement of an impairment loss, a long-lived asset or assets shall be grouped with other assets and liabilities at the lowest level for which identifiable cash flows are largely independent of the cash flows of other assets and liabilities.”
An ROU asset has identifiable cash flows based on the lease payments. Testing is performed based on an undiscounted cash flow. During normal business operations, leased space is often vacated as operations are right-sized to the current business environment, creating a need to test for impairment. If the undiscounted cash flow is lower than the carrying amount of the asset, ASC 360 requires the owner of that ROU asset to reduce it to its fair value.
What is the fair value of an ROU asset that is no longer used for the purpose that it was created for through the lease? To answer this question, we must know what market participants would pay for this asset if offered on the market as of the trigger date. For an ROU asset, this would be a sublease and the present value of future sublease payments. Typically, there is a certain period to find a sublease tenant, and then the sublease tenant would occupy the space for the remainder of the primary term. Option periods, that before may have been included in the ROU asset, may be excluded because the landlord may not allow it, or the actual tenant may want to end the lease and not exercise an option. If option periods were included in the ROU asset value originally, the impairment amount would increase. Additionally, the discounting of the sublease payments is done at a market rate not an internal borrowing rate (IBR) used to establish the ROU asset value initially.
During a lease term, an organization’s operations in the leased space can be completely shut down or downsized. Typically, a completely vacated space will fail Step 1 of the testing, as there is no cashflow being generated for the lease space. For a partial vacancy, the Step 1 test becomes even more important, as part of the space is still being utilized. However, our experience is that a partially vacated space will still trigger the need to test for impairment. For a completely vacated lease, there is usually the assumption that the ROU asset must be impaired.
In this new world of ROU assets, health systems need to be wary of physician practice downsizing in a leased space. Downsizing in a leased space could and should trigger impairment testing and possibly adjustment to fair value. The transition to ASC 842 represents a significant shift toward greater transparency in lease accounting, as the new standards provide a clearer picture of an entity’s financial obligations, though they also require more complex accounting. VMG Health has extensive experience assisting health systems and physician practices with this financial reporting exercise.
Written by Isabella Rosman and Tim Spadaro, CFA, CPA/ABV
The following article was published by Becker’s Hospital Review.
Throughout VMG Health’s client base, we are privileged to work with many major players across the physician practices landscape—from solo practitioners and independent physician groups to large platform practices, private equity (PE)–backed physician practice rollups, and those affiliated with large health systems.
VMG Health has been engaged to assist clients in varying capacities associated with transactions, ranging from providing business valuations to financial due diligence (quality of earnings). This insight has provided important visibility into the buyer’s perspective. Further, our work has delved into the operations of practices, including coding and compliance, physician compensation, and strategy work. As a result, our experience offers us a unique glimpse into physician practices and the underlying transaction environment. From our experience, including anecdotal discussions with clients and operators in this space, we’ve outlined a few major headwinds and tailwinds facing physician practice transactions in 2024.
Reimbursement Pressure: Physician practices continue to face reimbursement pressure. In November 2023, the Centers for Medicare & Medicaid Services (CMS) issued its final rule announcing policy changes for Medicare payments under the Physician Fee Schedule (PFS) for 2024. Per CMS, overall payment rates under the PFS will be reduced by 1.25% in 2024, following a 2.0% decline in 2023. Although the overall impact on reimbursement varies across specialties, the rate cuts will continue to suppress margins and put pressure on physician practices. For more information on operational challenges and opportunities with physician practices, see VMG Health’s most recent Physician Alignment Tips & Trends Report.
Persistent Inflation: Wage inflation (largely driven by a tight labor market, an aging physician base, and recruiting challenges) and the rising costs of drug and medical supplies have been persistent. According to the government’s Medicare Economic Index (MEI), medical practice costs are expected to increase by 4.6% in FY 2024 on top of last year’s 3.8% increase. Without reimbursement keeping pace with increasing costs, many physician practices’ profit margins have contracted.
Many physician practices seek out a partner to help combat the daily pressures they face. Practices may benefit from operational synergies by consolidating with a larger organization, particularly if the larger organization has favorable reimbursement rates or anticipated cost savings from duplicate services (back-office employees, external accounting, etc.). In fact, many buy-side clients run a managed care or “black box” analysis to assess the potential rate lift and the resulting practice economics on a post-transaction basis to better inform themselves and their investment committees during diligence. Contact VMG Health’s Revenue Consulting & Analytics team to analyze the potential rate lift on your next deal.
Record High Dry Powder: PE has been an active participant in the physician practice transaction space for many years, as evidenced by recent deal volume presented in the table below. Capital committed to PE funds but not yet deployed (dry powder) is presently at record highs for healthcare services. The current estimate of dry powder earmarked for healthcare services among U.S. headquartered PE managers is approximately $100 billion, according to Pitchbook’s Q4-2023 Healthcare Report. PE funds are regularly searching for a home to deploy this capital and physician practices are a common target.

Source: Irvin Levin, 2024 Health Care Services Acquisition Report
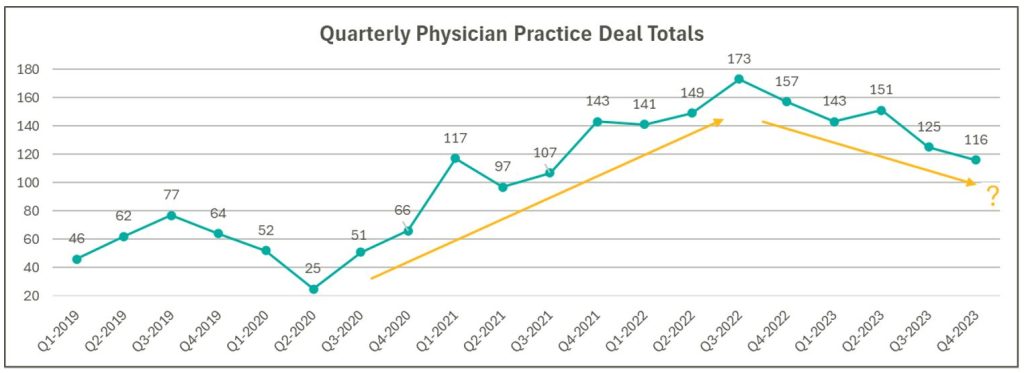
Source: Irvin Levin, Healthcare M&A Quarterly Reports
High Interest Rates: As the pandemic hit, fiscal stimulus and loosened monetary policy led to ultra-low interest rates relative to historical norms and spurred transaction activity. Interest rates began to materially rise throughout 2022, challenging overall transaction activity in the latter part of 2022 and during 2023 as access to capital tightened and the cost of capital increased. The below chart presents interest rates over the period as measured by the 10-year U.S. treasury.
Despite higher rates, transaction activity for physician practices has remained robust relative to pre-pandemic levels. However, there are signs that interest rates are having a lagged effect on deal volume considering the recent downward trend from Q3 2022 through Q4 2023 as observed in the above chart. While this does not necessarily mean that we should expect deal volume to revert to pre-pandemic levels, it does highlight that we have entered a new transaction environment. In this environment, the time to close deals lengthens as sellers digest lower valuation multiples and buyers increase scrutiny during due diligence given an uncertain future macroeconomic landscape. Contact VMG Health’s Financial Due Diligence team for details on how the changing tide is impacting the due diligence process.
At the start of 2024, interest rates remain elevated and volatile with an uncertain path to a normalized level, which continues to serve as a headwind for transaction activity. However, interest rates can change quickly, and the U.S. Federal Reserve has signaled that it will likely be appropriate to begin rate cuts at some point during 2024. Market participants have started anticipating rate cuts from this messaging, which could certainly serve as a tailwind throughout the remaining course of this year and into next.
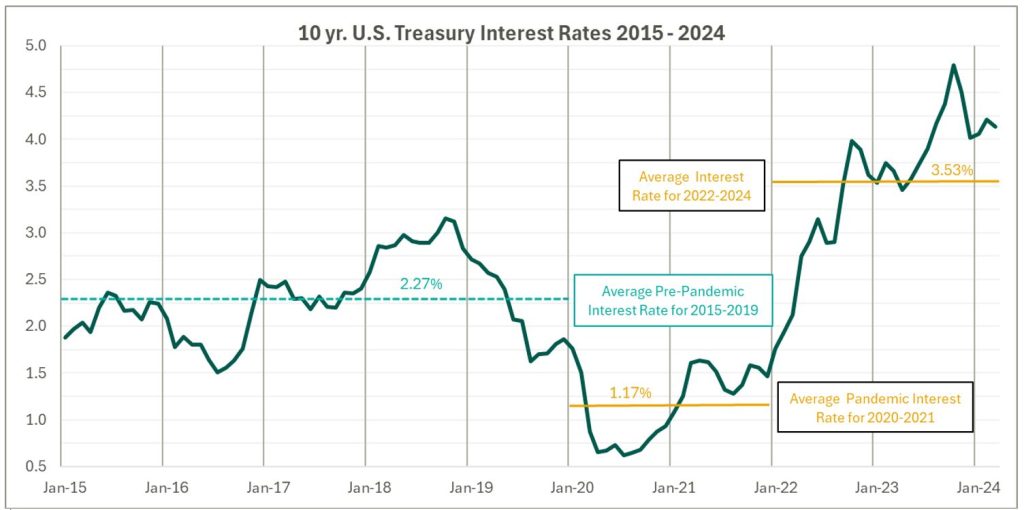
Source: Federal Reserve 10 Year U.S. Treasury Market Data
Regulatory Transaction Oversight: Healthcare consumes a considerable amount of U.S. spending and is expected to continue increasing; CMS’ National Health Expenditure Accounts (NHEA) Healthcare projects healthcare spending to increase from approximately 18.3% of U.S. GDP in 2021 to 19.6% in 2031. Furthermore, it is an election year, with a current U.S. Presidential Administration keenly focused on the rising costs of healthcare. As a result, increased regulatory scrutiny has manifested itself over the ongoing consolidation across healthcare services, particularly within the physician practice space.
This heightened scrutiny is most recently evidenced by the Federal Trade Commission (FTC) suing U.S. Anesthesia Partners, Inc. (USAP), a prominent provider of anesthesia services in Texas, over an alleged “…anticompetitive acquisition spree to suppress competition and unfairly drive-up prices for anesthesiology services.” The FTC also hosted a workshop on March 5, 2024 to assess the public impact of private capital in healthcare. On that same day, the FTC, U.S. Department of Justice (DOJ) and U.S. Department of Health and Human Services (HHS) requested public comments on the effects of transactions involving PE, health systems, and payors on the healthcare providers and ancillary services space.
FTC Focus on Non-compete Agreements: It is not uncommon for physicians to a sign non-compete agreement upon joining a physician practice. The intent of a non-compete agreement, as well as the potential impact, are being hotly debated, with the FTC proposing a rule to ban non-compete clauses. A recent VMG article, Non-Compete Agreements: A Prevailing Quagmire provides details highlighting the arguments and broader implications of non-compete agreements and the proposed ban.
Overall interest in acquiring physician practices remains high, and we don’t expect that to change in the foreseeable future. The dynamics outlined above will likely dictate the path and volume of transactions throughout 2024 and beyond. To read more and stay informed as the year unfolds, please visit VMGHealth.com.
Centers for Medicare & Medicaid Services. Calendar Year (CY) 2024 Medicare Physician Fee Schedule Final Rule. Centers for Medicare & Medicaid Services website. Published November 2, 2023. https://www.cms.gov/newsroom/fact-sheets/calendar-year-cy-2024-medicare-physician-fee-schedule-final-rule
Centers for Medicare & Medicaid Services. CMS Finalizes Physician Payment Rule, Advances Health Equity. Centers for Medicare & Medicaid Services website. Published November 2, 2023. https://www.cms.gov/newsroom/press-releases/cms-finalizes-physician-payment-rule-advances-health-equity
Landi H. Physician groups decry finalized Medicare payment cuts as 2024 expenses rise. FierceHealthcare. Published November 3, 2023. https://www.fiercehealthcare.com/providers/physician-groups-decry-finalized-medicare-payment-cuts-2024-expenses-rise
American Medical Association. Only Cure for Medicare Payment Mess: Wholesale Reform. American Medical Association website. https://www.ama-assn.org/about/leadership/only-cure-medicare-payment-mess-wholesale-reform#:~:text=To%20put%20this%20into%20perspective,top%20of%20last%20year’s%203.8%25https://www.ama-assn.org/about/leadership/only-cure-medicare-payment-mess-wholesale-reform#:~:text=To%20put%20this%20into%20perspective,top%20of%20last%20year’s%203.8%25
VMG Health. 2023 Healthcare M&A Report. Published [publication date not provided]. https://vmghealth.com/2023-healthcare-ma-report/ https://vmghealth.com/2023-healthcare-ma-report/
PitchBook. Q4 2023 Healthcare Services Report. Published [publication date not provided]. https://pitchbook.com/news/reports/q4-2023-healthcare-services-report
Reuters. Fed’s Powell Set Election-Year Stage with Testimony on Rate Cuts, Inflation. Reuters website. Published March 6, 2024. https://www.reuters.com/markets/us/feds-powell-set-election-year-stage-with-testimony-rate-cuts-inflation-2024-03-06/
Centers for Medicare & Medicaid Services. National Health Expenditure Fact Sheet. Centers for Medicare & Medicaid Services website. Published [publication date not provided]. https://www.cms.gov/data-research/statistics-trends-and-reports/national-health-expenditure-data/nhe-fact-sheet
Federal Trade Commission. FTC Challenges Private Equity Firm’s Scheme to Suppress Competition in Anesthesiology Practices Across the United States. Federal Trade Commission website. Published September [publication date not provided], 2023. https://www.ftc.gov/news-events/news/press-releases/2023/09/ftc-challenges-private-equity-firms-scheme-suppress-competition-anesthesiology-practices-across
McDermott Will & Emery LLP. Top Takeaways: FTC Hosts Workshop, Solicits Public Comment on Private Equity in Healthcare. McDermott Will & Emery LLP website. Published [publication date not provided]. https://www.mwe.com/pdf/top-takeaways-ftc-hosts-workshop-solicits-public-comment-on-pe-in-healthcare/
Aguirre I. Non-Compete Agreements: A Prevailing Quagmire. VMG Health website. Published [publication date not provided]. https://vmghealth.com/thought-leadership/blog/non-compete-agreements-a-prevailing-quagmire/https://vmghealth.com/thought-leadership/blog/non-compete-agreements-a-prevailing-quagmire/https://vmghealth.com/thought-leadership/blog/non-compete-agreements-a-prevailing-quagmire/
Written by Holden Godat, CVA; Taylor Harville; and Trent Fritzsche
In the traditional sense, call coverage was a mutual obligation for physicians in addition to their clinical duties. Many physicians would provide uncompensated call coverage to a hospital to secure hospital privileges, build their own practices, and ensure proper patient care with specialized services when needed. Due to the passage of the Emergency Medical Treatment and Labor Act of 1986 (EMTALA), which requires Medicare-participating hospitals to provide sufficient levels of physician coverage to their emergency departments, hospitals are facing difficult task of determining the appropriate level of physician coverage. Several factors—including physician work-life balance, growing uninsured patient populations, increasing professional liability insurance costs, and a declining supply of physicians—have contributed to a decline in uncompensated call coverage and a significant increase in compensated call coverage stipends.
The healthcare sector has seen an increasingly high demand for physicians over the past decade, and projections show that there is a shortfall in supply that does not appear to be going away any time soon. According to The Complexities of Physician Supply and Demand: Projections From 2019 to 2034, a report released by the Association of American Medical Colleges (AAMC), “the U.S. faces a projected shortage of between 37,800 and 124,000 physicians within 12 years.” Such a significant shortage of physicians has left health systems and hospitals with few options to remedy the potential lapse in patient care. To combat this problem, many care organizations have turned to concurrent call coverage arrangements as a potential, efficient solution. As these arrangements become more common, it is important to ensure organizations are compliant from a fair market value perspective.
Concurrent call coverage is an arrangement whereby a physician may provide on-call coverage services to multiple locations and/or to multiple specialty panels simultaneously. These arrangements seek to provide an even distribution of work and ensure patients receive a sufficient level of care. Although concurrent call arrangements help to provide an efficient continuum of care, there are a few important considerations to weigh with each arrangement. Setting fair market value physician compensation for any concurrent call coverage arrangement brings forth a new set of difficulties and regulatory scrutiny that must be properly addressed.
In determining appropriate compensation for a call coverage shift, it is important to establish the actual burden of being on call. Factors impacting call burden include:
When determining appropriate compensation in a concurrent call coverage arrangement, it is important to consider the combined burden of call.
An important value driver for any call coverage arrangement is understanding the required specialty needed to perform the coverage. Typically, concurrent call arrangements are required due to the need for one group of specialized physicians to provide coverage for two or more unique, call coverage panels. Due to the nature of these arrangements, the physicians providing the concurrent services must be able to effectively provide both panels of coverage. Select the appropriate specialty for the subject services to ensure the physician can adequately cover multiple panels and to ensure the physician is appropriately compensated for the services being provided.
In a typical call coverage arrangement, the ultimate compensation rate contemplates the unrestricted availability of a physician for a given amount of time. When stacking panels or facilities to be covered in a concurrent setting, be aware of this availability and ensure the overall compensation does not account for the same time twice. Since physician availability is already being covered by an initial panel, stacking compensation related to additional panels could create overpayment concerns. Furthermore, concurrent arrangements often create additional efficiencies for an emergency department that should be reflected in the ultimate compensation. To ensure providers are appropriately compensated for the time they are providing coverage, it is common to use a discounted coverage rate on top of the existing stipend to account for the incremental coverage of additional panels or facilities.
To illustrate this point, consider a hypothetical Panel A and Panel B. Independently, Panel A and Panel B may be worth $500 per 24-hour shift and $600 per 24-hour shift, respectively. That does not necessarily mean that the concurrent coverage of Panel A and Panel B equals $1,100 per 24-hour shift. Each panel independently contemplates 24 hours of availability. When combined, there must be assurances that the availability of the physician is not compensated twice.
One of the last and most critical pieces of setting up any concurrent call coverage arrangement is to fully understand the compensation terms for the services. While these do not drive value for the services in the way other factors might, the specific terms relating to the compensation are critical to understand in providing an appropriate valuation. Factors like whether the physician is employed or an independent contractor, understanding who retains the rights for billing and collection under each individual arrangement, and a thorough review of whether providers receive production credit toward outside employment agreements are all vital pieces of structure to consider when evaluating a concurrent call coverage arrangement.
The many unique considerations of concurrent call arrangements, such as establishing the appropriate burden of call, determining the correct specialty for services being provided, contemplating physician availability in a shift, and sources of compensation, often make these arrangements tricky to structure in a compliant manner. Although it may seem as simple as adding two shifts together, this is a major misconception. Increased scrutiny from regulators and the tricky healthcare landscape has made it more important than ever to obtain third-party fair market value guidance to ensure you meet a compliant call compensation system.
Association of American Medical Colleges. (2021). The Complexities of Physician Supply and Demand: Projections from 2019 to 2034. Retrieved from https://www.aamc.org/media/54681/download ssociation of American Medical Colleges. (2021). The Complexities of Physician Supply and Demand: Projections from 2019 to 2034. Retrieved from https://www.aamc.org/media/54681/download
Written by Christa Shephard
VMG Health’s own Lukas Recio joined Scott Becker on the Becker Private Equity & Business podcast to discuss the rise in private equity acquisitions in physician practices. Lukas, who is a leader in VMG Health’s Financial Due Diligence division, broke down the key factors driving the surge in private equity investments and its impact on healthcare professionals.
Private equity companies’ interest in the healthcare sector has flourished over the past 15 years, and private equity purchases of physician practices have increased by over 600% from 2012 to 2022. That statistic, Lukas says, reflects the “growth of healthcare spend as a percentage of GDP… [In the last five years], we’ve really seen the dollars, allocated specifically to investment in the healthcare space, really take off alongside those investment figures.”
Those changes and trends already taking place were exacerbated by 2020’s global pandemic. “2020, 2021, and 2022, we really saw deals happening at a frenetic pace,” Lukas says. In the wake of the global pandemic, the healthcare industry experienced a seismic shift in priorities. With the urgent need to meet unprecedented demand for care, the prevailing mentality became “grow at all costs.” Against this backdrop, healthcare buyers and sellers began requesting VMG Health’s services earlier in the transaction process than usual.
However, healthcare margins are growing thinner thanks to inflation and increasing operational costs, forcing organizations to navigate a landscape where growth opportunities must be balanced against heightened regulatory limitations. “When we think about deals themselves,” Lukas says, “2023 was definitely a down year as far as deal volume. But what we found was that quality assets in attractive markets were still experiencing healthy multiples.”
Despite the challenges posed by regulatory scrutiny, there are still ample opportunities for innovation and expansion. However, achieving sustainable growth in this environment requires a strategic approach that emphasizes compliance with evolving regulations. States are now noticing that anti-trust and access to healthcare services are not currently aligned, which has prompted some states to begin reviewing healthcare transactions.
Lukas explains, “You can easily imagine a world where it becomes more difficult to execute an investment in these states that are imposing these regulatory reviews because, in some cases, they could take months review the information before they let you know whether or not it’s been green-lighted.”
On top of these dynamic changes, Lukas urges listeners, especially those in physician-owned practices, not to view private equity partnerships as a silver bullet: “Private equity can be a really great partner, but there are also things that you need to consider that are going to have their challenges—as with any other relationship that you’re going to be in, whether it’s personal or professional.”
For more of this insightful discussion, listen to the episode, The Rise of Private Equity in Healthcare: Challenges, Opportunities, and Regulations. VMG Health is dedicated to helping healthcare entities big and small through their transaction, strategy, and compliance needs. Contact our industry experts or visit our website for more information.
Authors