Organizations are revisiting medical group strategy and physician alignment in the face of private equity investment, growing medical group losses, and a decline in overall performance. Approaches on how to address medical group performance vary but can broadly be categorized as performance optimization (i.e., enhancing the current alignment vehicle) or pursuing a structure change to an existing model that improves sustainability. In lieu of performance-focused optimization, organizations are increasingly considering whether there are alignment models that are more sustainable and functional than traditional employment given the price transparency and site neutrality trends. The following article explores the evaluation of current medical group performance.
More health systems are taking a multi-faceted approach to maximize medical group performance. The exponential growth in physician and advanced practice provider employment and the growth in reimbursement tied to cost, quality, and access have heightened the importance of medical group strategy. However, many organizations continue to experience underperformance across several domains (cost, growth, access, etc.), and attempts to improve performance have stalled or been met with significant resistance. In most cases, the definition of performance is too narrow to identify the actionable strategies necessary for improvement.
Measurement of medical group performance and provider efficiency has historically been based on investment or operating loss per physician. In VMG Health’s experience, questions pertaining to a medical group optimization are complicated and require consideration of several indicators. Commonly used measures like investment per physician and provider FTE are helpful but can be misconstrued without proper context due to a myriad of factors. Some of these factors include but are not limited to medical group provider composition (e.g., primary care, hospital-based, pediatric subspecialties, etc.), medical group structure, care model, payor contracting strategy, overhead allocation, and payor mix.
To truly understand medical group performance, performance should be evaluated across a series of clinical, financial, operating, and community domains to ensure the group’s value is fully realized and understood. Focusing on only one or two aspects of medical group activity can result in an overly narrow and often inaccurate assessment of medical group value. The approach to assessing the economic sustainability/affordability of a medical group should be based on a complete picture of the medical group’s impact on health system financial performance and should not be limited to a simple financial review of practice operations.
It is critically important to consider how the medical group functions, performs, and contributes to the health system in several areas including: 1) growth trajectory and overall affordability, 2) engagement of the provider group, 3) data availability and reporting, 4) provider care model and compensation, and 5) provider governance. Strong performance across one or two domains is not indicative of sustainability and category weighting is required to acknowledge the relative importance of each.
Each of the domains can be evaluated and indexed across several factors to essentially score the medical group’s overall health and determine whether financial, strategic, and clinical alignment requires modification for sustainability.
Performance Domains
Affordability
The affordability domain evaluates the extent to which the magnitude of the hospital or health system’s investment in the medical group is appropriate given the size, operating performance, structure, and breadth. The domain also considers whether the investment is financially sustainable for the organization when tested against the parent organization’s size, operating performance, and market conditions.
VMG uses a wide array of metrics to measure affordability, including but not limited to metrics that measure the enterprise-wide impact of employing physicians. Depending on organizational compliance and internal firewalls related to information sharing, our preference is to develop management models that combine enterprise-wide economic contribution to the underlying net investment in the professional practice.
Without a common understating of enterprise-wide performance, medical groups are all too often in the position of defending their status in a health system. Further, our experience suggests there is increased dissatisfaction among providers and operators.
Engagement
The degree to which medical group infrastructure and policies support physician-to-physician and physician to group accountability. The engagement domain evaluates whether policies support the individual or the collective, and to what extent the governance structures create peer accountability and a set of medical group values that align with health system goals and objectives.
Data Reporting
The ability of the health system and the medical group to track, report (internally and externally), and act on data is essential. Supportive data systems, with actionable dashboards and reports for providers, are deployed to maximize the utility of the group practice. Medical groups lacking effective data tracking, reporting, and management capabilities are extremely limited.
Care Model
Exponential growth exists in patient care delivery in non-traditional settings and by care teams versus individual providers. What policies, procedures, and models have been developed and implemented that support care innovation, efficiency, and patient access? How well developed are virtual protocols and how mature is the medical group’s thinking about advanced practice provider utilization and deployment? Does this translate into aligned remunerations systems for providers?
Governance
The governance domain assesses how decisions pertaining to medical group management and operations are made as well as who is making the decision. There is not a one size fits all approach to organizational structure and decision making. What structures and policies support provider-led management and decision-making? To what degree are service line management and medical group operations integrated to assure efficient and effective operations.
Conclusion
Completing an internal assessment across these domains will benefit the medical group and the broader health system clinical enterprise. Completing this type of assessment generally assumes arrangements are fair market value and commercially reasonable, however, there is some inherent connectedness between affordability and internal compliance standards. Since the inception of the Stark Law in the late 1980s, there have been concerns about the commercial reasonableness of physician practices that lose money. While most operators could rationalize why practice in a health system model may lose money, there have been decades of discomfort with the strict interpretation of the Stark Law. In the most recent changes to Stark, there has been a clarification noting that the determination of an arrangement’s commercial reasonableness does not turn on whether the arrangement is profitable. Under the statute, there are several examples of community need, EMTALA, charity care, and quality that may support underlying commercial reasonableness despite practice losses. Nevertheless, assuring internal compliance policies and oversight are contemporary with the current law is paramount.
In VMG Health’s experience, questioning medical group sustainability is both essential and complicated. Many organizations struggle with assessing current performance in a way that provides a comprehensive view and provides actionable strategies for improvement. It is critical this work effort is organized in the right way since a simple benchmark exercise is largely ineffective in driving change.
Five Key Takeaways From the Public Healthcare Operators in 2021
February 9, 2022
By: Olivia Chambers, Savanna Dinkel, CFA, Madison Higgins, Madeline Noble, and Ayla Saglik
As we enter 2022, we look back to reflect on the major trends that shaped the healthcare sector over the past year. COVID-19 continued to be a major player throughout 2021, forcing healthcare systems to adapt to new variants, rising labor pressures, financial activity, and new regulations. Despite these challenges, the sector remains optimistic and ready to adapt.
Here are five key takeaways we believe defined the healthcare sector over the past year:
Financial Recovery From Pandemic
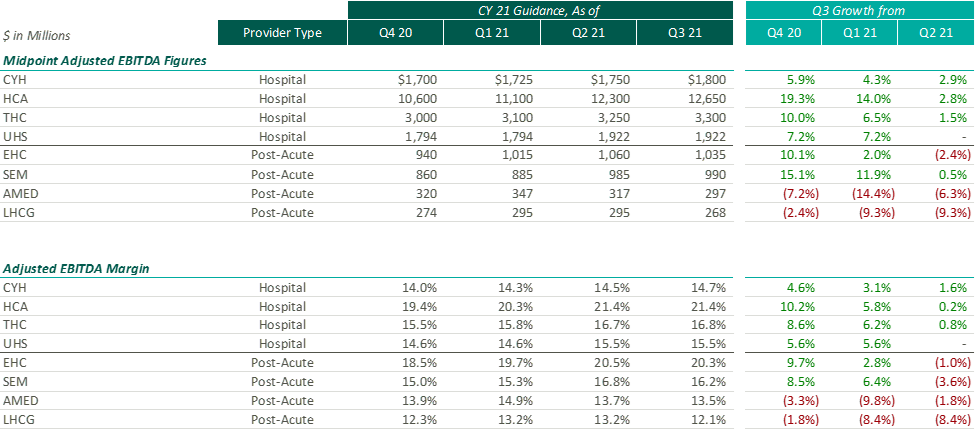
After the Q2 earnings season, VMG Health released an article analyzing post-COVID healthcare operator guidance. Generally, we found that healthcare operators were optimistic about the recovery of their revenue and adjusted EBITDA metrics over pre-pandemic levels, with most operators increasing their FY 2021 guidance with each subsequent reporting period.
While optimism for recovery to pre-pandemic levels remains, it appears that the post-acute operators have tempered some of their recent growth expectations. Based on disclosures of the public operators, the recent resurgence of COVID-19 through the Omicron variant has caused additional strain on the post-acute sector. During the J.P. Morgan Healthcare Conference, Universal Health Services (“UHS”) CFO, Steve Filton noted that the company was struggling to find providers who can accept COVID patients once they are ready to be discharged from the hospital.
Post-acute providers appear to have been hit especially hard by the recent labor shortages in the healthcare industry (discussed further below). As compared to the hospital operators, the financial performance of these post-acute providers has been affected disproportionally by the labor shortages. While hospital operators have been receiving additional reimbursement for COVID patients, helping to offset a portion of the increased staffing costs, the post-acute care providers have not received a similar subsidy.
Due to these recent pressures, Select Medical Holdings Corporation (“SEM”) released an expected earnings announcement in advance of the actual results, in which it noted “the unpredictable effects of the COVID-19 pandemic, including the duration and extent of disruption on Select Medical’s operations and increases to our labor costs, creates uncertainties about Select Medical’s future operating results and financial condition.”
While we have seen increasing optimism by healthcare providers over the past few quarters, the recent disclosures from the post-acute sector illustrate that the effects of COVID continue to ripple through the healthcare sector. With the fourth quarter results being released over the coming weeks (HCA and Encompass recently released), it will be interesting to hear if other sectors report similar headwinds.
Rising Labor Expense: Potential Impact to 2022 Performance
Healthcare labor expenses continued to exceed historical levels with a 12.6% year-over-year increase based on a recent analysis of over 900 hospitals. Labor expenses grew at a faster rate than the number of clinical hours worked, which supports the notion that rising labor costs were not due to increased staffing levels but rather due to labor shortages driving higher pay to improve employee retention. Part of the labor shortage can be credited to the surge of Delta and Omicron variants in the second half of 2021 that resulted in high volumes of quarantined staff and a reliance on costly contract labor and travel nurses. At the Bank of America December 2021 Home Care Conference, LHC Group announced a decrease in quarantined staff throughout Q4 from a high of 4% down to 1% in December. This indicates that the labor market issues will see some improvement as health systems’ dependence on pandemic-related contract labor declines as COVID-19 surges dissipate going into 2022.
A more concerning challenge faced by all sectors was the shrinking workforce, coined the “Great Resignation.” The Bureau of Labor Statistics reported healthcare and social assistance workers had the second highest quit rate in November 2021 at 6.4% due to increasingly high levels of professional burnout. The waning labor force has prompted companies to offer additional incentives such as shift and retention bonuses. For example, HCA reported during Q3 a 10-12% annual increase in FTEs being in the premium pay categories. Many large public players have voiced an anticipation of continued high levels of premium pay, competitive bases, and higher annual wage inflation to attract and maintain adequate staffing levels in 2022.
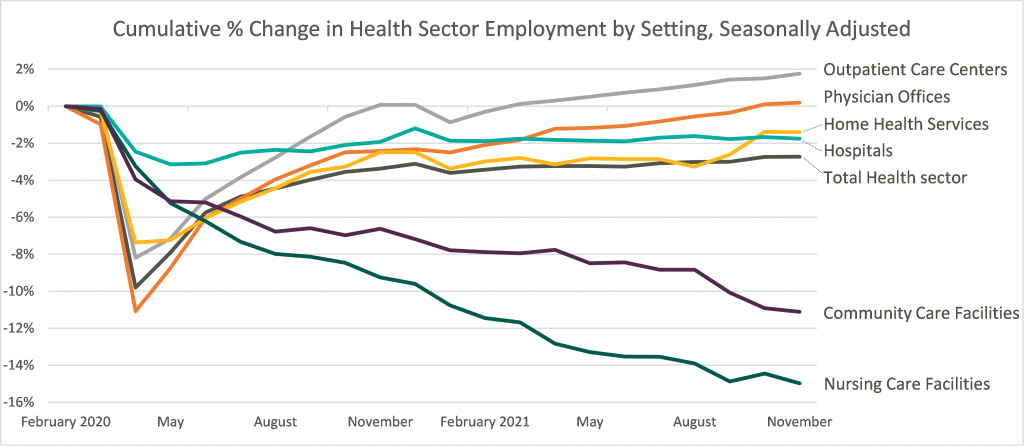
Leaders in the industry have announced initiatives to decrease labor pressure primarily by focusing on recruiting and retention to bounce back to pre-pandemic levels of employment. With a heightened focus on attracting and maintaining adequate levels of hired staff as opposed to contract labor, it appears the overall industry expectation for 2022 is that labor costs will likely decrease compared to 2021 although not to pre-pandemic levels. The chart below shows the percentage change in employment across the healthcare sector from the Bureau of Labor Statistics Job Openings & Labor Turnover Survey from February 2020 to November 2021. This highlights the steady recovery toward pre-pandemic staffing levels for outpatient care and physician offices, the continued employment challenges in home health and hospital settings, and the notable struggle for community and nursing care facilities to return to a state of normalcy.
Robust M&A Activity
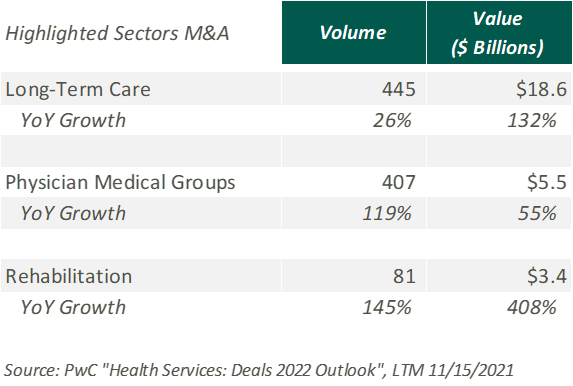
Deal activity within the healthcare sector was strong in 2021 with industry-specific multiples that reached or in many cases exceeded 2019 levels. Experiencing a noticeable rebound from 2020, volume and value of deals grew by substantial margins on a year-over-year basis. Deal volume in the health services industry rose by 56% while value rose 227% in the TTM 11/15/21 period. Long-term care led all sectors with the highest volume of deals, as seen historically, and continues to remain a hot spot in the transaction space. Similarly, physician medical groups and the rehabilitation sector experienced the largest growth transaction volumes year-over-year.
Physician medical groups have received vast interest in physician employment from private equity firms, new-age value-based care organizations, services arms of managed care giants (Optum, Neue Health), and health systems. This, coupled with independent physician group operating challenges from COVID-19 related volume impact and looming Centers for Medicare and Medicaid Services (CMS) cuts, is creating a robust transaction environment that is expected to continue during 2022. For the rehabilitation sector, strong demographic tailwind, along with the lifted CON moratorium in Florida and continued joint venture interest between health systems and strong rehabilitation operators (Select, Kindred, Encompass), has resulted in material deal volume in the space.
Hospitals and health systems were the only sector to see a decline in volume of deals, down 26% from the previous year. Despite the decline, the total transaction size of deals only dropped slightly year over year, indicating larger deal-size on a per-transaction basis. The acceleration of megadeals taking place, the shifted focus on scale, and the diversification of their business models all drove average total size per deal higher than seen before in 2021.
Price Transparency
Effective January 1, 2021, the Centers for Medicare and Medicaid Services (CMS) implemented a price transparency rule requiring hospitals in the United States to provide accessible pricing information to patients about the cost of the care they may receive. Hospitals must display negotiated rates for all items and services, in a machine-readable format, so that patients can compare prices before arriving at the hospital.
Though, in July 2021, a study was published by PatientsRightsAdvocate.org detailing that a vast majority of hospitals were not compliant with the new rule. At the release of the study, the penalty for non-compliant hospitals was $300 per hospital, per day. While many patients advocate for CMS to stiffen penalties for non-compliant hospitals, healthcare professionals argue against the rule, stating CMS did not provide enough clarity on what the rule should entail.
A vice president of a large U.S. health system discussed the ambiguities around the rule with Fierce Healthcare. “One interpretation is you simply publish your rate schedule – whatever your rate exhibits are in your contracts, publish that and that’s compliant. Another one is to summarize these [CMS] packages [and] what your negotiated charges are.” For many health systems, the resources required to implement their rates in a machine-readable format far outweigh the penalty of remaining non-compliant. The VP stated that he believes many hospitals already provide their rates in a clear, understandable way, but the rule’s lack of clarity and the requirement for a machine-readable format make compliance difficult and costly.
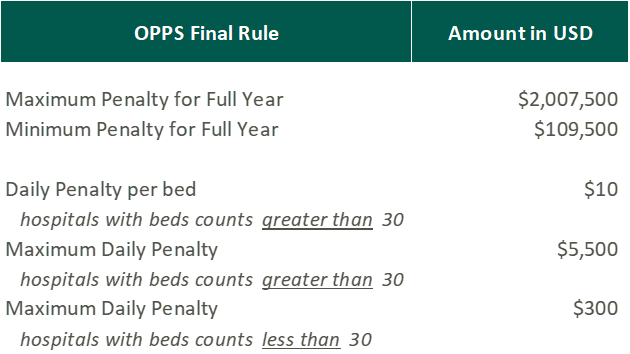
In November 2021, CMS released the 2022 Outpatient Prospective Payment System (OPPS)/Ambulatory Surgery Center (ASC) Payment System final rule (OPPS Final Rule). Within this rule, CMS increased penalties for hospitals that are not compliant with the price transparency rules and removed barriers for patients accessing online pricing information.
While the Final Rule may be beneficial for patients, Stacey Hughes, Executive Vice President for the American Hospital Association (AHA), states that they “are very concerned about the significant increase in penalties for non-compliance with the hospital price transparency rule, particularly in light of the many demands place on hospitals over the past 18 months, including both responding to COVID-19, as well as preparing to implement additional, overlapping price transparency policies.”
The new penalties, visible in the chart above, went into effect on January 1, 2022.
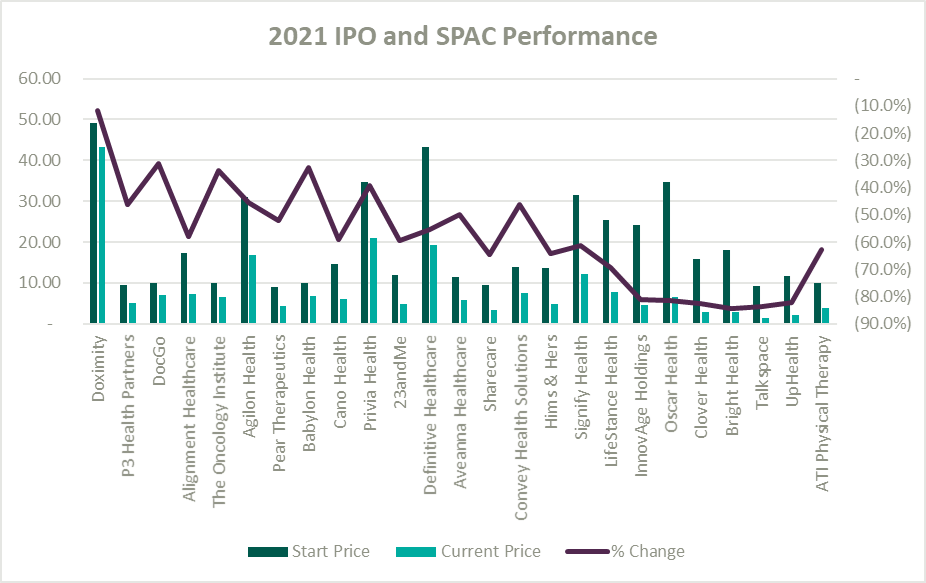
IPO and SPAC Stock Price Performance
A record number of health and health services companies went public during 2021 by way of SPAC or IPO. Rebecca Springer, a private equity analyst with PitchBook noted, “The multiples in public markets are very, very strong right now, so you can get, all else equal, a better return on your investment if you go public with your company rather than selling it to a strategic investor.”
Unfortunately, while the stock market might be performing well, the recently public healthcare operators have not faired as well since their initial offerings. The Healthy Muse Health Tech Index (“HTI”) generally underperformed the overall performance of the stock market, with the majority of the players finishing in red; the HTI declined 35% as opposed to the 27% gain for the S&P 500 during 2021. The public markets seemed like a perfect place for an exit strategy given the multiples observed in the public markets. All recent entrants finished the year below the original IPO price and while the reasons for the price declines varied it is clear the public markets are less forgiving with valuations if an organization does not achieve expectations.
Conclusion
Overall, the healthcare sector experienced highs and lows during 2021 as it continued to navigate a post-COVID world. As pandemic pressures continue into 2022, healthcare institutions will have to keep a close eye on staffing costs and abide by new regulations. Despite these challenges, the appetite for M&A transactions and market participation in the sector remains strong. We look forward to a new year of challenges, wins, and continued changes in this interesting industry.