

How to Optimize the Value of Advanced Practice Providers: Workflow, Coding, & Compliance
Christa Shephard
May 8, 2024

Written by Ashleigh Surgeon and Caroline Dean, CVA
In recent years, the anesthesiology market has seen many changes in compensation trends and practice models. With continued provider shortages and a growing demand for anesthesia services, providers in this specialty are becoming increasingly valuable. Specifically, certified registered nurse anesthetists (CRNAs) have become some of the most sought-after advanced practice providers in the industry, leading to significant increases in compensation for these providers. In addition, hospitals and health systems are shifting to expanded CRNA utilization as opposed to physicians due to the ongoing push for cost-effective treatment options. Understanding the factors impacting CRNA compensation trends is crucial to anticipating and addressing potential challenges in the pursuit of CRNA arrangements.
According to Becker’s ASC Review, the anesthesiology market is facing a projected shortage of 12,500 providers by 2033. As basic economic principle rules, a decrease in supply of any healthcare provider drives demand upward, forcing costs of anesthesia services and provider compensation upward as well. In 2023, median compensation for CRNAs in the United States was reported at $221,300, an increase in total cash compensation of 11.3% from 2022.
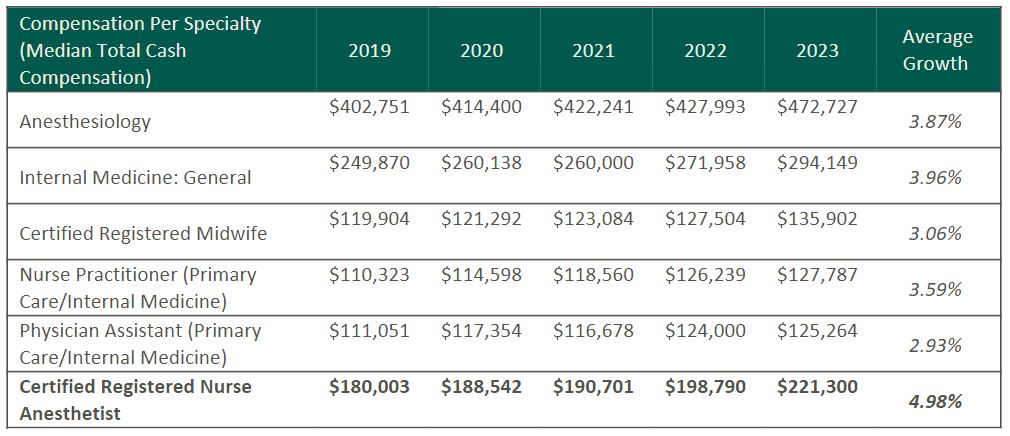
Source: Sullivan, Cotter and Associates, Inc. 2019-2023 Physician Compensation and Productivity Survey and 2019-2023 Advanced Practice Provider Compensation and Productivity Survey
This is a significant rise as compared to general physician assistants and nurse practitioners, who saw only a 5% increase on average from 2022 to 2023. This level of compensation is mostly accredited to the additional education and training required for the certification, as well as the increased risk and level of independence associated with their standard practice.
To receive certification from the National Board of Certification and Recertification for Nurse Anesthetists (NBCRNA), a candidate must first complete registered nurse training and the appropriate clinical experience. Then CRNAs complete a Nurse Anesthesia program, which grants the candidate a master’s degree. Program length varies from two to four years and includes a clinical experience requirement in addition to coursework. In total, the process of becoming a certified nurse anesthetist takes at least seven years to complete, surpassing a standard registered nurse by an average of three years in education and experience. As with any advanced degree, CRNAs often receive increased compensation due to a higher level of education and training than a standard practicing registered nurse.
Because of their advanced training, CRNAs have an increased level of independence in a clinical setting. Though anesthesiologists may manage high-acuity surgeries, CRNAs in many states and facilities may be responsible for primary patient care, including informing the patient, completing examinations, developing pain management plans, prescribing medications, administering and monitoring medications, and responding to adverse reactions or emergencies. A CRNA’s involvement in responsibility for patient care puts the provider in higher-risk scenarios when compared to other registered nurse professions. In 23 states, CRNAs may operate independently without the supervision of a medical doctorate. CRNAs are also typically the sole anesthesia provider in many plastic surgery centers, eye surgery centers, dental surgery centers, and gastrointestinal surgery centers. Additionally, in the U.S., many facilities in rural areas with limited healthcare providers use CRNAs for routine surgical services in the specialties of general surgery, obstetrics, and pain management. According to the American Association of Nurse Anesthesiology, CRNAs comprise over 80% of anesthesia providers in rural areas.
Though CRNAs’ level of autonomy may vary depending on location, state government regulations and a facility’s scope of services, the importance of CRNAs is often constant across markets. With their ability to operate nearly identically to an anesthesiologist in most general cases, CRNAs also incur the same level of risk as physicians and the increased costs associated with such risk. Increased utilization, higher malpractice insurance expenses, and reimbursement difficulties play a large role in these higher costs for CRNAs, which create a competitive environment amongst healthcare systems when considering compensation in recruitment efforts.
Historically, anesthesiology services have been provided by a mix of physicians and CRNAs together. However, with continued physician shortages and health systems and facilities seeking more profitable provider options, CRNA-heavy care team models have risen to the forefront. In a care team model, one physician typically supervises between one and four CRNAs, allowing the facilities to rely on CRNAs as opposed to more expensive physician coverage. As CRNA utilization grows, so grows CRNA compensation as facilities are forced to offer more lucrative recruitment packages, inclusive of commencement bonuses and higher-dollar salaries to retain top CRNA talent and stay competitive. In addition, as many U.S. lawmakers are pushing to expand the scope of CRNA independent practice, it is likely CRNA utilization will continue to increase.
Additionally, according to the Centers of Medicare and Medicaid Services (CMS), average CRNA malpractice insurance in 2024 is $5,968—nearly 50% higher than the average for all other midlevel providers. This is most likely attributed to the large number of CRNAs practicing independently, and therefore solely liable for any case complications. The most common malpractice claims involving CRNAs include subpar performance during procedures, poor patient monitoring and improper positioning. All three of these claims are extremely serious and can result in recovery complications, severe injury, and even death. As a result, CRNAs face higher medical malpractice premiums than providers not solely responsible for a patient’s care. Health systems and facilities must consider this expense when employing CRNAs’ services, whether they reimburse, subsidize, or include the expense in compensation.
Lastly, anesthesia has seen a downward trend in reimbursement based on the CMS Medicare Physician Fee Schedules as Anesthesia Base Units (ASAs) reimbursement have decreased from $22.27 per unit in 2019 to $20.44 in 2024. In the states where CRNAs can practice independently, CMS will reimburse services provided by CRNAs at these rates. This reduction in reimbursement can impact a provider’s ability to collect sufficient revenue based on professional services alone, often requiring additional compensation or subsidization from a facility to sustain operational costs. This issue is commonly present for providers in a community highly comprised of governmental payors. Public payor rates, such as Medicare and Medicaid, reimburse medical services at a significantly lower rate than private insurance, less than 28% of median commercial rates in 2022. As such, facilities serving a population with a significant amount of governmental insured patients must offer providers a compensation plan not only to offset the practice’s operational costs, but also as an alluring salary serving as incentive to relocate to the market. With a CRNA shortage looming, these underserved areas must stay competitive in compensation offers to recruit and retain the essential services CRNAs provide to the community. This level of competition contributes largely to the upward drive of average CRNA compensation, as majority of the CRNAs are operating in the U.S. in lower-income markets.
In summary, the CRNA compensation market will continue to evolve in the coming years, and health systems and facilities must understand and address these changes to capitalize on the benefits associated with CRNA utilization. VMG Health is frequently engaged to provide fair market value and consultative services to ensure CRNA compensation packages are both competitive and compliant with government regulations. Utilizing in-depth analyses of revenue, market data, costs and recruitment expenditures, and expert experience in similar arrangements, VMG Health can assist in navigating the increasingly important CRNA market.
Becker’s ASC Review. (June 28, 2022). Weathering the storm in Anesthesiology: making the business case and demonstrating the value of Anesthesiology. https://www.beckersasc.com/asc-news/weathering-the-storm-in-anesthesiology-making-the-business-case-and-demonstrating-the-value-of-anesthesiology.html
Sullivan Cotter. 2019-2023 Physician Compensation and Productivity Survey and 2019-2023 Advanced Practice Provider Compensation and Productivity Survey
O’Brien, E. Health eCareers. (January 23, 2023). How Long is CRNA School? https://www.healthecareers.com/career-resources/nurse-credentialing-and-education/how-long-is-crna-school
Munday, R. Nurse Journal. (November 16, 2023). CRNA Supervision Requirements by State. https://nursejournal.org/nurse-anesthetist/crna-supervision-requirements/
AMN Healthcare. (June 23, 2023). CRNAs Practice Updates and Trends. https://www.amnhealthcare.com/blog/physician/locums/crnas-practice-updates-and-trends/
Centers for Medicare & Medicaid Services. 2019-2024 Anesthesia Conversion Factors. https://www.cms.gov/medicare/payment/fee-schedules/physician/anesthesiologists-center
Baxter Pro. (May 6, 2022). The 3 Most Common CRNA Malpractice Claims. https://baxterpro.com/the-3-most-common-crna-malpractice-claims/#:~:text=Do%20CRNAs%20Get%20Sued%20More,the%20benefits%20of%20the%20job
American Society of Anesthesiologists. (December 2022). Anesthesia Payment Basics Series: #3 Payment, Conversion Factors, Modifiers. https://www.asahq.org/quality-and-practice-management/managing-your-practice/timely-topics-in-payment-and-practice-management/anesthesia-payment-basics-series-3-payment-conversion-factors-modifiers#:~:text=In%202022%2C%20the%20Medicare%20anesthesia,conversion%20factor%20survey%20was%20%2478.00.&text=Overall%2C%20Medicare%20was%20paying%20less,commercial%20rates%20in%20that%20year
Liao. C, et. all. Semantic Scholar (2015). Geographical Imbalance of Anesthesia Providers and its Impact on the Uninsured and Vulnerable Populations. https://www.semanticscholar.org/paper/Geographical-Imbalance-of-Anesthesia-Providers-and-Liao-Quraishi/77112f1f7ca09a86142b4f5e7c065ae9a073dec2
At VMG Health, we’re dedicated to sharing our knowledge. Our experts present at in-person conferences and virtual webinars to bring you the latest compliance, strategy, and transaction insight. Sit down with our in-house experts in this blog series, where we unpack the five key takeaways from our latest speaking engagements.
I spoke with King and Spalding attorney Kim Roeder on different, hot-button issues that arise when structuring and valuing different value-based arrangements. It started off as a presentation of different case studies and focused on what Roeder has encountered from a legal perspective and what I have encountered from a valuation perspective. We often receive questions when it comes to structure or even value drivers, and we wanted to present solutions to what we saw or clients struggling with so that they could develop a better understanding of them.
The focus on the metrics themselves and how carefully they need to be considered seemed to be the most surprising. Recent regulations have been really focused on metrics, and that’s what we get the most questions about. I think our audience was also surprised to learn that Kim had experienced those questions as well, and metrics aren’t just a consideration on the valuation perspective. Both legal and valuation perspectives must carefully consider metrics.
Our presentation was a very pragmatic way of illustrating six key issues that often come up during valuation. It’s a great resource for healthcare leaders to reference as they go through and check the boxes to ensure they have thought through all of the considerations that we often see as eleventh-hour issues.
I co-wrote a section of the 2023 Physician Alignment: Tips and Trends Report that discusses quality incentives for providers. It captures key factors to consider, from a valuation perspective, when looking to enter value-based arrangements and where to start.
Value-based arrangements require a very orchestrated balance between legal and compliance, operational champions, and valuation teams. Operational teams should be able to focus on what changes and improvements they want to implement, valuation teams must have an understanding of those goals, and legal and compliance must be involved to ensure the approach is appropriate and compliant. Without cohesion between these three groups, we see those eleventh-hour issues pop up.
Our team serves as the single source for your valuation, strategic, and compliance needs. If you would like to learn more about VMG Health, get in touch with our experts, subscribe to our newsletter, and follow us on LinkedIn.
By: Madi Whyde, Savanna Ganyard, CFA, Jordan Tussy, and Madison Higgins
VMG Health reviewed the earnings calls of publicly traded healthcare operators that reported earnings for the third quarter that ended on September 30, 2022. By focusing on the major players in select subsectors defined below, we analyzed the frequency of certain keywords including inflation, COVID-19, interest rates, premium labor, and others. We used these keywords to identify which topics commanded the room this earnings season. Highlights from the calls are summarized in this article.
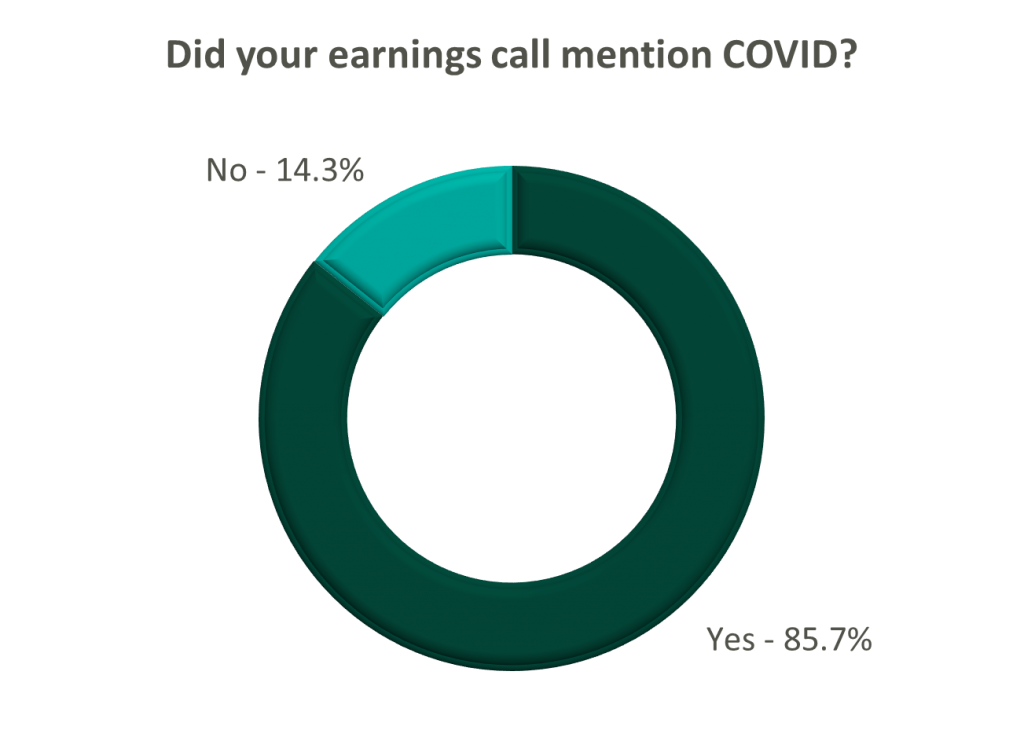
Volume: Although volume trends are unique to each industry sector nearly all operators remained focused on the impacts of COVID.
Poll: Did the earnings call mention COVID-19?
On a same-facility basis, admission volumes declined as much as 5.0% from the comparable prior year quarter (Q3 2021) for acute care hospital operators. Despite the weakening of COVID-19, the decline in volumes was attributed to higher-than-average cancellation rates (THC), the migration of certain procedures to outpatient status (CYH and HCA), and capacity constraints (HCA). Inpatient volumes generally remained at or below pre-pandemic levels.
Ambulatory surgery center (ASC) operators reaped the benefits of the migration to the outpatient setting and reported positive volume trends when compared to Q3 2021. Surgical volumes were reported as consistent with 2019 pre-pandemic levels (THC), and one operator claimed the business did not experience any material direct impact related to COVID-19 during Q3 2022 (SGRY).
The post-acute sector reported mixed results in volume trends. One operator reported a year-over-year decline of 14.0% in hospice admissions, citing capacity constraints and reduced referrals from acute care hospitals (EHAB). However, another operator indicated that increases in admissions in the second half of the third quarter showed growth that they “haven’t experienced since the start of the pandemic” (CHE).
Volume trends among other industry players including dialysis providers, risk-bearing organizations, and physician services were also affected by COVID-19 in Q3 2022. Headwinds in dialysis volumes are expected to persist for the foreseeable future (DVA), and inpatient volumes for risk-bearing organizations remain below pre-pandemic levels (AGL). Notably, AGL also reported a rebound in physician office visits and outpatient volumes were in line with pre-pandemic levels.
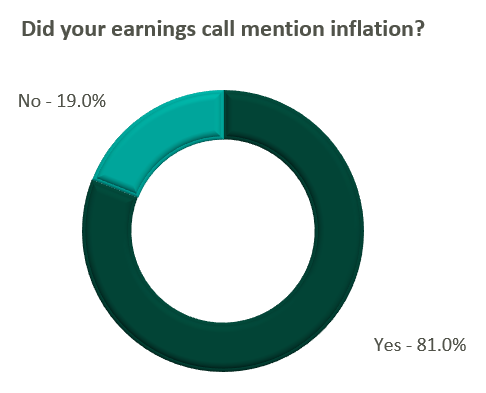
Reimbursement: Declining COVID-19 volumes mean less incremental government revenue for certain industry players who also now contend with an uncertain inflationary environment.
Poll: Did the earnings call mention inflation?
Declining COVID-19 volumes resulted in lower acuity patients and reduced incremental government reimbursement. This softened the reimbursement per admission for the acute care hospital segment. Further exacerbated by inflation, these dynamics were evident in reported EBITDA margins which declined as much as 17.0% (CYH) over Q3 2021. In response, some acute care hospital operators are turning to commercial payor negotiations. Rate increases for the next year are anticipated to range from a minimum of 3.0% (THC) to upwards of 6.0% (CYH).
The post-acute sector did not release specific figures regarding contract rate hikes. However, the sector is optimistically looking for high single-digit rate increases (SEM) to provide relief in the current inflationary environment.
Labor: Unsurprisingly, management teams across the sector were faced with questions about labor trends and management techniques during their earnings calls. Contract labor remained pivotal for the operations of some, but premium labor appears to have softened during the quarter.
Poll: Did the earnings call mention premium or contract labor?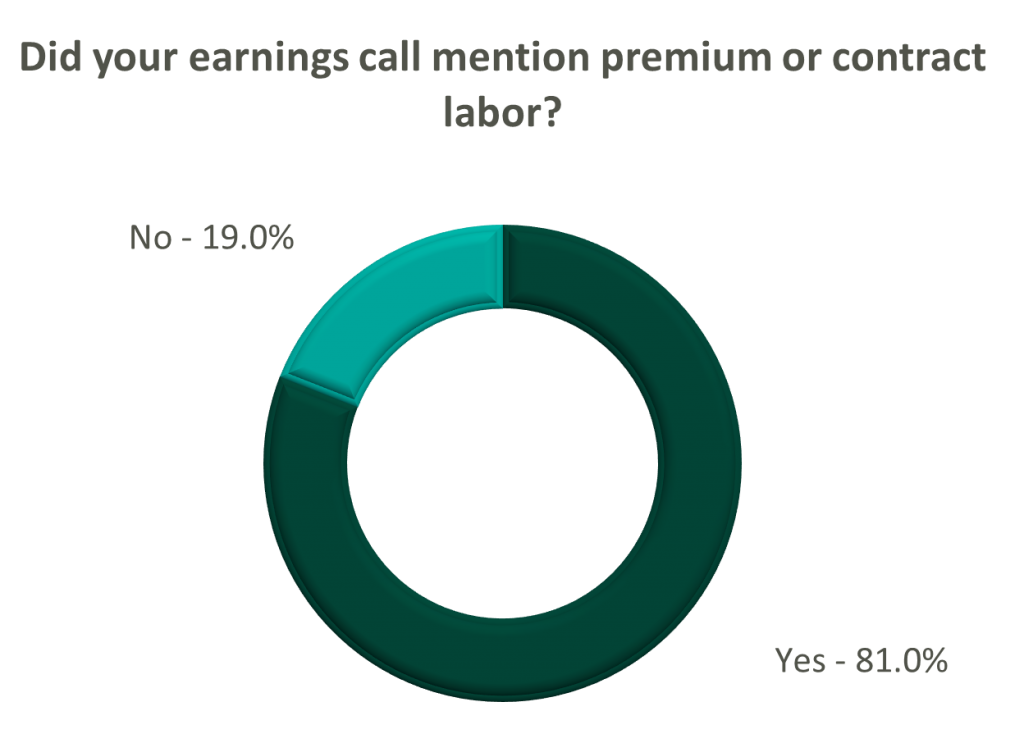
The reliance on contract labor continued its downward trend in Q3 helping moderate expenses. HCA even indicated overall labor costs were stable due to targeted market adjustments. However, contract labor and premium pay remain at uncomfortably high levels for most acute care hospital operators. UHS revealed during their call it will be unlikely to reach pre-pandemic levels in the near future.
Staffing challenges persisted among the post-acute operators and directly impacted volume by as much as 60.0% (AMED). Increased indirect labor costs including orientation, training, and sign-on bonuses were the leading drivers of decreased EBITDA (AMED). Wage inflation, particularly for nursing positions, is expected to rise as much as 5.0% next year (SEM). However, several management teams are optimistic wages will stabilize to historical levels (SEM, EHC) in the near future.
Other industry players, including dialysis and physical therapy providers, also faced challenges with contract labor during the quarter. USPH reported labor costs were approximately 200 basis points higher than Q3 2021 levels, and DVA indicated such costs showed no improvement.
Go Forward Expectations and Guidance: Considering the quarter’s performance, the companies we reviewed were divided relatively evenly in terms of revised FY 2022 revenue guidance, (i.e., raised, lowered, unchanged). In general, the quarter brought about a more pessimistic view of FY 2022 EBITDA, and the majority of public companies lowered their guidance for the year. Further, most stakeholders were left with no guidance for FY 2023.
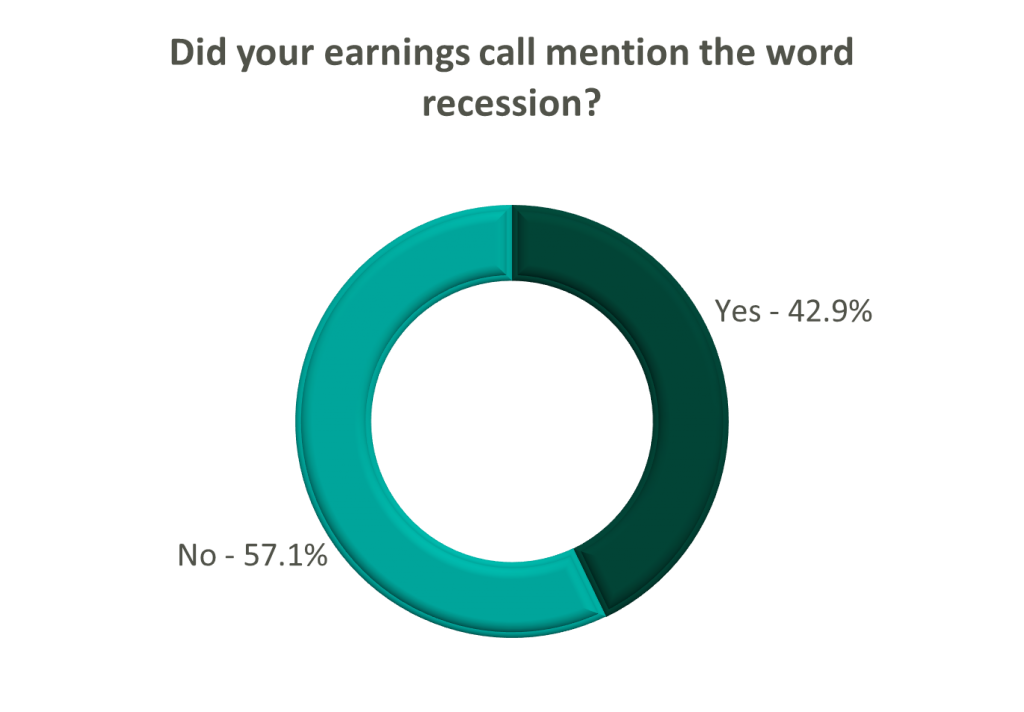
Poll: Did the earnings call mention a recession?
FY 2022 revenue and EBITDA guidance among the acute care hospital operators was generally left unchanged except for THC which lowered EBITDA guidance. However, all companies that were reviewed declined to provide FY 2023 guidance during the call, and primarily cited economic uncertainty (HCA).
The post-acute sector appeared nearly unanimous in the outlook for the rest of 2022, and most operators lowered their revenue and EBITDA guidance. Unsurprisingly, no one offered FY 2023 guidance during the earnings calls.
Interestingly, risk-bearing organizations mostly raised their revenue guidance for FY 2022 (AGL, CMAX, PRVA). However, EBITDA guidance was less predictable and was lowered (AGL, TOI), raised (PRVA), and unchanged (CMAX).
Most other healthcare operators followed similar patterns in terms of providing guidance for FY 2023. Of the companies we reviewed, only DVA revealed an outlook for the next year. The company anticipates revenue to be flat (driven by unfavorable volume trends) and margins to continue to feel the impact of labor market pressures.
Written by Melissa Hoelting, CPA
The COVID-19 pandemic sent shockwaves throughout the urgent care industry and fundamentally changed the business of urgent care centers (UCCs). At the start of the pandemic, UCCs had to quickly adapt to offer a new service line and meet the high demand for COVID tests. As the pandemic has progressed and evolved, UCCs have had to continue to adapt to address the effects of vaccination, variants, and at-home testing to their volumes. In addition to this, they have had to adjust to the changing landscape around reimbursement in regard to government mandates on COVID testing and an increase in new patients. As the pandemic has evolved, the VMG Health Quality of Earnings team has been involved in urgent care transactions and has worked firsthand with our clients to quantify the effect of these changes on EBITDA.
Urgent care centers were at the forefront of treatment and testing services throughout the COVID-19 pandemic. After initial volume disruptions during the early onset of the pandemic, urgent care centers experienced significant increases in testing volumes and new patient visits. Average patient visits per clinic (“APVC”) reached record highs during the summer of 2020 when UCCs ramped up testing capabilities and adopted telehealth services. Overall, UCCs with COVID-19 testing capabilities retained more volume than those without testing capabilities.
In addition to the increased visit volumes, the patient mix between new and established patients shifted. Prior to April 2020, patient mix between established and new visits averaged approximately 60% established and 40% new patients. Following COVID spikes, new patient visits became a greater ratio of total visits and represented over 50% of patient visit mix after April 2020 and into 2021. This mix shift had an impact on reimbursement for many urgent care centers. Clinics saw an increase of 52.0% in average net revenue per visit in 2020 as new patients were reimbursed at a higher rate than established patients. This was partially offset by a rise in “no-visit” patients where an E&M code was not billed (e.g., only testing services performed).
During January 2022, through funding from the American Rescue Plan, at-home COVID testing kits were offered online for free. As of May 2022, over 70 million households have visited COVIDTests.gov to order free at-home tests and 350 million tests have been delivered through the program. The program has offered several rounds of free at-home testing mailed through USPS, and eight additional tests were approved for distribution as of May 17, 2022. In addition, pharmacies, online stores, (e.g., Amazon), and retail locations have expanded the accessibility of at-home testing kits.

To quantify the impact of these trends on an urgent care center’s quality of earnings, we must first distinguish between the three types of visits – asymptomatic COVID visit, symptomatic COVID visit, and traditional urgent care visit. Many UCCs now require an office visit whenever a COVID test is administered, therefore we cannot solely use CPT codes to separate between asymptomatic and symptomatic visits but instead must rely on the ICD-11 codes. Based on ICD-11 codes, asymptomatic COVID visits include patients who only have a COVID test code and, in some cases, a comorbidity code such as having high blood pressure, being a smoker, etc. Symptomatic COVID visits include both a COVID test code and symptom codes (i.e., cough, sneeze, sore throat, etc.). Finally, traditional UCC visits include all remaining visits. Once these visits have been categorized we can begin adjusting to expected go-forward volumes.
First, we evaluate the appropriate run-rate of asymptomatic COVID testing. At the start of the pandemic, few individuals received an asymptomatic COVID test since facilities often experienced shortages of tests and chose to prioritize symptomatic patients. In 2021, asymptomatic testing increased as individuals sought testing to meet requirements imposed for travel, employment, and other reasons. Recently, asymptomatic testing demand has fallen (decreased?) as many cities, states, and countries have either eliminated testing requirements or replaced them with vaccine requirements. Due to the changing landscape of asymptomatic testing, we use a narrow time frame of three to six months to determine the appropriate run-rate volume.
Next, we determine the go-forward state of symptomatic COVID testing. Before the prevalence of vaccines, symptomatic COVID testing dominated UCC volume. At this time, the only downward pressure on volume came from supply shortages. After widespread availability of vaccines in early 2021, UCCs began to experience periods of both high and low demand for symptomatic testing as new variants began to emerge. In addition to this more seasonal nature of demand, at-home testing became more prevalent, and was further accelerated by the funding from the American Rescue Plan in January 2022. Based on all these factors, we use a look back period of eight to 12 months for calculating average go-forward volume. This timeframe ensures we capture seasonality while only including months with similar circumstances regarding vaccinations and at-home testing.
Finally, we evaluate the expected recovery of traditional urgent care volume. During the period of stay-at-home orders in 2020, UCCs saw a large fall off in non-testing volume. This was especially prevalent as many facilities temporarily became COVID-only sites. After stay-at-home orders were lifted, facilities still saw lower non-testing volume due to other restrictions put in place such as mask mandates and social distancing. These restrictions resulted in a milder cold and flu season at the time. As traditional volumes remain depressed, 2019 represents the ideal benchmark for estimating future urgent care volume as it is the last year untouched by COVID.
However, relying on 2019 volumes to determine a new run-rate comes with its own challenges stemming from capacity constraints, hiring challenges, and volume trends. In 2019, most UCCs were ideally operating close to full capacity with only traditional visits. Thus, we need to balance expected COVID test volume with a return to normal to ensure we do not project total monthly volume beyond the capacity of a location. Additionally, many UCCs have reported hiring challenges due to the shortage of nurses and mid-level providers which make up the bulk of staff for most facilities. We address this challenge to our calculation by holding conversations with management to understand the specific facility’s hiring challenges and to determine if traditional capacity needs to be reduced. Finally, as of April 2022, Experity reported that non-COVID visit volumes were only at 72% of pre-COVID levels. This trend means we cannot peg a complete return to pre-COVID levels because volumes have not recovered despite life returning to normal in many states. With all these challenges, we can no longer use 2019 as a benchmark since the landscape of urgent care volume mix has changed dramatically over the last two and a half years. As a result, we elect to use the average of the last six to eight months to capture seasonality and current trends. Although these volumes trend lower than 2019, they reflect the changing reality of the volume mix and capacity concerns.
Once we have determined go-forward monthly volumes for the three test types, we can make the appropriate quality of earnings adjustments. We begin by creating cash waterfalls for each volume type to calculate accrual basis revenue. Using this revenue, we calculate the historical average reimbursement for each visit type. Due to changing reimbursement trends for COVID testing and office visits in recent years, we use the average of the last six months in our calculation of adjusted revenue. Once we have determined the revenue adjustment, we estimate the associated variable expense impact for each visit type based on common size percentages, direct allocation, and invoice review. Volume estimates are the key to the calculation of both the revenue and expense adjustments, which emphasizes the importance of reasonable estimates.
Besides impacting urgent care volume and mix, COVID-19 also impacted the ramp up of de novo facilities opened just before and during the pandemic. Average startup location volumes historically averaged between 10 to 20 visits per day in the first six months of operations for de novo locations opening between 2016 and 2019. Volumes for these locations stabilized at approximately 30 – 40 patients per day after 18 to 24 months. However, startup locations that opened in 2021 saw an average of 32 patients per day in the first month, and 60 visits per day after just six months.
For a quality of earnings analysis, the changes to the ramp up of de novo facilities create a challenge for quantifying a run-rate adjustment. First, there are concerns about sustainability of patient volume as COVID testing declines. In the beginning of the pandemic, shortages of tests meant individuals sought tests wherever possible even if it meant traveling to a further center. Some parent companies even made de novo locations into COVID-only sites to raise awareness of the new location. As a result, some patients may return to a different location for future visits which creates uncertainty when estimating the impact of a return of traditional urgent care volume. To combat this challenge, we engage in discussions with management to identify existing sites that serve a similar demographic and can be used as the volume being averaged to calculate run-rate.
The case mix changes also cause issues in conducting a revenue hindsight analysis. Due to government mandates around reimbursement for COVID testing, UCCs experienced higher reimbursements for patients getting a COVID test since many payors were obligated to pay all claims. Additionally, many COVID tests were administered either with no office visit or with an office visit of a lower E&M code level than typical. Furthermore, UCCs that did require an office visit often saw new patient visits becoming a greater ratio of total visits following COVID spikes and new patients represented over 50% of patient visit mix after April 2020 and into 2021. This patient mix shift drove an increase in average net revenue per visit for many UCCs. Finally, stay-at-home orders and people working from home have driven a slowdown in reimbursements from payors. As a result, historical collection trends were skewed during 2020 and into 2021. All these factors necessitate a close analysis of the revenue data for UCCs which often entails performing separate analysis by visit type (i.e., test vs. non-test) or CPT code (i.e., new patient vs. established). Due to the changing landscape of patient and visit type mix since the beginning of the pandemic, the revenue hindsight analysis has become a large area of focus for all parties to the transaction.
Typically, the last, most straightforward adjustments we perform in our analysis center on non-recurring COVID revenue and expenses such as CARES Act funding and rent abatement. Many UCCs participated in the various economic relief programs and received Paycheck Protection Program (PPP) loans, HHS stimulus grants, Economic Injury Disaster Loans (EIDL), etc. As these amounts were received or forgiven, many UCCs recognized the amounts as income. Additionally, UCCs often took advantage of temporary rent or payroll tax abatements that were recaptured or will be recaptured at a later date. These amounts represent non-recurring or temporary measures, and we always include adjustments to eliminate their impact from earnings.
With all these complications and uncertainties arising from COVID testing, both buyers and sellers in the UCC market need to engage a quality of earnings team for their transactions. Over the last two and a half years, the outlook of COVID and testing has changed week-to-week and month-to-month. During 2021, our team was engaged as a sell-side advisor and conducted an original analysis in addition to two roll forwards for one client. Each of our analyses was at a different point in 2021 and each analysis had unique trends around vaccination, variants, and seasonality. By engaging a quality of earnings team, our client was able to get a deeper analysis of its earnings to quantify the effects of this changing landscape on its EBITDA. From the expansion of at-home testing to the potentially permanent depression of traditional volume, quality of earnings will be crucial in analyzing the changing nature of the COVID and UCC landscape as we continue to return to normal.
Authors
Related Content