

Private Equity Investment in Ambulatory Surgery Centers
Rachel Linch
September 21, 2023

Written by Christian Lynch and Chance Sherer, CVA
Ambulatory surgery centers (ASCs) continue to be the target of health systems, physicians, and financial investors due to their straightforward business model and ability to align with physicians. As more high-acuity, high-reimbursing procedures transition to the outpatient setting, ASCs will become increasingly attractive for investment and will further cement their status as a preferred, low-cost surgical setting. Given the considerable attention from potential investors, it is crucial to understand how value is measured, how that value is derived, and the common terms used to describe value.
To convey value, market participants often speak in terms of “multiples.” A multiple is simply a company’s enterprise value divided by an industry-specific metric. Multiples are used due to their simplicity and ability to compare subjects to industry peers without the need for complex analyses. Although multiples within healthcare can be based on many different metrics, such as number of beds, revenue, covered lives, panel size, etc., ASCs are most discussed in terms of EBITDA multiples.
EBITDA, defined as earnings before interest, taxes, depreciation, and amortization, generally approximates a center’s cash flow, and by extension, its profitability. By calculating earnings before non-cash charges, such as depreciation and amortization, EBITDA represents earnings available to shareholders better than net income. Additionally, excluding interest expense removes the effect of capital decisions, whereby shareholders decide to finance purchases with debt or purchase equipment outright. Due to the discretionary nature of utilizing debt instead of cash, removing the impact of such decisions makes EBITDA an easily comparable metric between industry participants.
Understanding EBITDA and its benefits provides a clearer picture of multiples and their meaning. For example, a multiple of 8x EBITDA means the target ASC can be wholly acquired for a sum equal to eight times its EBITDA. Despite the prevalence and simplicity of EBITDA multiples, there are a few significant pitfalls to be aware of.
First, it is important to recognize that EBITDA multiples are often discussed in terms of “implied” multiples rather than “applied” multiples. Put another way, the final transaction value is typically determined through a detailed analysis of the subject ASC’s historical and projected financial performance. This value is then divided by EBITDA to arrive at an implied multiple.
Investors and valuation professionals are concerned about the ultimate distributions received from an investment in an ASC and the associated risk/return. The distributions are assessed through a discounted cash flow analysis where future earnings are projected and discounted back to present-day dollars using a discount factor. The sum of these discounted cash flows is then used to estimate the value. This analysis allows for the consideration of many idiosyncratic factors relevant to the subject ASC, such as size, geography, capacity, specialty/case mix, payor mix, staffing and supply expense growth, capital requirements, and many other factors.
Conversely, simply applying a market multiple to EBITDA will give an indication of value but may not accurately reflect the specific factors of the subject ASC. Given the intricate analysis used to determine value, it is clear why ASC transactions at the control level do not all occur at the same multiple; one center may be valued at a 7.3x implied EBITDA multiple, and another may be valued at an 8.2x multiple.
Buyers and sellers must understand the range of EBITDA multiples in the market to ensure the analysis produces an appropriate result. If the implied multiple lies outside the market range the discounted cash flow analysis will provide an explanation as to why.
To fully understand an implied EBITDA multiple is it critical to know the EBITDA by which the multiple is calculated. As shown in the table below, the implied EBITDA multiple of ASC value can be expressed using several different types of EBITDA; however, the most common are historical, normalized, and projected. Historical EBITDA represents the actual earnings of the center in the prior 12 months. On the other hand, normalized or adjusted EBITDA represents earnings after adjusting revenues and expenses to depict what a normal past 12 months of operations would have looked like.
Typical adjustments include the removal of one-time expenses and revenues, transaction adjustments for related-party arrangements (i.e., management agreements, billing fees, rent expenses), and adjustments for the timing of certain revenues and expenses that are over-represented or under-represented in the examined historical period. Lastly, projected EBITDA represents the expected next 12 months of earnings after normalization. It may account for many specific factors, but commonly it varies from normalized EBITDA due to expected changes in case volume.
Using different types of EBITDA can have a material effect on multiples. For example, after removing certain nonrecurring expenses, a center’s normalized EBITDA might be $100,000 higher than the historical level. As a result, a control-level value indication of $10,000,000 would produce a multiple of 8.3x based on historical EBITDA, whereas using normalized EBITDA would imply a multiple of 7.7x.

Though implied multiples are often discussed in terms of normalized or projected EBITDA, sellers should be cautious when hearing rumored valuation multiples among their peers. A possible disconnect between the various indications could distort the view of how ASCs are valued.
While it is beneficial to understand the general market ranges for ASC transaction multiples, an extensive assessment of the specific facts and circumstances of any singular center is required to determine its precise value. This valuation requires detailed knowledge of the operations and financial performance of the ASC from both a historical and future perspective. To determine an accurate valuation range for a center, buyers and sellers commonly engage the services of qualified advisors, such as VMG Health, who have extensive experience in ASC valuation.
Written by Josh Miner, Savanna Ganyard, CFA, and Taryn Nasr, ASA
The Ambulatory Surgery Center (ASC) market is a fast-growing sector of healthcare that is attracting considerable interest from private equity (PE) funds across the country. The following outlines the current state of the market as well as key factors driving ASC market growth and attracting PE investment.
2021 saw the most PE-related healthcare transactions in history, with an estimated 1,018 transactions occurring throughout the year. During the first quarter of 2023, transaction activity slowed from the pace set in 2021, primarily due to macroeconomic factors including inflationary pressures, rising interest rates, and higher labor costs. Additionally, rising interest rates and tight credit have increased the cost of debt leading to a reduction in leverage of one to one-and-a-half turns. Uncertainty surrounding the bank debt market has led PE investors to turn to private credit and other deal strategies. These strategies include searching for smaller deals where securing financing may be easier or targeting add-ons that are small enough to purchase without debt.
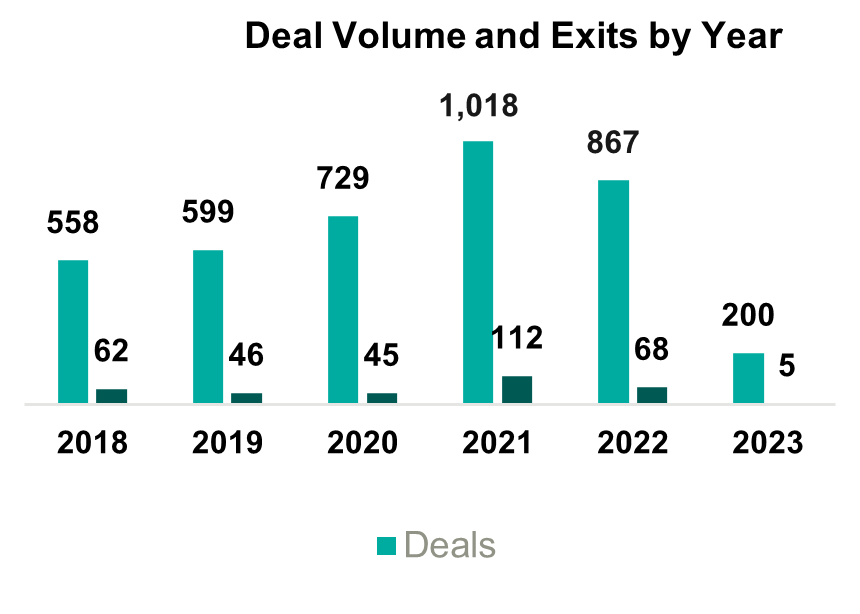
Despite the recent slowdown in activity, it is likely that the deal volume will rebound as macroeconomic uncertainty eases, but, in the short term, PE firms will likely continue to target smaller platform deals and add-ons. These transactions will likely involve independent targets, as other institutional investors may not attempt an exit in the current economic conditions.
The ASC market was recently sized at $84 billion in 2020 and is projected to grow at a compounded annual growth rate (CAGR) of 3.9% to $131 billion by 2031. The industry is highly fragmented with 70% of ASCs independently owned and the remaining owned by larger conglomerates. Over the past several years, PE ownership in the ASC space has steadily increased. Two of the largest players in the industry, AmSurg and Surgery Partners, have PE ownership. Other major ASCs with PE ownership include Covenant Physician Partners, EyeCare Partners, Gastro Health, GI Alliance, HOPCo, PE GI Solutions, and Value Health. Notably, Bain Capital’s $3 billion leveraged buy-out (LBO) of Surgery Partners in 2017 remains the largest deal completed in this space.
The expected growth in the ASC industry is driven by numerous factors including a shift towards lower cost procedures. On average, patients save $684 per procedure at an ASC as compared to a hospital based on a 2021 report from UnitedHealth Group. Specifically, orthopedics is a growth area driven by cost savings. On average, ASCs reduced the cost of orthopedic procedures by 17% to 43%. These cost savings at an ASC lessen the burden on the patient and help boost margins in an ASC setting. As a result, orthopedics continues to be a popular specialty for investors pursuing an ASC strategy.
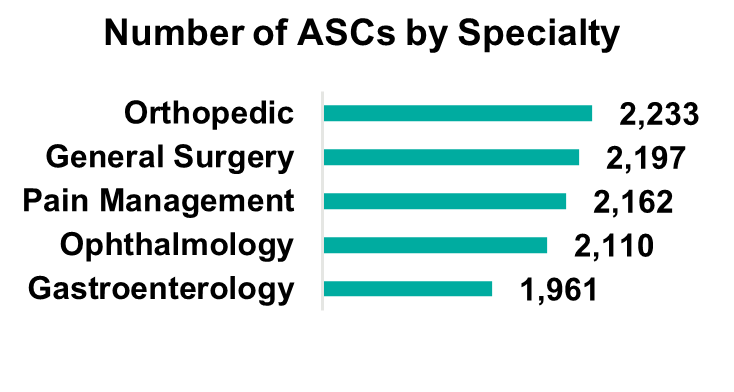
Orthopedics remains the most popular specialty, but gastroenterology, pain management, and ophthalmology make up large portions of the market. Notably, cardiology has become the fastest-growing specialty as ASCs invest in technology and higher acuity procedures continue to move to the ASC setting. The demand for cardiology is driven by an aging population and the level of cardiovascular disease in U.S. adults (e.g., half of all U.S. adults have cardiovascular disease). While cardiology is currently primarily a hospital-based specialty, with 70% of cardiologists employed by hospitals, as this specialty moves into ASCs there is a unique opportunity for PE firms to secure a foothold in a fast-growing segment.
On January 31, 2023, Lee Equity Partners (LEP) completed a buyout of the Cardiovascular Institute of the South (CIS) for an undisclosed amount (of note, LEP deals typically range from $50 to $150 million in equity). CIS has 21 locations across two states and employs over 60 physicians. This deal represents one of the larger buyouts of an ASC in recent memory and illustrates the growth of cardiology as a specialty in ASCs.
As more cases and specialties shift to an ASC setting, there is an increasing patient demand for multi-specialty ASCs. Patients are seeking convenience in the ability to receive treatment for a multitude of treatments in one place. The number of multispecialty ASCs is forecasted to expand at a 4.3% CAGR, outpacing general ASC market growth.
These industry characteristics coupled with the PE industry outlook should continue to drive transactions within this space, specifically among the 70% of independently owned ASCs. Due to recent macroeconomic factors, we expect PE firms to continue to pursue smaller add-on deals aimed at consolidating several ASCs in an area. These types of transactions allow PE firms to capitalize on industry trends, optimize cost-cutting opportunities, and generate attractive returns. On the other hand, these transactions are also attractive to independent and physician-owned ASCs due to the benefits of a larger growth infrastructure which can leave more time for physician owners to focus on patient care.
ASCs can offer cost savings and convenience to consumers without sacrificing quality of care. Due to increasing demand, the number of specialties, and the ability to perform high-acuity procedures, the ASC market is projected to grow steadily over the next decade. Market growth, combined with the availability of investment opportunities due to the fragmentation of the market, will continue to attract PE investment. As macroeconomic conditions become less uncertain, it is likely that PE investment will continue to rebound to historical levels in the healthcare industry. Furthermore, the many attractive qualities of the ASC industry should draw investment in the space.
Written by Anthony Domanico, CVA and Ben Minnis, CVA
The following article was published by the American Association of Provider Compensation Professionals.
In the rapidly evolving landscape of healthcare, traditional fee-for-service (FFS) reimbursement models are being replaced by alternative payment models that focus on value-based care in addition to, or even sometimes fully in replacement of, fee-for-service reimbursement. This shift from volume to value necessitates a strategic rethinking of compensation plans for healthcare providers to align incentives, optimize patient outcomes, and maximize revenue. The implementation of value-based compensation plans requires a deep understanding of the intricacies of different alternative payment models and the development of innovative strategies to ensure financial success while prioritizing quality care.
A key tenet of value-based care is the focus on delivering high-quality healthcare outcomes to patients while managing costs effectively. Alternative payment models, such as bundled payments, accountable care organizations (ACOs), and capitation, incentivize providers to prioritize preventive care, care coordination, and patient engagement while reducing unnecessary or inappropriate services.
These models differ from traditional fee-for-service, which rewards the quantity of services delivered rather than their outcomes. Under a fee-for-service reimbursement model, the more you do, the more you get. This is the case even if certain types of care or services are not warranted, are considered excessive based on the problem set presented by a particular patient, or do not lead to good patient outcomes.
However, under value-based contracts providers are rewarded not for the volume of services rendered, but for providing high-quality care to a large population of patients while also reducing unnecessary and/or inappropriate services.
While all value-based care models pay for value in some respect, the way various payment programs are structured will determine what compensation mechanism(s) will lead to better outcomes for both the physician and the organization.
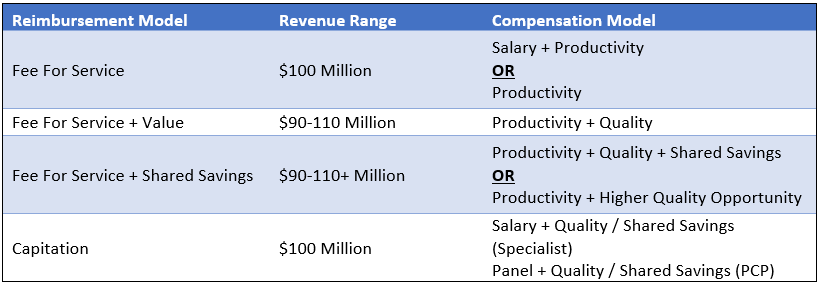
Consider the following scenarios that are all focused on a hypothetical organization with $100 million of revenue and 200 FTE doctors ($500,000 in revenue per FTE).
Under a non-capitated value-based model where the organization continues to earn reimbursement under an FFS construct, with additional revenue opportunities through quality incentives, that organization might see $90 million of FFS revenue for the same book of business. In addition, that organization can earn up to an additional $20 million in value-based payments for a total possible range of $90-110 million of revenue.
Under this reimbursement structure, the organization will still be incentivized to have its physicians rewarded for productivity. After all, a sizable portion of the organization’s revenue, and most of the organization’s ability to increase the revenue pool (the $90 million), is through FFS reimbursement. As such, a compensation model under this construct might be a productivity model (with or without a base salary component). Also, it would include an additional incentive opportunity for value-based arrangements based on the metrics included in the organization’s value-based contracts.
Another emerging component of value-based contracts is shared savings opportunities. If an insurer typically incurs costs of $10 million for managing a population of patients, and the subject organization can take high-quality care of the same population of patients for $9 million, insurers are increasingly sharing a portion of the cost savings back to the providers/health systems that are helping to achieve these savings.
Designing compensation arrangements to maximize shared savings opportunities is much trickier than under FFS and value models. After all, it is much more challenging to define metrics around achieving cost savings on a targeted population of patients than it is to measure things like hemoglobin A1c scores. As a result, we often see organizations either use shared savings dollars earned from insurers to fund larger quality incentives or pass through a portion of those earned dollars received from insurers to network physicians.
The latter option is complex in that it requires organizations to understand how those cost savings are achieved and to be able to allocate those savings earned down to the individual physician level or develop a proxy formula to estimate these factors for payment. As an example, we may see an organization decide to withhold 50% of funds earned to cover the additional costs incurred by the employer (such as hiring care coordinators to ensure patients with diabetes are getting back to the clinic for follow-up tests, etc.), and distribute the remainder by using a formula based on quality, wRVUs, or some other distribution formula.
Ensuring compensation remains consistent with fair market value under these types of arrangements is challenging. With that in mind, you will want to ensure you are working with counsel and a compensation design/valuation expert to ensure any compensation models remain consistent with fair market value.
At the other end of the volume-to-value spectrum are capitation models which include an organization that receives a fixed payment on a per member per month basis for all members under its care. Under these models, if those 200 FTE physicians manage a panel of 50,000 patients, and the organization is reimbursed $166.67 per patient per month, that organization receives a total annual payment of $100 million.
Under these models, the organization receives a fixed payment regardless of its costs, assuming it has the same number of patients. An organization can only increase top-line revenue through growth in the patient population served, so compensation models tend to be a combination of fixed and variable. Specialists might be paid on a salary-type model (with or without incentives), while primary care providers might be paid on an acuity-adjusted panel size model whereby physicians are incentivized to take on more patients and grow the total capitated revenue of the organization.
These models may also include incentive payments tied to care coordination, quality outcomes, cost controls/reductions of unnecessary or inappropriate services, and the like.
The table below summarizes the options discussed. Note that the compensation models in the right-hand column are the most predominant compensation model structures for a particular reimbursement model. However, other models may be more appropriate depending on the facts and circumstances impacting the subject organization.
In addition to designing compensation models that allow for maximum revenue potential, organizations must enact robust change management processes to ensure their providers are not lost in the transition to a new compensation model. Providers need to understand the rationale behind the new models and how their efforts contribute to both patient care and financial success for the organization and the providers. Regular feedback loops and performance evaluations can help providers track their progress and make necessary adjustments.
As healthcare continues to shift toward value-based care, designing an effective compensation plan is becoming increasingly crucial for provider organizations to thrive under these alternative payment models. The suitable model for your organization might vary significantly from the compensation structure observed at the neighboring health system. This is especially true considering both organizations could be positioned at distinct points along the risk continuum.
The key success driver is for organizations to design models that will help them be successful wherever they are on the continuum. By aligning incentives with patient outcomes, leveraging innovative strategies to provide more cost-effective care, and adapting to changing market dynamics, organizations can optimize revenue and physician-earning opportunities while delivering high-quality care to their patients.
Written by Nick Shannon, ASA, and Joel Gomez, ASA
Earlier this year, the United States Attorney’s Office Eastern District of Michigan issued a press release regarding a False Claims Act settlement involving a regional hospital system and physicians. Specifically, Covenant Healthcare System paid $69.0 million to settle allegations in 2021 under the False Claims Act related to improper financial relationships with eight physicians and a physician-owned investment group. In addition to the False Claims Act, there were specific allegations pertaining to the Anti-Kickback Statute (AKS) and The Physician Self-Referral Law (Stark Law).
One component of the allegations included a medical equipment lease arrangement between Covenant and the physician-owned investment group. It was alleged that Covenant permitted the group to structure the equipment lease under non-arms-length negotiations with the purpose of inducing patient referrals.
Many health systems and physicians/physician groups pursue lease arrangements to provide flexibility in assessing long-term relationships and to reduce capital expenditure at the outset of an employment agreement. These agreements may include traditional personal property fixed asset leases, such as furniture, fixtures, and equipment, or material capital asset leases such as major movable medical equipment. With the increased popularity and projected growth of medical equipment lease agreements, there is the possibility of increased scrutiny and consideration of whether these agreements comply with federal laws.
The structure of the equipment lease transaction has a significant impact on fair market value requirements, as well as other tax, accounting, and financial reporting requirements. When planning an equipment lease arrangement all parties involved should consider the following:
For federal income tax purposes, the Internal Revenue Service (IRS) has established guidelines for “true leases” or “fair market value lease.” This guidance specifies that a true lease, or operating lease, involves a lease transaction where the lessor is deemed the owner of the asset and receives all depreciation and tax benefits. Guidelines to consider for true lease classification include:
If the above guidelines are not satisfied, a lease transaction would be considered a non-tax lease, or capital lease, where depreciation and tax benefits fall with the lessee.
Another consideration, for both a potential lessor and lessee, is to evaluate the accounting treatment and impact for a particular classification of the lease. For example, a potential lessee interested in reporting a capital lease for financial reporting purposes would need to confirm at least one of the following criteria:
Alternatively, if the potential lessee cannot confirm any of the above criteria, they would classify the lease as an operating lease.
Once the appropriate equipment lease structure is determined the underlying details of the arrangement should be evaluated considering Stark and AKS, assuming the potential for financial and referral relationships between the parties.
Under Stark Law Section 42 CFR § 411.357(b) exceptions to the referral prohibition related to compensation arrangements subset (b) Rental of Equipment states that equipment lease arrangements do not constitute a financial relationship if the payments made by a lessee to a lessor meet the following requirements:
Similarly, AKS Section 42 CFR § 1001.952(c) outlines safe harbor related to equipment rental by meeting the following six standards:
In summary, the absence of arms-length negotiations could imply equipment lease payments constructed above or below fair market value, and therefore, not meeting Stark exception requirements under Rental of Equipment that states, “The rental charges over the term of the agreement are consistent with fair market value.”
Stark Law defines fair market value, with respect to the rental of equipment, as “the value in an arms-length transaction of rental property for general commercial purposes, consistent with general market value.”
In addition, AKS prohibits soliciting or receiving remuneration “in return for purchasing, leasing, ordering, or arranging for or recommending purchasing, leasing, or ordering any good, facility, service, or item for which payment may be made in whole or in part under a federal healthcare program.”
By Sydney Richards, CVA, Patrick Speights, and Christopher Tracanna
Approximately 45.0% of acute care discharges are subsequently admitted to a post-acute setting nationwide, including approximately 4.0% who are admitted to an inpatient rehabilitation facility (IRF). An IRF is a freestanding inpatient facility or specialized unit within an acute care hospital that offers intensive rehabilitation to patients after illness, injury, or surgery. Now more than ever, investment demand for IRFs is strong due to the unique value propositions relative to other healthcare verticals, including strong clinical outcomes at an efficient price to payors, a period of stable regulations, rising patient demand, and a high margin for efficient operators.
In response to this demand and the potential for high returns, acute care operators may consider affiliating their existing inpatient rehabilitation units (IRUs) with platform post-acute operators to drive financial returns while improving patient outcomes. IRUs are operated as distinct departments of acute care hospitals, while IRFs are freestanding facilities. Going forward we will use the generic term IRF when discussing the inpatient rehabilitation industry.
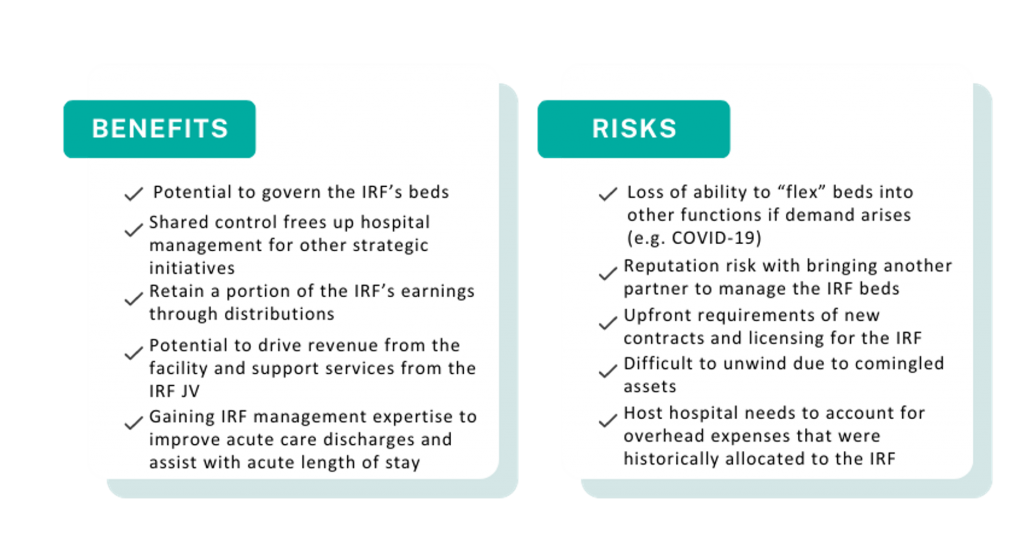
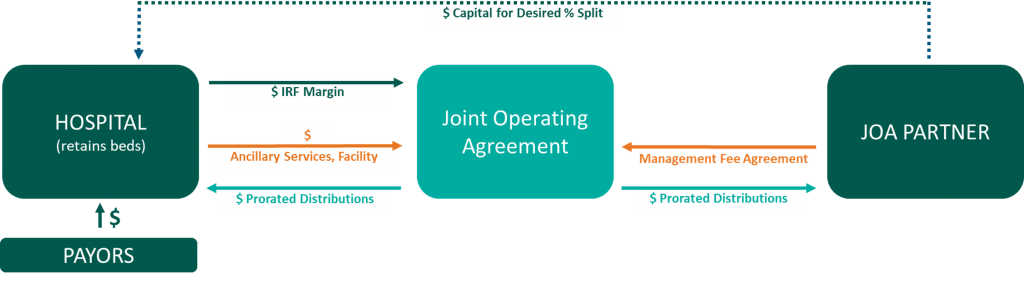
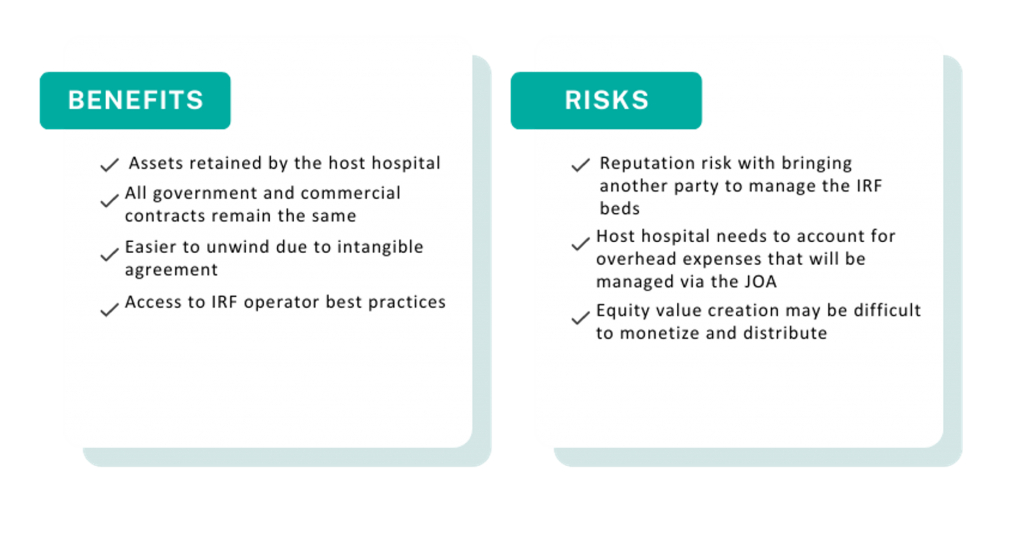
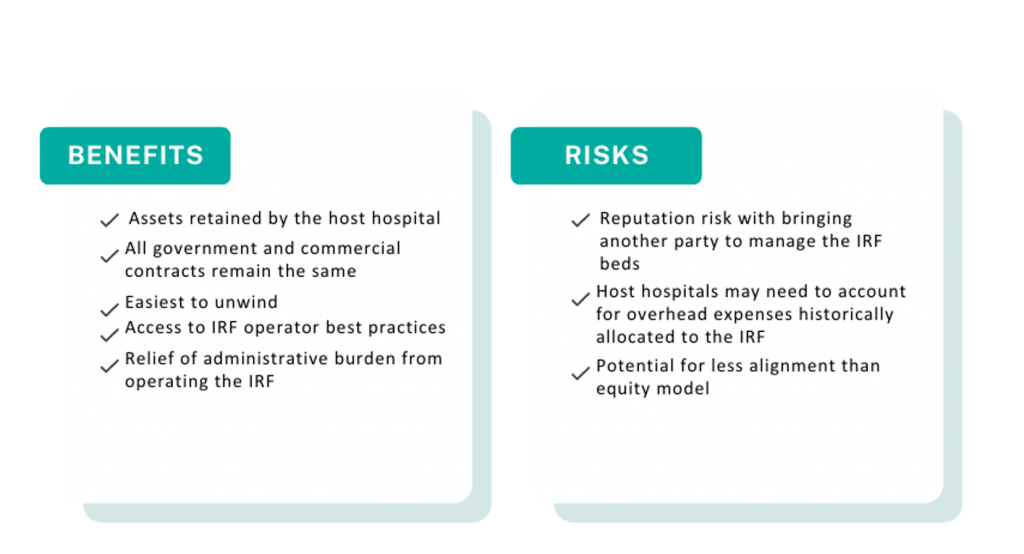
Below, VMG Health experts highlight key industry facts driving up investment. Additionally, our experts detail the potential benefits and risks of common IRF affiliation models, such as joint ventures, joint operating agreements, divestitures, and management agreements.
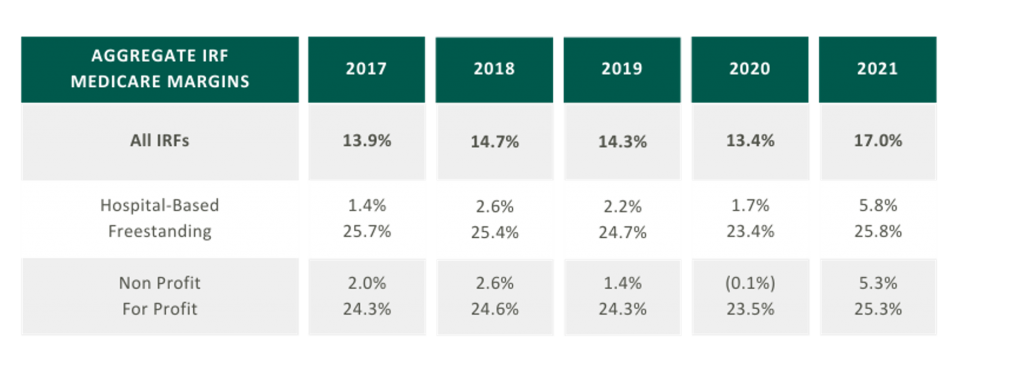
As presented in the table in the below, aggregated IRF Medicare margins were at a five-year high in 2021 at 17.0%. One driver of this increase is the Centers for Medicare and Medicaid Services (CMS) COVID-19 waivers that allowed flexibility in admission criteria and therapy requirements to maintain IRF status. Now that the emergency declaration has ended, margins may become more pressured as IRFs return to standard operating criteria. It is also notable that freestanding Medicare margins were 25.8% in 2021 compared to hospital-based margins of 5.8%. Many factors contribute to this difference, including:
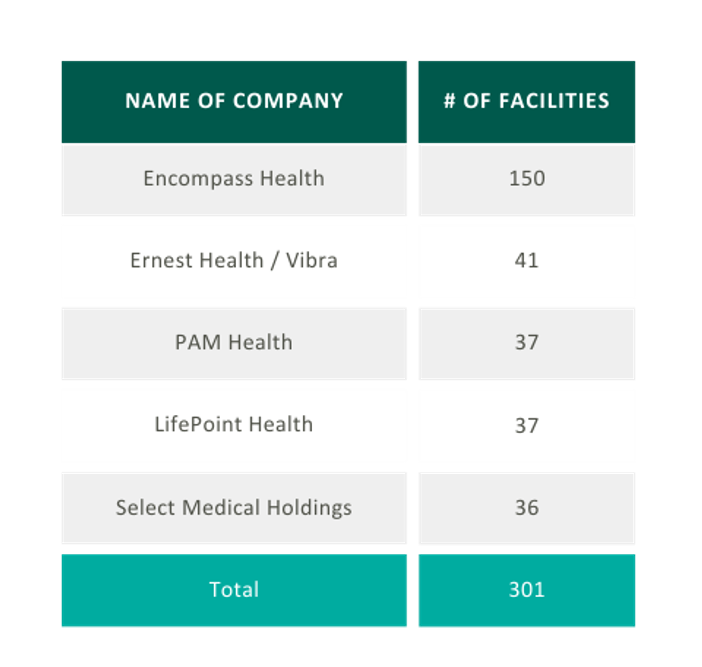
In 2021, five IRFs closed while 22 new IRFs began operations, resulting in a net gain of 17 IRFs. According to MedPAC, the majority of new IRFs were freestanding and for-profit, and most closures were hospital-based nonprofits. As reflected in the chart on the right the top six freestanding IRF operators control approximately 91.5% of freestanding IRFs in the market.
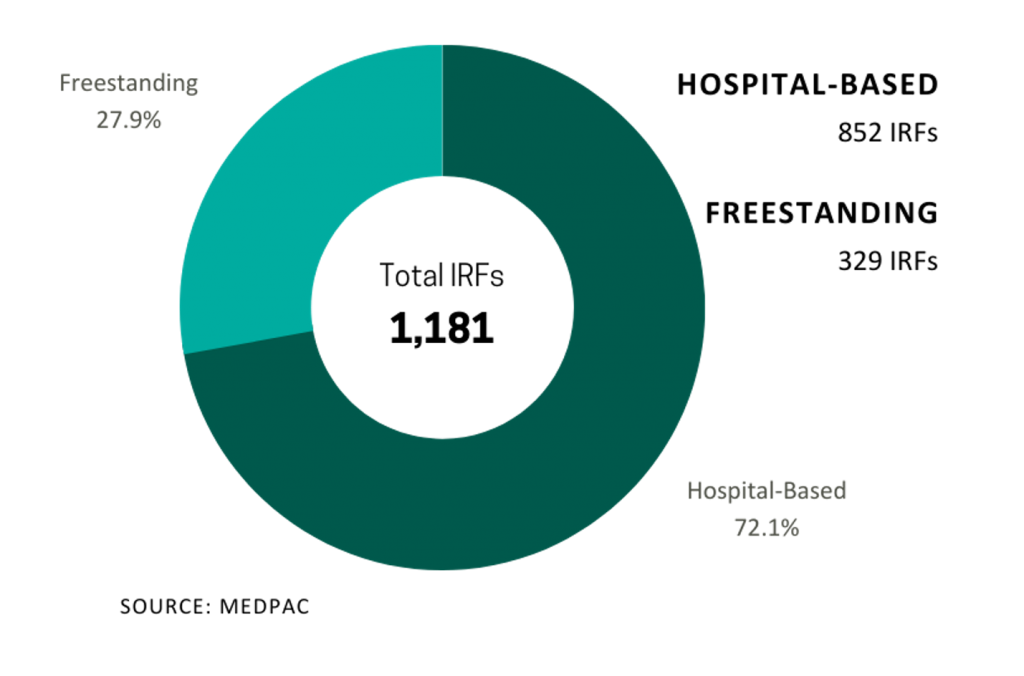
In 2021, Medicare spent $8.5 billion on 379,000 fee-for-service (FFS) discharges across 1,180 IRFs nationwide. These FFS Medicare stays accounted for approximately 52.0% of IRF discharges on average.
Despite the proliferation of specialized post-acute IRF operators, the IRF industry remains fragmented with over 70.0% of all IRF locations being hospital-based IRUs. The remainder are freestanding facilities. However, based on their relatively larger size and bed counts, freestanding IRFs accounted for approximately 55.0% of Medicare discharges. Additionally, while for-profit IRFs make up about 37.0% of all IRFs, they account for approximately 60.0% of the total Medicare discharges.
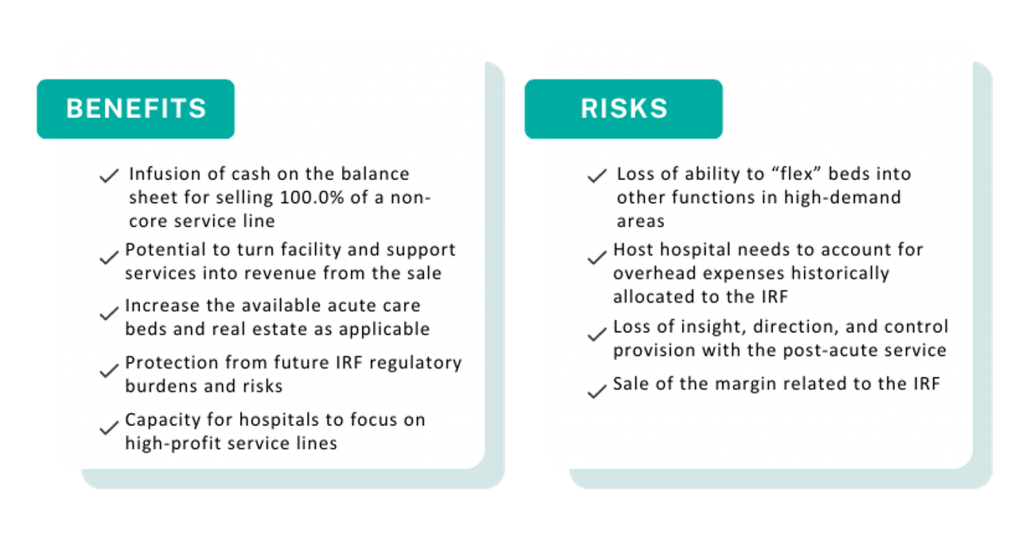
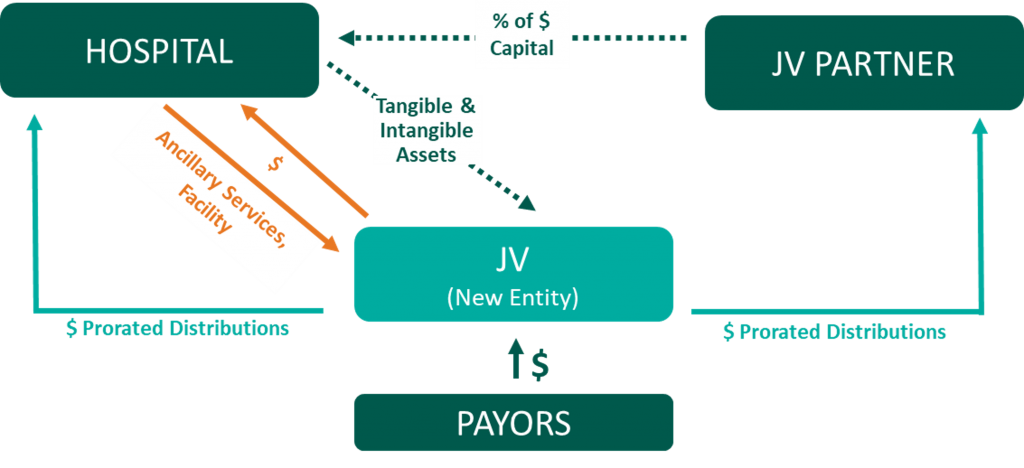
Many of the aforementioned factors turned the IRF industry into an attractive sector for a strategic post-acute investor. For acute care systems, collaborating with a post-acute operator can offer significant benefits, including reducing the length of stay and readmission rates, and providing access to clinical and operational best practices. Collectively, these enhancements improve both patient outcomes and financial returns. We have identified several affiliation models for post-acute and IRF unit operators, as well as advantages and disadvantages to consider for each model.


A post-acute care strategy is vital for acute care providers seeking to elevate patient outcomes while maximizing value to their organization. Forming strategic alliances with post-acute operators in inpatient rehabilitation may be one successful approach. Operators have many avenues to consider whether it is through the sale of an existing inpatient rehabilitation unit, joint venturing with a partner to create a de novo freestanding IRF, or employing a post-acute manager to drive performance in an existing IRF. No matter your path forward, VMG Health experts can provide actionable insights into the value of your existing IRF business and assist with a potential IRF partnership in a model that fits your post-acute strategy.
Sources
Written by James Tekippe, CFA and Zach Strauss
For those in the healthcare industry, telemedicine has been viewed as a way to increase access to healthcare, while mitigating the challenges of limited resources of physicians and healthcare providers. Although the use of telehealth has steadily grown over the past two decades, the challenges presented by the COVID-19 pandemic supercharged this growth. As the United States and the world move beyond the worst months and years of the pandemic, telemedicine usage will continue to change within the industry. This article will explore the state of telehealth immediately prior to and during the early years of the pandemic to provide context for the question, “What will be the next stage of telemedicine in the U.S. healthcare system?”
Prior to the COVID-19 pandemic, many people in the industry believed telemedicine had the potential to make healthcare more accessible, especially for underserved communities. However, in 2016 only 15% of physicians worked in healthcare practices that used telemedicine in any fashion.1 Part of why utilization was low pertained to reimbursement rates. Physicians who utilized telemedicine were not reimbursed at the same level by Medicare as in-person services, and only a limited amount of visit types provided through telemedicine were reimbursable.2,3 In addition, Medicare outlined certain stipulations that allowed providers to use telemedicine for care, including requiring that the provider had a pre-existing relationship with a patient, limiting a provider to only providing services at the practice where they typically provided in-person services, and necessitating the provider was licensed and physically in the same state as the patient being treated.2,4 Finally, the technology used to provide telemedicine had to meet the requirements of the Health Insurance Portability and Accountability Act (HIPAA), which required providers to invest in compliant technology to be able to offer care using telemedicine.5
During 2020, the COVID-19 pandemic became a catalyst that rapidly changed the direction of telemedicine in the U.S. From February 2020 to February 2021 telehealth claims volumes increasing 38x year over year.6 As the world, began implementing lockdown orders in February and March 2020 to limit the spread of COVID-19, legislators in the U.S. looked for a solution to assist the public in accessing the healthcare system while mitigating the public’s fear of contracting this virus. Various solutions were enacted as part of the CARES Act, which was passed in March 2020. These solutions were aimed at increasing the use of telemedicine by healthcare providers. Through CARES, many of the barriers that previously made it harder for providers to adopt the usage of telemedicine were relaxed. This created an unprecedented opportunity for providers to explore the capacity of this medium of care.
First, Medicare changed reimbursement for telemedicine visits to be the same as in-office visits.3 Additionally, physicians were given the ability to reduce, or even fully waive, the Medicare patient cost-sharing for telehealth services which made telemedicine more attractive to patients.3 The CARES Act also removed location barriers and made it possible for providers to see patients who were in different states from the provider during a visit.2 The CARES Act also allowed healthcare providers to offer more types of visits through telemedicine means, like emergency department visits, remote patient monitoring visits, and check-in visits.2 Additionally, providers who historically were not able to provide care through telemedicine, like occupational therapists and licensed clinical social workers, were able to use telemedicine as an option to treat patients.4 Finally, technology HIPAA requirements were relaxed such to allow more two-way audio-visual options, such as Facetime, Skype, Zoom, and audio-only telephonic services for telemedicine visits. This realty increased the ability for providers to offer this service to their patients.2, 5
As the country moves beyond the public health emergency COVID-19 created, the future of telemedicine will depend on whether = regulations revert back to the pre-COVID state. States across the country, from Washington to New Hampshire to Virginia, are introducing legislation to expand telemedicine beyond the CARES Act.7 Despite different geographical locations and political leanings, states seem to agree about telemedicine’s ability to increase access to healthcare. For example, Oregon has introduced legislation to permanently allow out-of-state physicians and physician assistants to provide specified care to patients in Oregon.7 Texas has proposed legislation that would remove the requirement of being “licensed in this state” from an array of licensing and practice requirements for providers to practice telemedicine in the state.7 Virginia has also proposed legislation that offers a solution for telemedicine service provider groups that employ health care providers licensed by the Commonwealth. The legislations would establish that these groups do not need a service address in the Commonwealth to maintain their eligibility as a Medicaid vendor or provider group.7
At the national level, two active bills, HR 4040 and HR 1110, both contain pro-telemedicine legislation. HR 4040, passed by the House in July of 2022, extended certain Medicare telehealth flexibilities beyond the end of the COVID-19 public health emergency (PHE). The bill would allow for Medicare beneficiaries to continue receiving telehealth services in any location they wish until December 31, 2024, or the end of the PHE, whichever comes later..8 In addition, this legislation would continue to grant other healthcare providers, such as occupational therapists and physical therapists, the freedom to continue practicing telemedicine via the CARES Act.8 Finally, behavioral health services, alongside evaluation/management services, would still be allowed via audio-only technology.8 Within the industry, this bill has seen support, specifically from the American Telemedicine Association and the American Counseling Association.7, 9
HR 1110 is a report commissioned by Congress with the explicit purpose of expanding access to telehealth services to Medicare and Medicaid beneficiaries.10 Under this legislation, Congress would require that two reports be provided, one by the U.S. Department of Health and Human Services, and the second by the Medicaid and CHIP Payment and Access Commission (MACPAC) and the Medicare Payment Advisory Commission (MedPAC).10 In the report led by HHS, Congress would require HHS to provide a comprehensive list of telehealth services available during the PHE. This report would include details about the types of providers that could supply these services, a comprehensive list of actions the secretary of the HHS took to expand access to telehealth services, and the reasons for these actions.10 Additionally, this report would require a quantitative and qualitative analysis of the previously mentioned telehealth services, specifically calling out data regarding use by rural, minority, elderly, and low-income populations.10
Regarding the MedPAC and MACPAC report, Congress would require an assessment of the improvements or barriers in accessing telehealth services during the PHE. And in addition, the information MedPAC and MACPAC know regarding the increased risk of fraudulent activity that could result due to expanding telehealth services.10 To conclude the report, Congress has asked both MedPAC and MACPAC to provide recommendations for improvements to current telehealth services and expansions of these services, as well as potential approaches for addressing fraudulent activity previously outlined in the report.10 Ultimately, these reports would be vital in shaping future policies around telemedicine to increase access to and improve the effectiveness of telehealth.
The last few years there have been major changes in many aspects of life, including the ways healthcare is delivered. The U.S. was able to tap into the large potential telemedicine has to offer during the worst stages of the pandemic. However, as we move into the future, it will be important for local and federal governments to continue improving the regulations that impact telemedicine to help expand access.
Written by James Tekippe, CFA, Michael Schenck, and Ryan Diver
The following article was published by Becker’s ASC Review.
The No Surprises Act was a landmark piece of legislation aimed at protecting patients from unexpected medical bills. Although the law is a significant step forward for patient protection, it has resulted in a significant increase in financial support requests from anesthesia providers who serve patients at ambulatory surgery centers (ASCs). This article will outline the hallmarks of the act, its impact, and the operational and compliance considerations for ASCs that need to implement coverage arrangements with their anesthesia groups.
Prior to the No Surprises Act, patients who unintentionally received care from an out-of-network provider could potentially have received a “surprise medical bill” from a facility or provider. This occurred in emergency room situations where the patient had no ability to select the emergency room, physician, or ambulance provider. Additionally, surprise bills resulted from services provided at an in-network facility for a patient but from an out-of-network provider. This was common for services provided by anesthesia, first assist, and radiology providers.
Additionally, healthcare costs and pricing information were often difficult to obtain prior to receiving treatment, and patients frequently faced challenges in understanding the cost implications of their healthcare choices. Moreover, billing disputes between healthcare providers and insurance companies often left patients caught in the middle. Consequently, surprise medical bills could result in higher fees for patients in a couple of ways. First, higher cost sharing between health plans and patients, with most patients having to pay a higher co-pay for out-of-network services. Second, many providers would balance bills, which allowed “the out-of-network provider [to] bill consumers for the difference between the charges the provider billed, and the amount paid by the consumer’s health plan.”
Due to these circumstances, the No Surprises Act was passed as part of the Consolidated Appropriations Act, 2021 and began taking effect on January 1, 2022. Now after a patient receives care, the healthcare provider will verify the patient’s insurance and determine if they are in-network or out-of-network. If the patient receives care from an out-of-network provider at an in-network facility, the patient is only responsible for their in-network cost-sharing amount, such as deductibles, co-pays, or coinsurance. The provider will then bill the insurance for their services. After the insurance company processes the provider’s claim, the patient will then be billed for their responsibility for the in-network cost-sharing amounts. If there is a dispute between the provider and the insurance company regarding reimbursement for out-of-network services, the provider and insurance company may engage in the independent dispute resolution (IDR) process, where an independent arbiter reviews the case and determines the appropriate payment.
The implementation of the act has caused tension between providers and insurers. Prior to the act, many providers had relied on balance billing to generate revenue. Now, not only is this practice illegal in certain scenarios, but insurance companies are typically only willing to pay something near the qualified payment amount (QPA), which is the median rate for those in-network services for the given geographical area. This can neglect crucial factors and can be very different from the amount they were used to receiving. This has resulted in numerous providers and payers entering negotiations and the IDR process.
Given the reduction in billings that some provider groups may be experiencing because of the No Surprises Act, anesthesia groups with coverage arrangements with ASCs have found themselves requesting additional compensation. For some ASCs, this is a request they are grappling with for the first time. It is very important to understand that these arrangements are set at fair market value from a compliance perspective. To help navigate these arrangements, VMG Health has outlined some important factors for ASCs to consider.
When establishing an arrangement for coverage to be supplied by an anesthesia group, it is important for ASCs to understand what level of coverage they will need. This includes a consideration of on-site time needed versus off-site or on-call time. Additionally, it is important to establish the need for medical directorship or other administrative services with a provider group, including an expectation of hours for these roles.
Facilities should consider what types of providers are needed and should confirm with the provider group that this level can be supplied. Leaning on certified registered nurse anesthetists (CRNAs) can be beneficial from a cost perspective for both the provider group and the facility, but the facility should ensure the mix is appropriate for the coverage needed. As provider compensation is typically the largest expense driver in coverage arrangements, it is, of course, important to ensure the right level of expertise is provided. However, the ability to lower provider expenses by leaning on CRNAs should not be overlooked.
As the industry continues to shift towards value-based care, certain quality incentives may be considered for inclusion in a coverage arrangement. Facilities contemplating adding these types of metrics should push for outcomes-based metrics that the providers will have the ability to demonstrably impact. Additionally, facilities should ensure that accurate tracking of outcomes is possible and that targets require the attainment of higher quality versus maintenance of current outcome achievements.
To service a coverage arrangement, provider groups typically will need to incur some additional costs beyond provider comp expenses, including billing and collection expenses and general office support expenses. However, additional requirements might be needed from a facility. Therefore, facilities should work with groups to outline their needs to ensure the provider group is aligned with the expectations under the arrangement beyond the clinical provider requirements.
The No Surprises Act is a major step towards protecting patients from unexpected medical bills, but it presents significant challenges for healthcare providers. Providers must adapt to the new law’s requirements, which can be time-consuming, costly, and complicated. While providers will need to be proactive in addressing these challenges, facilities may be asked to provide further financial assistance in certain arrangements. Having open and thorough conversations about the needs of the facility, while balancing the challenges faced by anesthesia groups, will be an effective way for facilities and providers to continue partnering to provide high-quality care for patients.
By Anthony Domanico, CVA, and Ben Minnis
VMG Health was published in the American Association of Provider Compensation Professionals (AAPCP) 2023 Journal of Provider Compensation. The section, “How to Measure Acuity-Adjusted Panel Size for Contemporary Provider Compensation Plans” was written by VMG Health experts Anthony Domanico and Ben Minnis.
In their section, Domanico and Minnis offer a detailed examination of diverse panel size approaches and important factors to consider when incorporating these metrics into a compensation plan. As organizations take on greater financial responsibilities in payer agreements, it is vital to ensure that incentives harmonize with compensation plans.
The second edition of this journal provides an in-depth analysis of issues such as financial pressures medical groups are facing, optimal timing for adopting a new Medicare Physician Fee Schedule, whether wRVU-based compensation plans remain the guiding principle for employment arrangements, and concerns about the emerging physician shortage. The five articles published in this edition all passed through a rigorous framework to ensure quality analysis.
For additional guidance related to provider compensation design or any other valuation, strategy, or compliance services, our expert Anthony Domanico would be happy to assist. Please email him at anthony.domanico@vmghealth.com to learn more.
By James Tekippe, CFA – VMG Health, and Courtney Stokes, JD, MHSA – Kathleen L. DeBruhl & Associates, LLC
The following article was published in the American Bar Association Health Law Section’s eSource.
Prior to the onset of the COVID-19 pandemic, the issue of career fatigue was already a growing concern for physicians and healthcare systems. In 2018, a survey conducted by The Physicians Foundation reported that 31% of physicians indicated they often have feelings of burnout. Fast forward a few years into the pandemic, and in the 2022 edition of this survey, this number has jumped to 62% of respondents indicating that they often have feelings of burnout. This growth in burnout is a major concern as physician burnout negatively impacts physicians’ well-being, decreases the quality of care physicians provide, and contributes to older physicians retiring earlier than anticipated and younger physicians leaving the field altogether. While many of the reasons for these results were present before COVID-19, the pandemic has brought this discussion into new context and importance.
This is the first in a three-part series on physician career fatigue and mental health issues. This article will examine four of the major causes of career fatigue for physicians: administrative burdens, including those created by the advent of electronic health records (EHRs), the increase in violence in the healthcare setting, the continued industry-wide staffing shortages, and the persisting stigma associated with seeking treatment for a mental health condition or substance use disorder. While there are no simple answers or quick fixes for these issues, this article will include a discussion of potential solutions that various stakeholders around the country are adopting in an attempt to positively address physician career fatigue and burnout.
Written by Haley Condon and Jen Johnson, CFA
The Centers for Medicare and Medicaid Services (CMS) will finalize the rule to establish a “Birthing-Friendly” hospital designation in fall 2023. While the motivation for the designation comes from the White House Blueprint for Addressing the Maternal Health Crisis, it gives hospitals the opportunity to experience a more favorable payor mix in their OB/GYN and laborist programs by improving the quality of care. As a result, we will see hospitals build strategies around incentivizing physicians to help them hit quality targets.
The new designation will be awarded to hospitals that answer “Yes” to both parts of the Maternal Morbidity Structural Measure question. The question focuses on two key points:
With a maternal morbidity rate that increased to 32.9 deaths per 100,000 live births in 2021, it is no surprise that women are conscious about safety and quality when considering where they will give birth [2].
According to a 2018 report, a large majority of mothers used quality care information to help compare facilities and providers when creating their care plans {3]. Additionally, several websites advise the top things to look for when selecting a birthing facility. These sites list many important factors to consider such as the hospital’s quality of care, C-section rates, clinical excellence in labor and delivery, pain relief choices, NICU and emergency capabilities, high-risk services, and the length of stay after birth [4,5,6,7]. These repeated recommendations to evaluate hospitals based on these topics and their overall quality of care demonstrates that mothers want the best care possible for themselves and their children when giving birth. This data shows that when given the choice women are most likely to select a facility recognized for its maternal and fetal safety.
Obtaining a “Birthing Friendly” designation will draw in both mothers and better-contracted rates. According to a Kaiser Family Foundation study, “private insurers pay nearly double Medicare rates for all hospital services, ranging from 141% to 259% of Medicare rates” [8]. Attracting more patients with private insurers is a step toward increasing collections, which is a welcome strategy as many hospitals experienced significant losses in 2022 [9].
In the eyes of patients with commercial payors, hospitals that obtain a designation for high-quality birthing services can cause them to become ideal birthing destinations. In addition, the “Birthing-Friendly” hospital designation provides hospitals the opportunity to increase the value of their services for their patients while taking a financially viable action. The “Birthing-Friendly” hospital designation allows for an intersection between the quality of care and financial motivations. While seeking the designation might allow hospitals to assist their bottom line, it will also provide access to medical care that prioritizes the safety of the mother and child. The designation will inevitably motivate hospitals to integrate value-based metrics into their physician compensation structures.
While value-based care arrangements do not make up most arrangements in the healthcare industry, they are continuing to rise in prevalence. According to a Deloitte survey, 41% of provider organizations’ overall revenue was tied to value-based models, up from 38% in 2020 [10].
Additionally, a 2022 MGMA survey showed that 81.45% of the single specialty physician practices surveyed participated in commercial value-based programs and 85.80% participated in government value-based programs [11]. The increasing push for value-based payment structures is supported by CMS’ goal to have 100% of Original Medicare beneficiaries, and the majority of Medicaid beneficiaries, in accountable care programs by 2030. The Birthing Safe Hospital designation program provides an opportunity for hospitals to develop strong value-based arrangements in their laborist programs by using the designation’s requirements as a guideline.
When considering a value-based compensation arrangement with their physicians, it is important that hospitals ensure their arrangements are consistent with fair market value. This means they will need to select strong, outcome-driven quality metrics if they want to tie financial incentives to these metrics. Selecting metrics that are recognized in the industry and are measurable is the best way to ensure a compliant, successful physician incentive program.
In order to encourage buy-in, physicians should be a part of the selection process when choosing metrics. They will also need to be educated on what makes a strong metric from a valuation perspective. Once the quality metrics have been selected, an analysis should be conducted to ensure any compensation tied to the metrics is consistent with fair market value. The stronger the metrics, the more support can be provided for higher compensation levels.
Factors that make physician-based quality metrics strong include metrics that are outcomes-based, nationally measured, and physician driven. The major value considerations when assessing these arrangements from a fair market value perspective include market data for similar arrangements, historical performance for the service line, and industry-wide benchmarks. A good starting point when developing a program includes metrics that are the current focus of National Perinatal Quality Improvement Programs and other obstetrics quality improvement initiatives. These programs’ metrics include reducing C-section rates for low-risk pregnancies, reducing induced deliveries before 39 weeks, reducing the use of episiotomy, and increasing the percentage of deliveries that have a postpartum visit between seven and 84 days after delivery [13, 14].
CMS plans to award the “Birthing Friendly” designation to facilities that demonstrate a “commitment to the delivery of high-quality, safe, and equitable maternity care” [1]. This new designation will impact reimbursement and will inevitably create new strategies for hospitals attempting to align with their OB/GYNs. As with most physician alignment strategies, financial incentives will likely come into play. VMG Health expects to see quality incentives as part of compensation design initiatives, and a proliferation of service line co-management arrangements in the OB/GYN space. Key components in developing a hospital’s strategy around obtaining this designation will include collaborating with physicians, understanding industry-recognized benchmarks, and assessing market data around these types of incentives.