

Fair Market Value Insights for Multi-Tiered Therapy Service Agreements
Christa Shephard
October 2, 2024

Written by Clark Wilson, CVA; Greg Begun; and Ash Midyett, CFA
In the broadest sense, remote monitoring refers to a physician assessing a patient’s health through the use of a medical device or software while physically away from the patient. There are two main types of remote monitoring: remote patient monitoring (RPM) and remote therapeutic monitoring (RTM). RPM focuses on gathering physiological data from medical devices attached to the patient’s body, while RTM focuses on non-physiological data that is generally self-reported.
As it relates to physical therapy, RTM can be used to treat and monitor a wide range of conditions, including musculoskeletal conditions, respiratory conditions, geriatric conditions like osteoporosis, and others. Given the broad range of RTM services, there is a growing list of software providers targeting specific and use cases. Some of these entrants include Medsien, Owlytics Healthcare, and Zimmer Biomet, all of which have proprietary RTM software platforms.
The clinical advantages of RTM include improved adherence to treatment plans, enhanced recovery speeds, reduced re-injury rates, and increased patient satisfaction and engagement. Reducing the chance of reinjury and the number of post-injury visits may increase member satisfaction while enhancing data collection to improve treatment and outcomes. Practices may also see increased patient volumes through improved patient access to care and diagnostics, while minimizing the need for unnecessary in-person appointments.
As a new method of patient engagement, research on the efficacy of RTM remains limited. While research often considers remote monitoring as an effective method of treatment for many conditions, limited research specific to RTM exists for physical therapy applications. Additionally, critics often cite data privacy concerns as a primary headwind for further industry adoption.
In response to the growing adoption of RPM and RTM, the Centers for Medicare & Medicaid Services (CMS) first introduced CPT codes for RPM in 2018 and for RTM in 2021. Since the CPTs were first introduced, CMS has amended billing rules multiple times in response to the pandemic. As of the 2024 Final Rule, CMS allows for billing “incident to” under the direct supervision of a qualified provider (physical therapists, occupational therapists, and speech-language pathologists). RTM and RPM must also be delivered via an approved medical device (which may include software) as certified by the FDA.
The care lifecycle for RTM can generally be characterized by an initial diagnosis, in person or via a telehealth visit, followed by periodic monitoring of the condition, telehealth check ins, or exercise appointments. A provider must monitor a patient for at least 16 days of a 30-day period. As the typical physical therapy course of treatment can range from a few weeks to a couple months, it is easy to understand how RTM may be worked into the treatment life cycle.
RTM is newer than RPM, and payers have been slower to adopt coverage for RTM services as a result. Approved codes are relatively narrow in the scope of conditions covered. Medicaid coverage varies by state, and many states do not have a clear policy around reimbursement. Similarly, commercial payers have been slow to adopt coverage and are generally less likely to cover RTM than RPM.
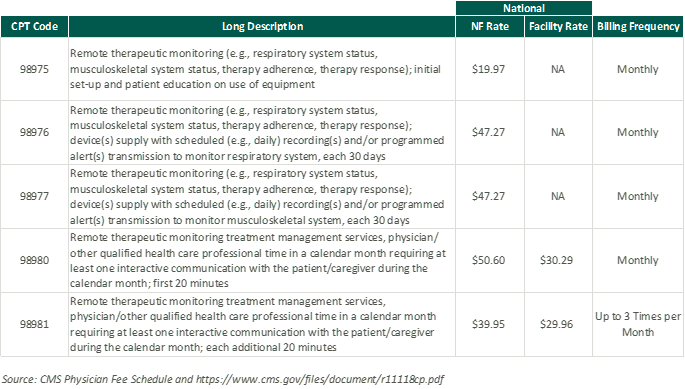
RTM presents a unique opportunity for physical therapy practices to add an additional revenue stream without significant, up-front investment of time or capital and may broaden the practice’s eligible market for care. With the nearly ubiquitous adoption of mobile phones and growing popularization of fitness wearables, the cost of care for physical therapy RPM and RTM is primarily driven by the cost of software to administer the service ($15–$40 per month) and clinician time.
The RTM industry is in the early stage of the industry lifecycle, characterized by fragmentation, high margins, and a robust growth outlook. Current estimates by the Bipartisan Party Center suggest RPM adoption has been limited but is growing quickly, with 594 monthly claims per 100,000 Medicare enrollees as of 2021, which represents a six-fold increase since 2018. It is too early to say whether RTM will follow a similar growth trajectory. Statistics on usage and efficacy remain limited given the novelty of the technology and the fragmentation of its end market. For instance, there are over 37,000 outpatient rehabilitation clinics in the United States with the largest provider only controlling approximately 5% of the market.
In recent years, the adoption of RPM and RTM has been catalyzed by three primary headwinds: technological progress and the proliferation of mobile devices, an industry-wide shift toward value-based care, and the COVID-19 pandemic. For years, insurance payers, regulators, and thought leaders have heralded the adoption of value-based care initiatives to better align the cost of care with improved patient outcomes. RPM and RTM facilitate data collection and may improve patient outcomes while reducing costs through enhanced recovery speed, improved adherence to treatment plans, reduction in re-injury rates, and improved patient satisfaction and engagement. As value-based care continues to gain market share, RTM technology will likely benefit. The confluence of expanded coverage, patient demand, clinical research, and value-based care advocacy will likely bolster RTM adoption among physical therapy providers. While growth projections remain limited, Global Market Estimates predicts annual RTM market growth in the high teens over the coming years. Physical therapy business operators will likely continue to adopt RTM.
Physical therapy and remote patient monitoring. (2022). Telehealth.HHS.gov. https://telehealth.hhs.gov/providers/best-practice-guides/telehealth-for-physical-therapy/physical-therapy-and-remote-patient-monitoring
Saag, JL & Danila, MI. (2022). Remote Management of Osteoporosis. Curr Treatm Opt Rheumatol. DOI: 10.1007/s40674-022-00195-4. Epub 2022 Sep 2. PMID: 36068838; PMCID: PMC9438367.
ROI of RPM CCM and RTM. (n.d.). Humhealth. https://www.humhealth.com/blog/roi-of-rpm-ccm-and-rtm/
Remote Patient Monitoring (RPM) CPT Code Billing Summary. (n.d.). Healthsnap. https://healthsnap.io/resources/rpm-billing-overview/#:~:text=CPT%20Code%20Billing%20Summary&text=In%202018%2C%20CMS%20began%20providing,reimbursement%20associated%20with%20these%20codes.
Centers for Medicare & Medicaid Services (CMS). (2022). CMS Manual System. CMS. https://www.cms.gov/files/document/r11118cp.pdf
CMS.gov. Calendar Year (CY) 2024 Medicare Physician Fee Schedule Final Rule. (2023). CMS. https://www.cms.gov/newsroom/fact-sheets/calendar-year-cy-2024-medicare-physician-fee-schedule-final-rule
Thomas, JJ. (2022). How long is physical therapy session? Primal Physical Therapy. https://primalphysicaltherapy.com/how-long-is-physical-therapy-session/
Curtis, J., et. al. (2024). The Future of Remote Patient Monitoring. Bipartisan Policy Center. https://bipartisanpolicy.org/report/future-of-remote-patient-monitoring/
U.S. Physical Therapy (USPh). (2024). USPh IR Presentation Q1 2024. U.S. Physical Therapy. https://www.usph.com/wp-content/uploads/2024/05/USPH_IR_Presentation_Q1_2024_FINAL.pdf
Global Market Estimates (GME). (2024). Global Remote Therapeutic Monitoring Market Size. Global Market Estimates. https://www.globalmarketestimates.com/market-report/remote-therapeutic-monitoring-market-3954#:~:text=The%20global%20remote%20therapeutic%20monitoring,getting%20infected%20by%20the%20virus
Written by Christa Shephard
The Outpatient and Ambulatory Surgery Consumer Assessment of Healthcare Providers and Systems (OAS CAHPS) will be mandatory for ambulatory surgery centers (ASCs) and hospital outpatient departments (HOPDs) starting January 2025. The OAS CAHPS survey gauges patient satisfaction in Medicare-certified HOPDs ASCs, focusing on areas such as communication, care quality, and facility conditions.
The OAS CAHPS survey helps HOPDs and ASCs improve patient care and remain compliant with the Centers for Medicare & Medicaid Services’ (CMS’) regulations. The objective data collected from these surveys directly impacts public perception of outpatient healthcare facilities and empowers consumers to make informed choices between HOPDs and ASCs. Beginning in January 2025, ASCs that fail to participate could see a cut in their reimbursement rates.
Voluntary participation in OAS CAHPS began with calendar year 2024, and mandatory participation begins with calendar year 2025. Participants may choose between mail-only, telephone-only, and mixed-mode (email with mail or telephone follow-up) administration with an annual target of 200 completed surveys for ASCs.
The survey covers critical aspects of patient care:
An ASC is eligible to participate in the OAS CAHPS Survey if it meets all of the following criteria:
Patients are eligible to participate in the OAS CAHPS survey if they:
Certain exemptions from participation will apply. ASCs that serve fewer than 60 OAS CAHPS survey–eligible patients in the year prior to the data collection year for the applicable payment determination qualify for a participation exemption. When an ASC qualifies for an exemption from the ASC Quality Reporting (ASCQR) program because it had fewer than 240 Medicare claims in the year prior to the data collection year, it also qualifies for an exemption from the OAS CAHPS survey for the same period.
ASCs should start aligning their operations with OAS CAHPS guidelines by improving patient communication strategies, optimizing pain management protocols, and maintaining high standards of cleanliness. No ASC can administer the survey itself; OAS CAHPS must be facilitated by a CMS-approved vendor. ASCs that have not begun the process of vetting, selecting, and engaging a CMS-approved vendor to administer the survey should begin as soon as possible.
Once you’ve engaged a vendor, they should walk you through the steps to register for user credentials on the OAS CAHPS web portal and complete the CCN registration from your customized dashboard. Then, you will select and authorize your CMS-approved survey vendor to submit OAS CAHPS data on your behalf. Your vendor will confirm submission dates for monthly data files, complete a data collection and activities timeline per CMS guidelines based on your ASC’s mode of administration, and submit the data files to the OAS CAHPS data center via the survey website by the second Wednesday of January, April, July, and October.
ASCs cannot:
However, ASCs can include the following messaging:
It is essential for ASCs to begin the process of selecting and engaging a CMS-approved vendor to administer the OAS CAHPS survey. Educating staff on communication guidelines that align with these standards is key to ensuring compliance. By preparing now, ASCs can establish effective processes, enhance patient communication, and ensure a smooth transition when the requirements take effect.
Stay informed and ensure your ASC is ready for the future by understanding the OAS CAHPS survey and its impact on your practice. Watch Progressive Surgical Solutions’ on-demand webinar to ensure your ASC has the knowledge and tools to stay ahead of the curve.
Written by Ingrid Aguirre, CFA; Don Barbo, CPA/ABV
A solvency opinion is a professional assessment of a company’s financial health, specifically its ability to meet its long-term obligations. This opinion evaluates whether a company is solvent—meaning its assets exceed its liabilities—based on both current and projected financial conditions and that it has the ability to pay its obligations within a specified amount of time if required by lenders. A solvency opinion serves as a critical tool in corporate finance and transactional contexts, providing stakeholders with confidence in a company’s financial viability.
Solvency opinions are vital for ensuring compliance with various legal and regulatory requirements. They assure boards of directors, shareholders, and lenders that financial decisions—such as mergers, acquisitions, and dividend distributions—are made with a clear understanding of the company’s financial standing.
By obtaining a solvency opinion, companies can mitigate risks associated with potential insolvency claims. A well-supported opinion can protect directors and officers from liability by demonstrating that they acted in good faith and made informed decisions based on sound financial analysis.
A credible solvency opinion enhances transparency and builds trust among investors, creditors, and other stakeholders. It reassures them that the company is on solid financial footing, thereby facilitating smoother transactions and negotiations.
In a litigation context, solvency opinions play a pivotal role.
If a company faces lawsuits related to insolvency, such as fraudulent transfer claims, an independent solvency opinion can serve as a robust defense. It provides evidence that the company was solvent at the time of the transaction in question, helping to protect against accusations of misconduct.
Solvency experts can be called to provide testimony in court, explaining the methodologies and analyses that led to the solvency opinion. Their insights can clarify complex financial matters for judges and juries, lending credibility to the company’s position.
In disputes involving insolvency, a well-prepared solvency opinion can facilitate settlement discussions. It provides a factual basis for negotiations, helping to establish fair terms based on the company’s actual financial situation.
VMG Health provides comprehensive solvency opinions tailored to your specific needs. Our team of financial experts uses rigorous analysis and proven methodologies to ensure our opinions stand up to scrutiny, both in and out of the courtroom.
Our services include:
Secure your company’s financial future and protect your interests with a reliable solvency opinion from VMG Health. Contact us today and discover how we can help you navigate the complexities of financial integrity and legal compliance.
Hayes, A. (2024). What Is Solvency? Definition, How It Works With Solvency Ratios. Investopedia. https://www.investopedia.com/terms/s/solvency.asp
Jacobsen, C. (2018). Solvency Opinions: Legal Insights and Best Practices for Valuation. BV Research Pro. https://www.bvresources.com/articles/training-event-transcripts/solvency-opinions-legal-insights-best-practices-for-valuation
Jacobson, C. A., & Selbst, S. B. (2014, July 9). BVR’s Advanced Webinar Series on Valuations for Business Transactions: Part 1: Solvency Opinions [Webinar]. Business Valuation Resources LLC.
Written by Christa Shephard
As artificial intelligence (AI) surges forward as a useful tool in all sectors, its transformative impact is especially noteworthy in healthcare. Hospital management has undergone an overhaul with the implementation of AI-powered solutions, which automates repetitive tasks like scheduling, billing, and record-keeping to reduce administrative burden and prevent errors. While AI might seem like magic, its impact on hospital management is grounded in data-driven algorithms and practical applications that enhance efficiency and decision-making.
AI-powered tools are helping hospitals maintain compliance by improving billing and coding accuracy, but they’re also doing the heavy lifting when it comes to decision-making. These tools analyze vast amounts of data in seconds to provide evidence-based recommendations and identify patterns that might not be immediately apparent to clinicians. Through pattern recognition and predictive analytics, AI-driven solutions identify compliance risks and anomalies in billing and coding, helping hospitals stay compliant with regulations and avoid costly errors.
Issues with regulatory compliance can significantly impact hospital revenue and patient outcomes. Non-compliance with healthcare regulations, such as improper billing or coding errors, can lead to financial penalties, reduced reimbursements, and even legal actions. All of these consequences directly impact a hospital’s bottom line. Beyond financial losses, these compliance lapses erode trust with patients and payers, leading to reputational damage and a decline in patient volume. Regulatory issues often correlate with lapses in patient care standards, potentially compromising patient safety and outcomes. Ensuring strict adherence to regulations is essential for maintaining financial stability and for upholding the quality of care that patients receive.
These challenges are often the result of human error, which has been somewhat inevitable up until the implementation of AI-driven solutions in hospitals. With new software solutions designed to automate repetitive tasks, hospitals can take a proactive approach to mitigating compliance and audit risk.
AI-powered tools not only boost efficiency by streamlining processes and reducing the manual workload, but they also help save hospitals significant amounts of money. Automating routine tasks like scheduling, billing, and administrative duties allows hospital staff to focus on higher-value activities, improving both operational flow and patient care. By eliminating the need for manual interventions, AI-driven systems reduce the risk of human error, leading to fewer costly mistakes and enhanced overall productivity, ensuring day-to-day operations run more smoothly.
In addition to driving efficiency, AI enhances accuracy in billing and compliance, which can further reduce financial risk. AI-driven systems quickly analyze large datasets to identify potential discrepancies in billing, ensuring compliance with regulatory standards and avoiding penalties. This level of accuracy minimizes revenue loss from overlooked billing errors. Additionally, AI provides actionable, data-driven insights that enable healthcare providers to optimize their financial performance. These insights improve patient outcomes while identifying cost-saving opportunities, making AI an indispensable tool in maintaining a competitive edge while reducing operational expenses.
VMG Health is proud to offer AI-powered solutions that proactively identify and eliminate compliance risk, alleviate the burden of some manual tasks, and offset their own cost by minimizing costly mistakes. Our Compliance Risk Analyzer (CRA) suite offers cutting-edge solutions designed to safeguard revenue and minimize regulatory exposure. It uses predictive analytics to identify potential areas of compliance and audit risk, empowering hospitals to take a proactive approach in mitigating costly mistakes—as opposed to having to react after those mistakes have been made.
CRA, combined with our coding audit experts, streamlines risk mitigation and creates an action plan for hospital teams, providing the option to fully outsource audit departments. Our tool’s easy implementation and user-friendly interface ensures hospital staff can quickly train and grow comfortable using it.
VMG Health offers two CRA tools to meet hospital management needs: CPT and DRG. Our CPT tool is designed to assess compliance risks associated with Current Procedural Terminology (CPT®) coding, ensuring accuracy and adherence to standards. The DRG tool specializes in managing compliance risks related to Diagnosis-Related Group (DRG) coding, providing a targeted approach for inpatient settings. Each solution offers a specialized solution to enhance compliance and efficiency.
Hospital management is fraught with repetitive tasks, compliance risk, and difficult decision-making. Alleviating these challenges empowers hospitals to enhance their operational efficiency, allow staff to focus on higher-value responsibilities, proactively identify and eliminate compliance risk, and boost their bottom line. AI-powered solutions like CRA pay for themselves when they identify risk areas like undercoding, which can often uncover significant savings.
While AI might seem like magic, its real power lies in the practical, data-driven insights it provides, enhancing hospital management and streamlining operations. Consider AI-powered solutions for your hospital. VMG Health’s Compliance Risk Analyzer suite is tailored to meet your needs. Protect your organization from audit risks, capture every dollar of revenue owed, and ensure compliance with VMG Health’s Compliance Risk Analyzer suite. Contact our Coding Audit & Compliance experts to learn more about our state-of-the-art solutions.
Written by Nicole Montanaro, CVA
The following article was published by the American Association of Provider Compensation Professionals (AAPCP).
Following the introduction of the Final Rules by the Department of Health and Human Services (HHS) at the beginning of 2021, VMG Health has seen a growing number of organizations prioritizing their value-based care (VBC) strategy through the creation of value-based enterprises (VBEs) and/or structuring arrangements in accordance with the safe harbor framework of the Final Rules. These value-based exceptions and safe harbors are intended to advance the transition from volume to value by allowing for more flexibility in structuring compliant arrangements. Since physicians are often the cornerstone of any VBC strategy due to their ability to drive savings and clinical quality, this added flexibility of the Final Rules has prompted many healthcare leaders to revisit and modernize their physician alignment models.
With the unwavering prominence of VBC in the market, there are already numerous alignment strategies where healthcare providers enter into value-based arrangements with physicians to improve clinical quality outcomes, coordination of care among providers and across care settings, and cost efficiencies in exchange for an incentive or bonus payment that is subject to performance metrics. In some cases, healthcare providers like hospitals and health systems are internally creating and self-funding these programs in anticipation of future changes to reimbursement. While in other cases, healthcare providers may already have payer contracts in place where they are eligible for value-based reimbursement and may want to share a portion of the incremental reimbursement and shared savings payments with the physicians who contributed to this achievement.
Regardless of the alignment vehicle, when structuring these arrangements with physicians, it is critical to ensure regulatory compliance, and one of the common themes in the Final Rules is the legitimacy of the performance metrics that will be used to trigger value-based payments. Specifically, there is an emphasis on clinical quality outcomes metrics and clinical evidence or credible medical support for these metrics. Additionally, from a valuation firm’s perspective, the credibility of the metrics is one of the primary value drivers in supporting value-based payments to physicians. The following provides insight on things to consider when selecting performance metrics for value-based arrangements and outcomes-based payment arrangements from a valuation firm’s perspective.
It is important to prioritize the selection of the metrics when structuring new arrangements or dusting off old arrangements. The performance metrics should be aligned with the value-based goals of the arrangement to create a meaningful and impactful program and support regulatory compliance. Additionally, from an FMV perspective, having a substantive set of metrics is a key factor in supporting or justifying value-based payments to physicians. Performing an FMV assessment helps to mitigate compliance risks and supports equitable payment models that reward physicians for their level of contribution toward achieving the value-based goals.
When it comes to determining the FMV of value-based payments to physicians, it is important to note that there is generally more flexibility if the payments can be tied to an external third party (such as effectively being funded by value-based reimbursement from a governmental or commercial payer). However, if the program is self-funded, there is generally more risk from a compliance perspective, so these programs may require more intense consideration of certain attributes of the subject program, such as the specific metrics to be utilized, to bolster support for the value-based payments.
Industry research related to value-based payment models in the market and regulatory guidance has consistently revealed the importance of key, metric-related attributes when structuring value-based payment arrangements with physicians. The following summarizes some of these key factors:
Analyzing the industry research from a valuation perspective, factors such as paying for the achievement of “superior” performance standards (typically consistent with the national top decile) and selecting physician-driven, patient clinical quality outcomes metrics that are supported by credible, medical evidence can help to justify higher value-based payments to physicians.
Total Your Points to See How Your Metrics Score
A = 10 points
B = 5 points
C = 0 points
A. Yes
B. Some
C. No
2. Has management considered the needs of the facility and/or patient population in the selection of the metrics?
A. Yes
B. Some
C. No
3. Are the selected metrics supported by credible, medical evidence for improving quality, efficiency, and patient outcomes?
A. Yes
B. Some
C. No
4. Do the selected metrics overlap with or duplicate any services required under medical staff bylaws and/or other arrangements?
A. No
B. Some
C. Yes
5. Has management established meaningful performance targets for each metric that are difficult to achieve or based on a material improvement from baseline performance (i.e., stretch goals versus maintenance goals)?
A. Yes
B. Some
C. No
6. Is achievement of the selected metrics expected to improve your organization’s performance under value-based arrangements with payers (i.e., will it generate value-based reimbursement for your organization from payers)?
A. Yes
B. Some
C. No
7. Is achievement of the selected metrics expected to generate quantifiable savings on the total cost of care for your organization or for payers?
A. Yes
B. Some
C. No
8. Are the selected metrics outcomes-based (i.e., patient clinical quality outcomes)?
A. Yes
B. Some
C. No
9. Are the selected performance targets for each metric sourced from industry-recognized or national databases (versus internally derived or self-created)?
A. Yes
B. Some
C. No
10. Are the maximum performance targets for each metric consistent with or better than what is considered “superior” level of performance (often consistent with national top decile)?
A. Yes
B. Some
C. No
This article is not intended to be, nor should it be used as, a substitute for legal, valuation, or regulatory advice.

85 Fed. Reg. 77492 (Dec. 2, 2020) (CMS Final Rule); 85 Fed. Reg. 77684 (Dec. 2, 2020) (OIG Final Rule).
Written by Ash Midyett, CFA; William Teague, CFA, CVA
After a multi-year drought, the healthcare services industry has helped lead the way in re-opening the initial public offerings (IPO) market, contributing half of the top 10 largest IPOs of the year. In July alone, Ardent Healthcare (ARDT) and Concentra (CON) filed back-to-back IPOs, raising $192 million and $529 million respectively. Ardent Healthcare marks the first traditional health system to IPO in decades, and in this article, we will discuss the company’s performance and offering compared to that of its public peers.
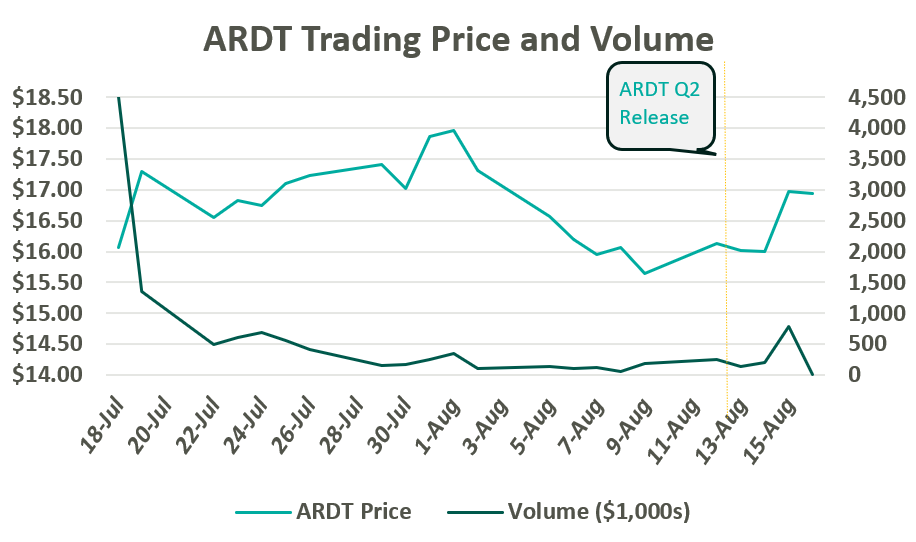
On July 19, Ardent Healthcare listed 12 million common shares on the New York Stock Exchange at $16 per share. After accounting for options granted to underwriters, the proceeds generated $209 million, which is expected to be allocated towards debt repayment and future acquisitions. The IPO marks a notable downshift from their initial price target of $20-$22 per share. Since trading, ARDT moved up toward a peak close of $17.97 before returning to $16.00 per share following a global market sell-off in the first week of August. Following Ardent Healthcare’s Q2 Earnings release on August 14, their shares jumped 6% to $16.97.
Since the company’s founding in 2001, Ardent Healthcare has grown into the fourth largest, for-profit hospital operator and healthcare services provider in the United States. The company currently operates 30 acute care hospitals and over 200 sites of care. Its market footprint spans eight mid-sized, urban markets across six states: Texas, Oklahoma, New Mexico, New Jersey, Idaho, and Kansas.1,2
Ardent Healthcare is listed as a “Controlled” company, meaning control and shareholder rights are concentrated with the company’s private equity sponsor, EGI-AM Investments, L.L.C. EGI-AM Investments acquired Ardent Healthcare in July 2015 and has since supported an aggressive business development strategy characterized by scale and leverage. From 2015 to 2018, Ardent Healthcare nearly tripled its operating revenue through the acquisition of 16 hospitals and 95 other sites of care while generating margins between 6% and 10%. While Ardent Healthcare aggressively expanded its footprint, the company simultaneously divested most of its real estate to an affiliated REIT, Ventas, Inc.
Ardent Healthcare’s inorganic growth is primarily attributable to three large joint ventures, which exemplify the company’s established business development strategy. In March 2017, Ardent Healthcare acquired five hospitals from LHP Hospital Group, Inc. and, in turn, established a joint venture with the University of Kansas Health System. The acquisition was quickly followed by the acquisition of St. Francis Health Center in Topeka, KS in May 2017. Within a year, Ardent Healthcare made its largest acquisition to date and acquired a majority stake in 10 hospitals and 39 clinics from East Texas Medical Center Regional Healthcare System, a subsidiary of the University of Texas Health System during March 2018.
All three acquisitions adhere to Ardent Heathcare’s purported strategy of founding joint ventures with established, not-for-profit and academic health systems located within growing, mid-sized markets.
During its expansion period, the Company sold off most of its real estate to Ventas, Inc. and other affiliated REITs while paying out significant distributions to shareholders. In July 2015, Ardent sold the real estate for 10 acute-care hospitals to Ventas for $1.75 billion, shortly followed by a special distribution of $500 million to shareholders. Between 2018 and 2020, Ardent Healthcare sold off the real estate for 14 skilled nursing facilities and the three more acute-care hospitals for a total of $1 billion. Meanwhile, Ardent Healthcare paid out an additional $950 million in special dividends.
Real estate lease backs are nothing new to the healthcare services industry, but Ardent Healthcare marks the first publicly traded healthcare services company to pursue this strategy at scale. The cash infusion from the sale represents an opportunity to optimize capital structure via debt repayment, reward shareholders, and equip the company with dry powder to pursue future acquisitions. Meanwhile, real estate can trade independently with the oversight of a specialized management team. However, the lease backs also add operational leverage, adding a fixed rental expense to the income statement, similar to fixed interest on a loan.
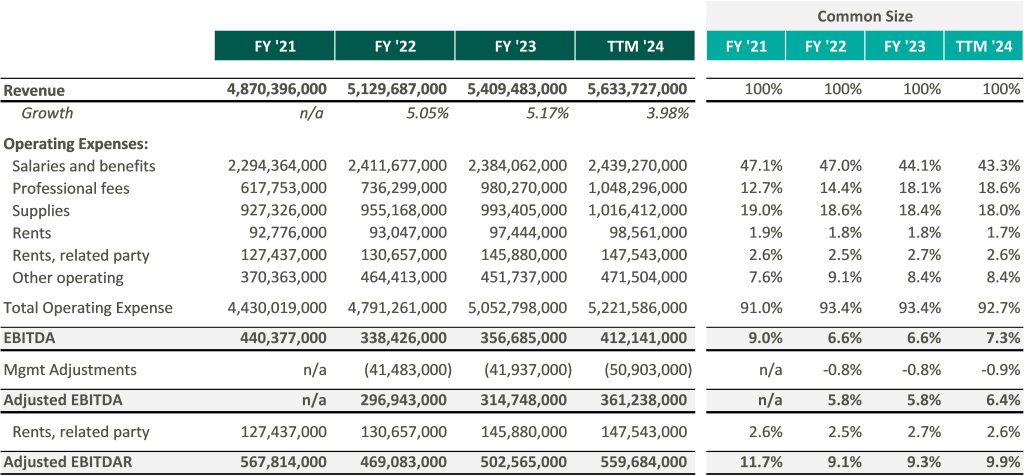
In recent marketing materials, Ardent Healthcare has advocated for analysts and investors to consider their valuation in relation to its EBITDAR multiple rather than EBITDA because of its unique expense structure. However, after accounting for rental expenses, Ardent Healthcare’s margins fall below those of its peers thereby increasing free cash flow volatility.3
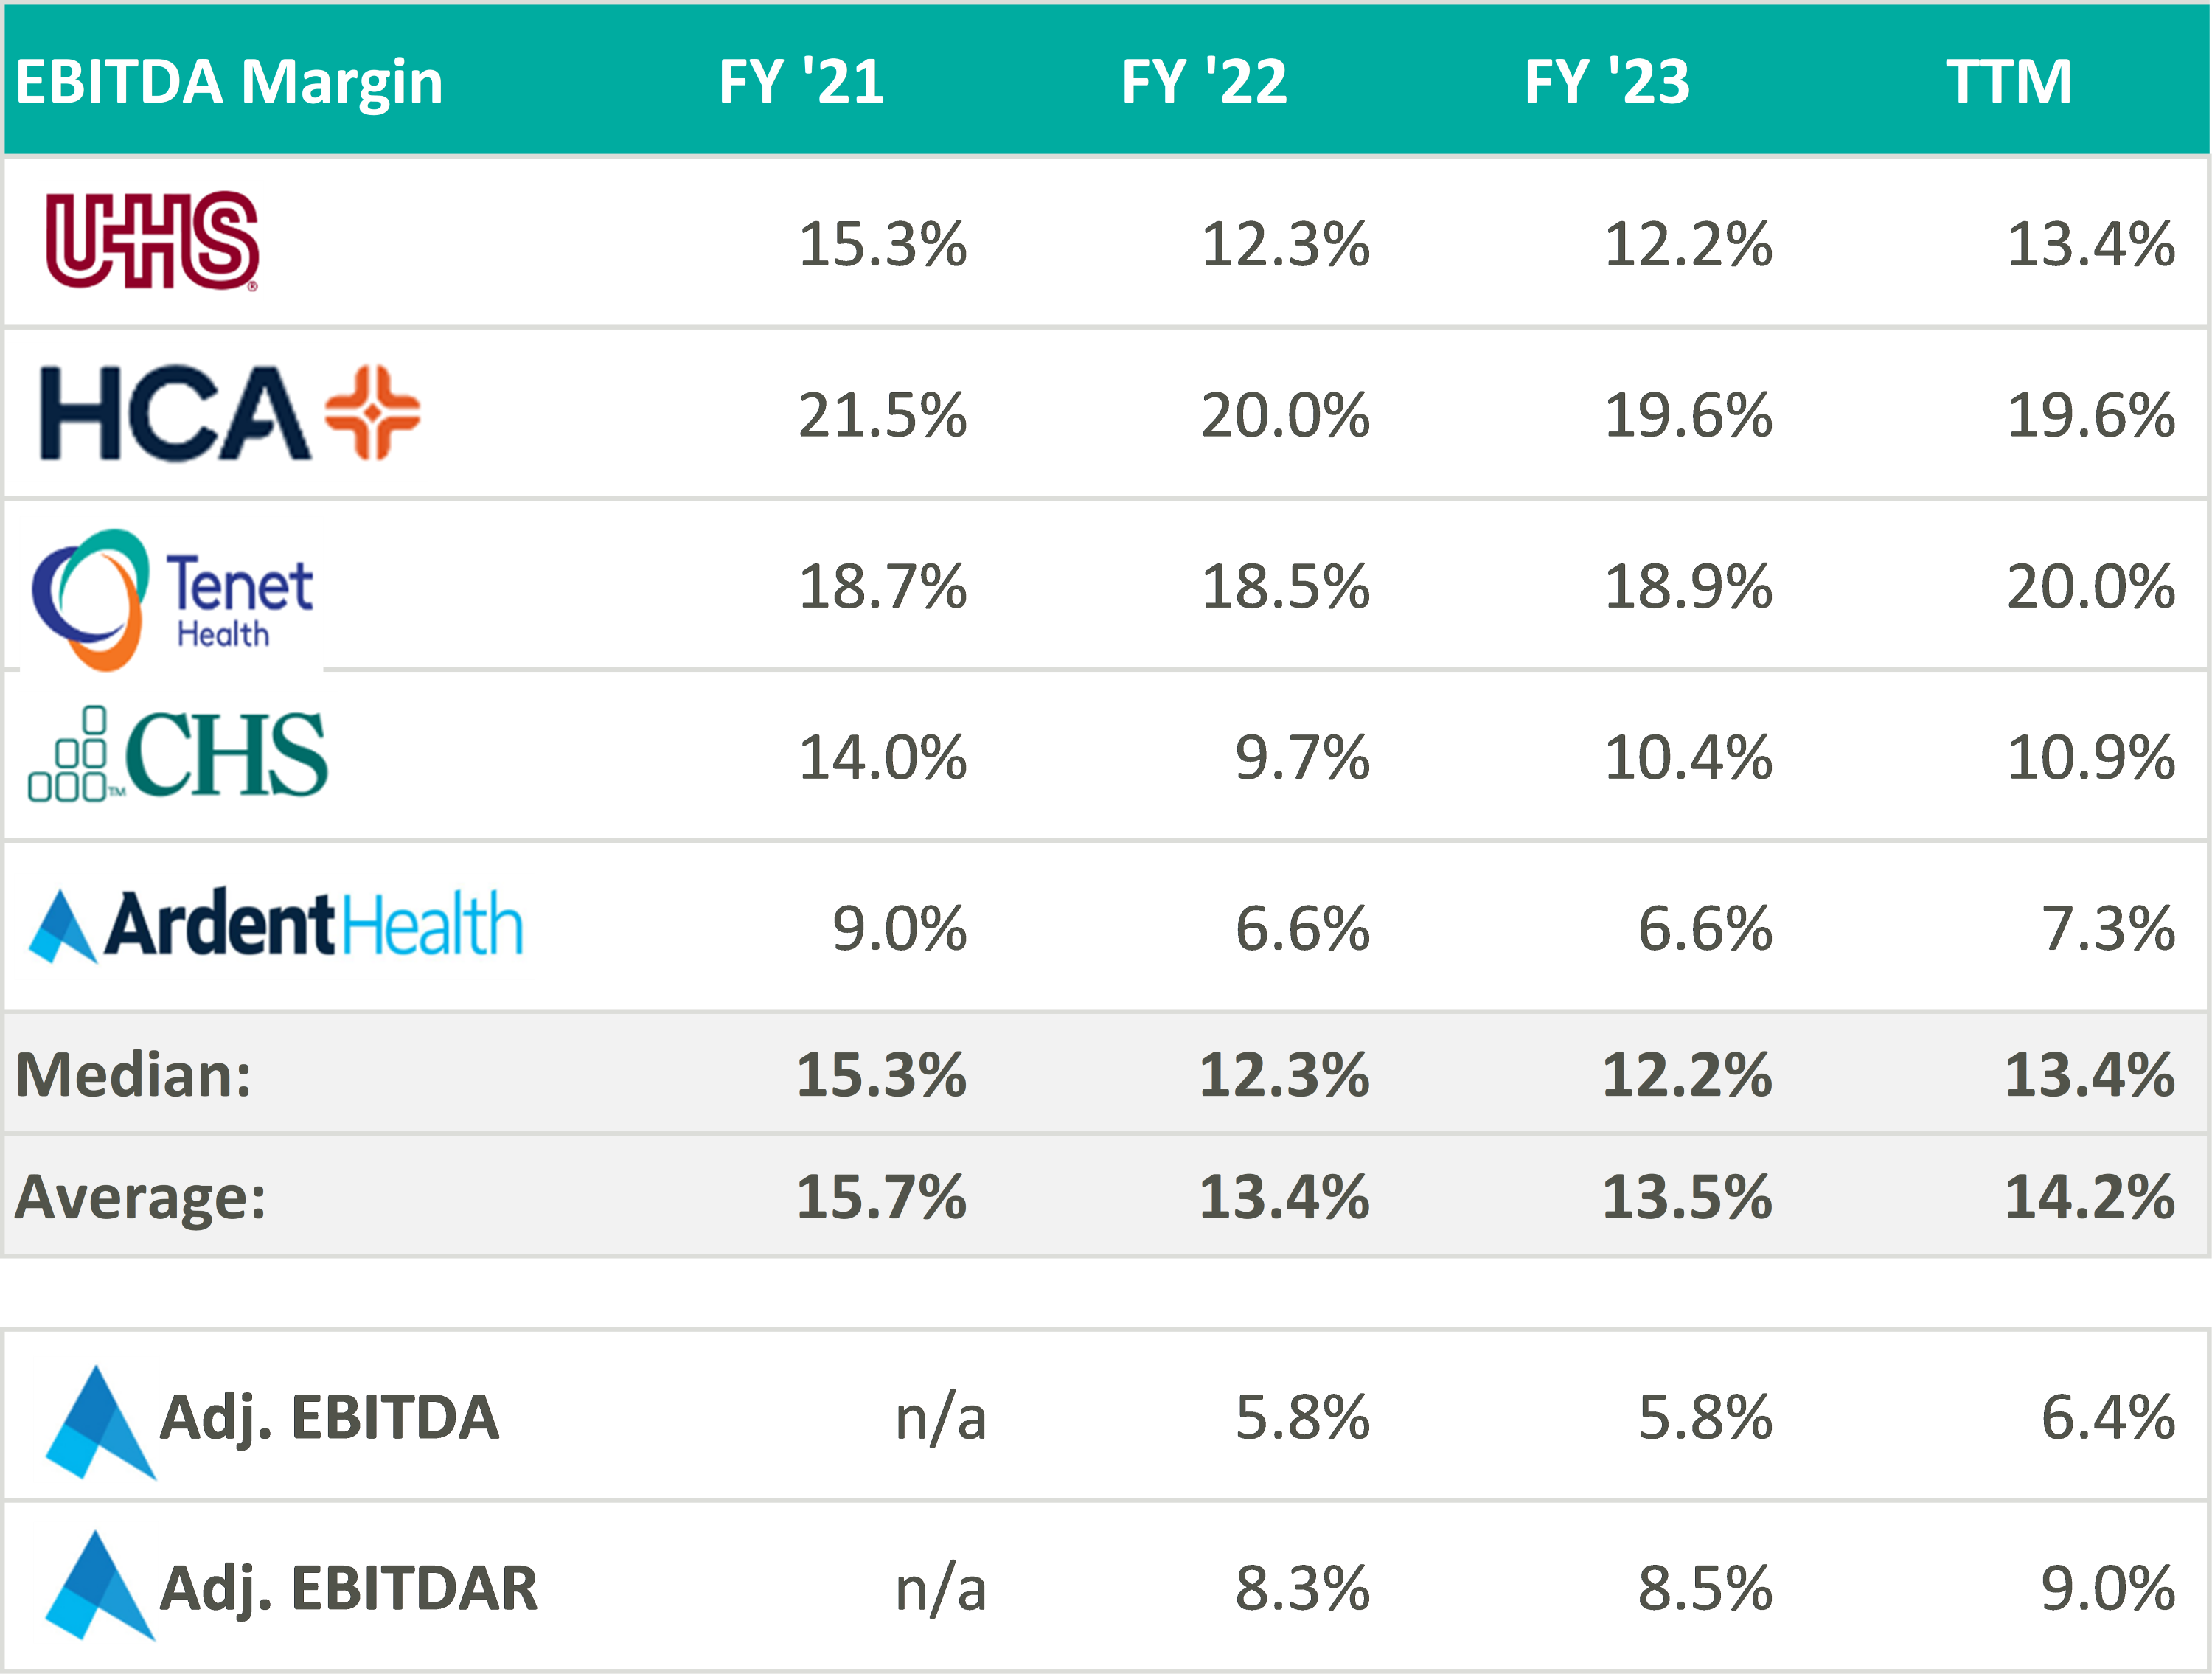
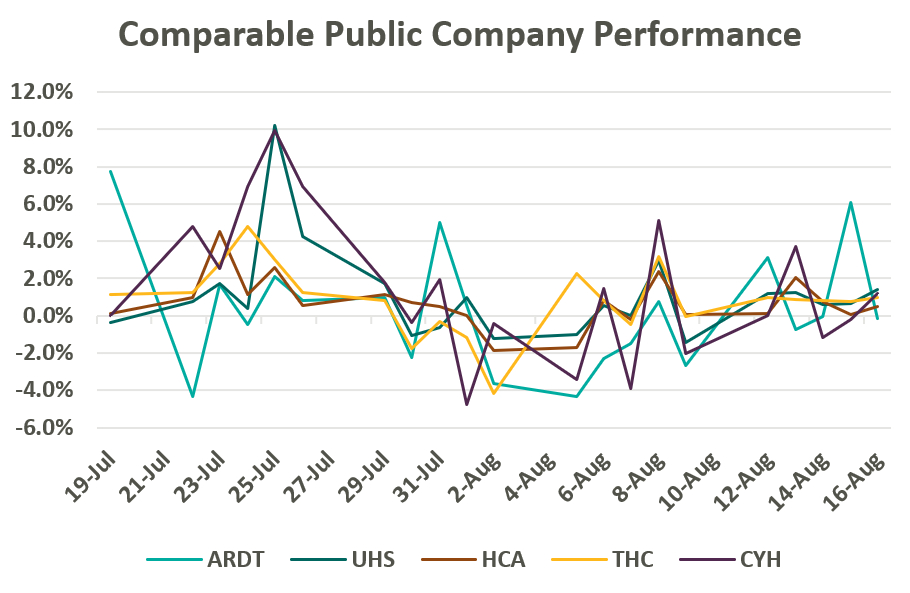
Despite lower margins and a higher-risk balance sheet, Ardent Healthcare’s implied trading multiple remains in line with its peers (or above after management adjustments to EBITDA): United Health Services (UHS), HCA Healthcare Inc. (HCA), Tenet Healthcare Corporation (THC), and Community Health Systems (CYH). As of August 19, Ardent Healthcare’s market capital roughly implies a 9.5x reported EBITDA multiple compared to the peer group median of 9.3x reported EBITDA.4
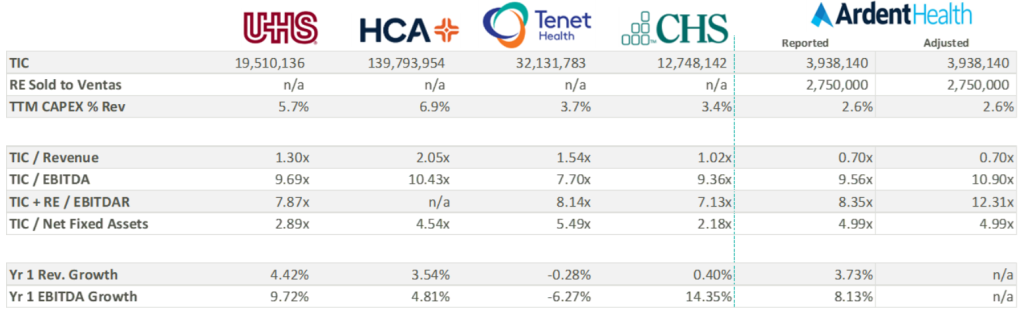
Over the three most recent fiscal years, Ardent Healthcare has reported capital expenditures well below those of its peers. All things equal, a lower capital expenditure increases cash flow to equity and thereby increases valuation—not to mention bolstering distributable free cash flow for shareholders. While some of the discrepancy in capital expenditure may be attributable to Ardent Healthcare’s asset light balance sheet, Ardent Healthcare’s lease agreement with Ventas stipulates a triple net lease obligation. It is possible that the company may be beholden to higher capital investment in the coming years, decreasing cash flow and shareholder value.
Perhaps more important to value is the company’s growth expectations, which currently appear elevated compared to peers. As seen in the table above, analysts are anticipating an 8% increase in EBITDA over the coming year compared to the peer group median of 5.5%. Three-year growth expectations considerably outpace peers as the company gains scale and increases revenue.
Ardent Healthcare’s growth strategy, outlined in its recent S-1 filing, will be key to growing market share, scale, and margin to best compete and grow into its current valuation. Specifically, Ardent Healthcare’s inorganic growth strategy remains focused on expanding its portfolio of joint ventures and has identified an addressable market of nearly 350 mid-sized, urban communities. Ardent Healthcare also intends to embolden its ACO participation and value-based care programs while accelerating their ambulatory and physician alignment initiatives (with eight new ambulatory surgery centers added in Q2 alone). Coming off a strong quarter, Ardent Healthcare certainly has ample opportunity to expand its stated 3% market share and continue providing high-quality care to its patients. VMG Health looks forward to following the company’s performance in the coming quarters.
Written by Dylan Alexander, CVA and Karly Bruss
The ambulatory surgery center (ASC) industry continues to experience steady, reliable growth, and remains a highly profitable segment within the healthcare provider sector. This growth has attracted significant attention from investors, captivated by the sector’s promising returns. The ASC industry’s success is underpinned by several key factors: an increase in demand for outpatient procedures, enhanced operational efficiency, technological advancements, favorable regulatory changes, elevated patient satisfaction, and, in some cases, favorable relationships with commercial payers. However, the success of ASCs has introduced a unique challenge: the difficulty of attracting and securing new physician investors.
Successful and stable ASCs typically have high profit margins and generate substantial returns to their investors. While health systems, management companies, and other corporate investors are common in ASCs, the most important class of investors in an ASC are its surgeon utilizers. For physicians to be investors, they are required to conduct a certain percentage of their surgical case volume at the ASC. In addition, most ASC operating agreements have redemption provisions requiring the sale of ownership to be valued at stated multiple of profitability or at fair market value (FMV) when physicians are not meeting case volume requirements, retiring, or exiting the marketplace.
As exiting physicians sell off their ownership, ASCs seek out new surgeon investors to buy in, provide care, and maintain a strong base of physician equity partners to retain case volume and protect or increase profitability. ASC operating agreements typically have buy-in provisions at the same multiple of profitability or at FMV mirroring the redemption provisions. Therein lies the challenge of attracting new investor or utilizer surgeons into the ASC depending on the life cycle of the ASC. New physician investors may not have the ability or the desire to pay the price required to have an ownership interest in the ASC that is on par with legacy investors. Potential new physician investors may be relatively new to their practice, have large debt burdens from medical school, young family considerations, or considering alternative investments in the financial marketplace.
The ASC life cycle, though similar to other businesses, is distinctive due to its cyclical nature and dependence on surgeon volume and investment.
In the start-up phase, significant investments are made to secure a facility, purchase necessary medical equipment, recruit staff, acquire the appropriate licensure, and fund initial working capital. Because the overall value of an ASC is typically at its lowest during the start-up phase, potential physician investors may be unwilling to accept the financial risk of a new venture that may not be cash-flow positive in the immediate future. However, the returns on their investments for the initial physician investors can be the highest for a successful ASC. During this phase, physician shareholders are usually unlikely to exit, and the ASC’s focus is syndicating the initial physician ownership base for what is expected to be a highly successful ASC given the desired surgical specialty mix.
In the growth phase, the ASC establishes its relationship with physician utilizers (both investor and not), managing surgical block times, developing its patient base, refining payer contracting, and reaching operational efficiency through case volume adequacy given the size and specialty mix of the ASC. During this phase, ASCs are often profitable but still not ramped to optimal and full capacity levels. The growth phase can represent an ideal time for new physicians to consider buying in, as the purchase price is often less and the potential for higher returns still exists. Physician investors exiting the ASC can also get strong returns on their initial investment from the start-up phase.
ASCs have achieved financial stability and operational efficiency in the maturity stage. Mature ASCs typically generate significant cash flow, leading to high valuations. As discussed, high valuations can be a barrier to entry for new physician investors. In a sense, ASCs can be a victim of their own financial and operational success. Though returns are stable, mature ASCs have usually reached their maximum capacity or are nearing capacity. Additional capital investment in space and equipment could be required to maintain the ASC’s current level of profitability. Most importantly, the ASC must manage the retirement and exit of certain key physician investors by replacing them with case volume from newer physicians. If new physicians successfully replace exiting physicians in ownership, the maturity stage can be maintained for the foreseeable future. Valuations at this stage are typically high and consistent over time with equitable returns to both exiting and buying surgeons. It is at the end of this stage that many ASCs encounter the challenges discussed previously. If an ASC is unable to attract new physician investors due to market factors, a shortage of physicians, or pricing constraints associated with success, it may face declining profitability and overall value.
The exit phase, or decline phase, is characterized by shareholder physician attrition outpacing new physician investment. The value of an ASC declines as the departing shareholders no longer contribute case volume, and finding physicians to buy in remains a challenge. At this point, it is common to see a few physicians or the corporate partner increasing ownership due to shareholder redemptions with no new physicians to invest.
ASCs remain one of the more attractive investments in the healthcare space because of their proven resiliency when managed appropriately. Long-standing, successful ASCs may have been through this life cycle several times. At the decline phase, the value of the ASC will likely be at one of its lower points, creating an attractive purchase price for interest by new surgeon investors. If ownership is re-syndicated to align with growth and key physicians, the ASC then starts at the growth phase and moves to maturity with its new base of physician owners.
The increasing demand for outpatient procedures and the opportunity for substantial returns make ASCs a desirable option for potential physician investors. Physician alignment through investment is critical to the success of any ASC and is the key factor in the life cycle of the business. When determining values for physician investment and redemption, it is essential to consider the current and expected future operations.
The valuation of the ASC should be as accurate and thoughtful as possible—not only for the relationship between physician buy-ins and redemptions to maintain the operations of the ASC, but for regulatory requirements as well. Often, ASCs engage an independent and unbiased third party to conduct a fair market value analysis pursuant to any ownership transactions. VMG Health, with its experienced team, provides expert knowledge and data-driven analyses to support parties in ASC transactions. Our expertise in the ASC marketplace enables stakeholders to navigate the challenges and opportunities associated with ASC investments as they move through their life cycle effectively.
Written by Frank Cohen
In recent years, key Supreme Court rulings have significantly altered the field of administrative law. One crucial decision involves the Court’s June 28, 2024 overturning of the Chevron deference, a long-standing doctrine that has governed how courts engage with agency interpretations of statutes. This change may have far-reaching implications for various administrative processes, including Medicare audit hearings. This article explores the impact of rejecting Chevron deference on administrative law judge (ALJ) hearings, particularly those related to Medicare overpayment estimates based on statistical sampling.
The Chevron deference doctrine was established in the 1984 Supreme Court case Chevron U.S.A., Inc. v. Natural Resources Defense Council, Inc. This doctrine specifies that, when a statute is ambiguous, courts should defer to an agency’s interpretation of it as long as the interpretation is reasonable. The rationale behind this doctrine is that agencies are presumed to possess specialized expertise, making them better equipped to handle technical details than courts. Chevron deference was meant to respect the separation of powers by recognizing the executive branch’s role in enforcing laws, ensuring courts do not overstep their boundaries by second-guessing agency expertise.
Chapter 8 of the Medicare Program Integrity Manual (MPIM) offers only a broad overview of using inferential statistics and conducting statistical sampling to estimate overpayments (SSOE) in Medicare audits. These guidelines have traditionally been highly regarded in ALJ hearings and often carry more weight than the results, conclusions, and opinions presented by statisticians representing healthcare providers. This preference was based on the premise that the Centers for Medicare & Medicaid Services (CMS) possessed the expertise to interpret and apply complex statistical methods effectively. This is the definition of Chevron deference.
MPIM’s Chapter 8 contains only nine pages regarding the statistical models and processes involved in the SSOE analysis. However, an extensive body of literature exists on this subject in various formats and sources. When ALJs rely on the factors in these nine pages, it hampers the provider’s ability to mount a compelling defense that challenges the auditor’s methods using widely accepted standards within the statistical community. On the other hand, this deference is meant to ensure audit hearings are grounded in established regulatory interpretations, providing a consistent framework for decision-making. It does not preclude providers from challenging the auditor’s methods. Instead, it ensures any defense is presented within the context of recognized standards, maintaining the integrity and fairness of the process.
The Supreme Court’s overturning of Chevron deference represents a significant change in administrative law and, consequently, ALJ hearings. The decision reflects concerns about the separation of powers and the judiciary’s role in interpreting the law. Critics of Chevron deference argue that it gave agencies too much power to define their own authority, thereby weakening judicial oversight and denying healthcare providers’ due process. Supporters of Chevron deference argue that it allows agencies with specialized expertise to interpret complex and technical statutes, ensuring more informed and consistent regulatory decisions while promoting efficiency and stability in the regulatory process.
It is reasonable to expect that this ruling will have a significant impact on the financial damages incurred by healthcare providers due to extrapolated overpayment findings. However, the ruling could create a more complex and uncertain regulatory environment, making it harder to predict and comply with regulations. The impact can affect various areas of the audit process.
With Chevron deference no longer in play, ALJs will hopefully scrutinize CMS guidelines more critically, including Chapter 8 of the MPIM. This means the methodologies and assumptions used by CMS for statistical sampling and overpayment estimation could be subjected to more rigorous judicial review during Medicare audit hearings. ALJs will no longer automatically favor CMS’ interpretations of Chapter 8 but will evaluate them alongside expert testimony from statisticians representing providers. However, this also means that judicial rulings may be inconsistent without agency interpretations of ambiguous statutes. Different courts may interpret regulations differently, leading to inconsistent enforcement. This inconsistency could create a patchwork of regulatory requirements across different jurisdictions, complicating compliance efforts for healthcare providers operating in multiple areas.
The recent overturning of Chevron deference marks a significant shift in the landscape of expert testimony in ALJ hearings. Providers may potentially expect a fairer and more balanced evaluation of the analysis and methodologies presented by their statisticians. As a result, there is an increased incentive for providers to seek highly qualified experts who can effectively challenge CMS’ statistical approaches and provide alternative interpretations based on robust statistical principles. This shift promotes a more equitable playing field and encourages the use of expertise to strengthen the quality of evidence presented in ALJ hearings.
The CMS guidelines are not always beneficial for providers regarding Medicare audit disputes. By more mindfully following these guidelines, providers will likely have better results. ALJs may potentially consider the evidence from both parties more fairly. This could lead to lower overpayment estimates or the dismissal of the extrapolated overpayment findings. Now more than ever, providers need to be more strategic, focusing on the quality and persuasiveness of their experts’ analyses and testimonies.
The Supreme Court’s overturning of Chevron deference marks a significant paradigm shift in the power dynamics between administrative agencies and the judiciary. In the context of Medicare audit hearings, this shift implies that ALJs are no longer bound to automatically adhere to the guidelines set forth by CMS, as outlined in Chapter 8 of the MPIM. Instead, ALJs are now expected to assess all evidence presented, including expert testimony from healthcare providers, potentially leading to more favorable rulings for the providers. As the legal framework undergoes transformation, healthcare providers must proactively adapt by employing expert analyses and presenting counterarguments against agency methodologies to ensure accurate audit outcomes.
Written by Matthew McKenzie, CVA; Jay Ostrom, CVA
The following article was published by the American Association of Provider Compensation Professionals (AAPCP).
Due to the complexities of the modern healthcare environment, there is a broad range of compensation structures in provider services agreements to facilitate ease of administration while maintaining regulatory compliance. While common compensation structures such as a compensation-per-Work Relative Value Unit (wRVU) model can be effective in reimbursing providers for the value of professional services, independent physicians and physician practices are sometimes compensated based on a per-service rate for each individual unit of service they provide, rather than a rate per wRVU. To ensure arrangements utilizing this structure are commercially reasonable and consistent with fair market value (FMV), hospital administrators should understand the value drivers of the rates that can be paid for per-service fees. In this article, we will discuss potential benefits and drawbacks of the per-service fee structure, as well as explore several key considerations when setting rates and capturing appropriate expenses.
Similar to the compensation-per-wRVU model, a per-service fee structure determines the total compensation payable to a provider based on the unit volume of services rendered. However, rather than the unit of compensated service being the wRVU, the compensation unit is tied to the volume of each CPT code rendered or a broader service category.
For example, consider a scenario in which a radiology group provides a hospital with X-ray, MRI, CT scan, and ultrasound interpretation services. Rather than receiving fixed compensation-per-wRVU based on the wRVUs associated with each interpretation, each interpretation category (X-ray, MRI, CT scan, and ultrasound in our example) would have its own unique compensation rate.
In general, the primary sources of value for these arrangements are the professional services rendered by the provider. While there are various ways to quantify the value of providers’ professional services, the two most common methods are described below.
In determining the compensation for professional services per unit of service, one consideration is the clinical provider time required to provide that unit. In general, the more provider time required to perform a certain service, the greater the value of the service rendered. As such, a reasonable method of determining the value of the professional component of compensation for a unit of service would be to assess the average time spent by the clinical provider on said unit.
Professional reimbursement rates can also be a useful measure of the value of professional compensation on a per-service basis. In many cases, hospital administration will have data indicating the average professional reimbursement rates realized per unit of service performed. When this data is unavailable, a good starting point for assessing reimbursement for professional services is the Medicare reimbursement for the wRVU associated with the relevant Current Procedural Terminology (CPT) codes as reported by the Center for Medicare and Medicaid Services (CMS). This professional reimbursement should be based on the applicable CPT code or bundle of CPT codes that the provider will use for each unit of service. The reimbursement may quantify professional services more accurately than a solely time-based approach, as the Medicare reimbursement also considers the specific skill, training, and acuity of the subject service.
While Medicare reimbursement is a good starting point in understanding professional reimbursement for provider services, actual revenue generated for said services is unlikely to fall directly in line with Medicare reimbursement. Rather, professional reimbursement for a given service is a function of the payer mix of the subject services. While the specific payer mix of an arrangement needs to be understood to accurately determine the professional revenues generated per unit of services provided, there are a few general rules that can inform the directionality of the adjustment.
For most professional services, commercial reimbursement is typically greater than Medicare reimbursement. As commercial payers often reimburse at higher rates than Medicare, a service line payer mix primarily comprised of commercial payers will usually generate more revenue per unit than a service line comprised of fewer commercial payers. The higher revenue associated with the subject services may justify an upward adjustment in the per-service rates payable to the provider.
Medicaid and uninsured payers typically reimburse at rates lower than Medicare. As Medicaid and uninsured payers reimburse at lower rates than Medicare, a service line payer mix primarily composed of Medicaid and uninsured payers will generate less revenue per unit than a service line composed of fewer Medicaid and uninsured payers. In this scenario, the relatively lower revenue associated with the subject services may require a downward adjustment in the per-service rates payable to the provider.
While payer mix does have an impact on the revenue generated for the services provided, the actual services rendered by the provider are not dependent on the payer mix and, in many scenarios, the provider has little to no control over the payer mix. These dynamics should be considered when utilizing mix data to determine the per-service compensation payable to a provider.
Another method of quantifying the value of the professional compensation applicable to a unit of services provided is market survey data. For example, compensation-per-wRVU data for a wide array of provider specialties is readily available through healthcare compensation survey reports. This data may be applied to the average wRVUs that the provider would generate per unit of service to determine an estimate of the market professional compensation payable per unit.
As opposed to the use of actual professional reimbursement to determine professional compensation rates (which consider the actual funds available to compensate the providers), the use of market-based compensation data can provide an indication of value that reflects actual compensation rates paid in the market for similar services. However, the use of market survey data is limited by the reliability of the reported survey data and the data’s applicability to the subject services. It is important that organizations understand the survey data they are utilizing and how the specific details of an arrangement may impact the applicability of market survey data.
As previously mentioned, one benefit to the per-service compensation model is the ability to include provisions for certain variable overhead expenses incurred by the provider per unit of service. There are several ways to determine the value of these variable expenses.
One way to determine a provision for additional variable expenses is by assessing the actual incremental variable expense incurred by the provider. Should the provision for non-professional variable cost per unit be based on the actual costs incurred by the provider, the reimbursement for variable expenses is effectively a direct pass-through from the provider to the contracting entity. While this method reduces the risk of over- or underpayment for non-professional services, it is important that the contracting entity ensures the following assumptions are true:
In the absence of actual incremental expense data, Medicare reimbursement associated with practice expense (PE) RVUs can also be useful in determining a provision for overhead associated with a unit of services provided. Specifically, reimbursement associated with the PE RVUs for the CPT code, or bundle of CPT codes, for a given service indicates reimbursement for non-professional expenses incurred, consistent with guidelines from CMS.
When utilizing PE RVU data, it is important to recognize the site of services in which the subject services are provided. CMS illustrates PE RVU data for services provided in a facility setting (e.g., hospitals, ASCs, SNFs, etc.) and a non-facility setting (e.g., outpatient clinics, urgent care centers, etc.). PE reimbursement is higher for services provided in the non-facility setting because the provider is assumed to bear the responsibility of all overhead (i.e., space, equipment, etc.) while the facility is assumed to bear these costs in the facility setting. Therefore, identifying the correct site of service is imperative for accurate application of this method.
Another consideration in deciding the payment rate for each service provided by a provider is who has the authority to bill and receive payment for the services provided. If the provider is unable to bill patients for any of the services provided, compensating the provider with a fully loaded rate, inclusive of provisions for professional and any technical services provided, may be appropriate.
Should the provider bill and collect for services rendered under an arrangement and retain those collections, the collections earned by the provider should offset the fully loaded rate that would otherwise be payable to the provider. For example, if the provider’s collections per unit were sufficient to cover their expenses incurred to provide the service, it may not be appropriate to provide any additional compensation to the provider. However, a payment subsidizing provider services in addition to the collections retained by the provider may be appropriate if the provider’s collections per unit are not enough to cover their expenses (e.g., if the provider has expenses of $30 per unit but can collect only $20 per unit, a payment covering this disparity may be reasonable). Because reasonable payment to providers who can bill and collect is dependent on their actual collections per unit (which varies dependent on the payer of the service), organizations should be diligent when determining rates per service in these scenarios.
In addition to the actual collections generated by the provider in the provision of the services, the cost of billing and collecting should be considered when determining a reasonable per-service compensation rate. For example, professional reimbursement from payers typically includes a provision for the costs associated with billing and collecting. However, market provider compensation data does not typically include a provision for billing and collection costs. As such, make appropriate adjustments depending on the valuation method used and the billing and collection responsibilities of the subject arrangement.
When a service is requested on an urgent basis, an increase in the compensation payable to a provider may be justified. For example, per-service compensation for services ordered emergently (e.g., STAT cases) could potentially earn more compensation than the same services that do not require an expedited turnaround time to account for the on-call availability of the provider. Typically, additional compensation based on the urgency of a service is only contemplated if the expedited turnaround time is deemed medically necessary.
Per-service compensation structures can be an effective way to compensate providers for services that include additional variable expenses above and beyond the providers’ professional services. However, hospital administrators must understand the value drivers behind per-service compensation rates and the risks associated with the structure to ensure arrangements are commercially reasonable and compliant with healthcare regulations.
Written by Savanna Ganyard, CFA; Joshua Miner; Chance Sherer, CVA; and William Teague, CFA, CVA
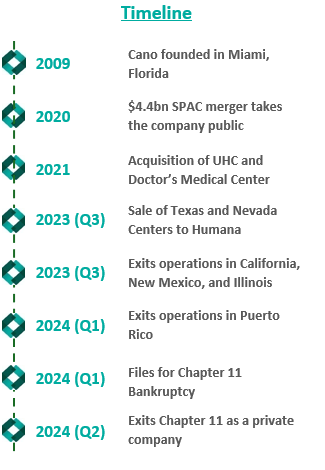
Cano Health, Inc., headquartered in Florida, is a value-based care delivery platform that specializes in primary care for seniors. In February 2024, Cano announced it would enter a reorganization process under Chapter 11 bankruptcy. Less than six months later, on June 28, 2024, the company announced a successful conclusion of its court-supervised restructuring. The company, now private, is looking forward to a brighter future under a more focused strategy.
Founded in 2009, Cano began developing its core business as a value-based provider in Florida. The company employs a capitated care model and places a large focus on preventative care and accessibility. The company’s membership is largely comprised of Medicare Advantage, Medicaid, and ACO REACH. As Cano grew, it added complementary service offerings, such as a care management program, a prescription program, and in-home medical visits. These services were meant to prevent hospital admissions and readmissions, increasing Cano’s revenue while decreasing patient total cost of care in the capitated care model.
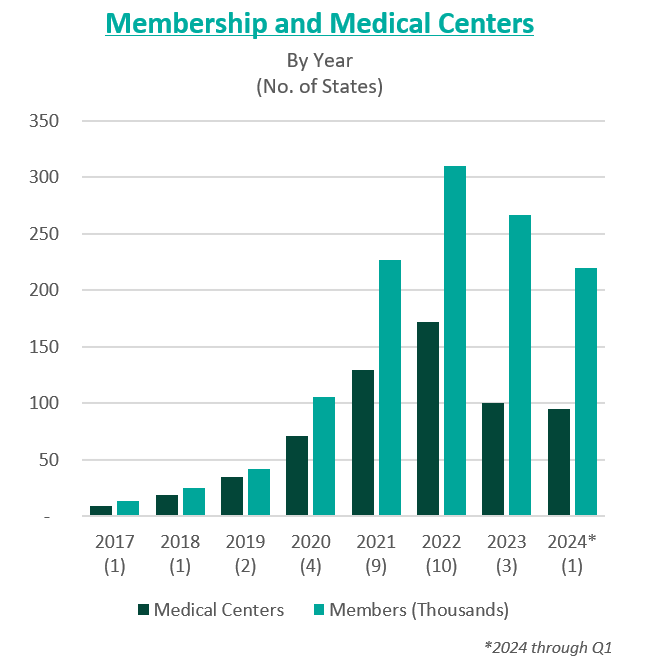
To further drive growth, the company began to pursue an aggressive policy of expansion through de novo development, acquisitions, and affiliations. The company grew from two markets and 13,700 members in 2017 to 15 markets and 106,000 members by 2020.
In 2021, the company went public in a $4.4 billion merger with a special purpose acquisition company (SPAC) that provided $1 billion in cash proceeds to the company. After going public, Cano continued to fuel growth through acquisitions. In 2021, the company acquired Miami-based University Health Care in a $600 million deal and Doctors Medical Center in a $300 million deal. The company added five states and 121,000 members in 2021, resulting in a total of nine states and 227,000 members. The company continued this growth throughout 2022, ending the year in 10 states and with 310,000 members.
However, in these years of high growth following going public, the anticipated benefits of these acquisitions did not materialize. The company was also affected by industry and regulatory headwinds, including increasing third-party medical costs and a looming Medicare Risk Adjustment Model (V28). On top of these issues, Cano continued to add debt and fell behind on debt repayments. Throughout 2022 and 2023, Cano reported significant losses and an accumulation of $1.2 billion in debt. For context, the company had $1 billion in assets as of December 31, 2023.
In February 2023, Cano entered into a side-car credit agreement with certain lenders. At the end of March 2023, the company’s market capitalization had decreased 90% from its price at the time of its SPAC merger. In April 2023, three board members resigned in protest of company decisions and performance. A couple of months later, the CEO, Marlow Hernandez, stepped down after pressure from shareholders and the former board.
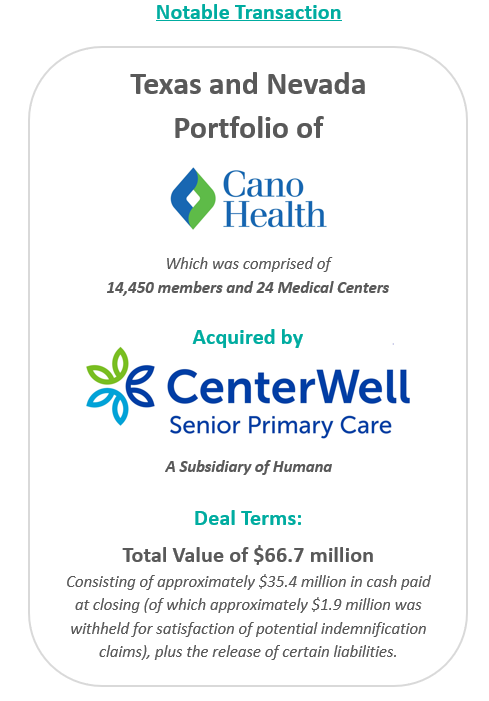
In an attempt improve the company’s performance and cover its liabilities, Cano began to divest its assets. The divestment process began in 2023 prior to the Chapter 11 filing, when the company sold its entire Texas and Nevada portfolio to CenterWell Senior Primary Care, a Humana subsidiary. The net proceeds of the transaction were utilized to pay down debt.
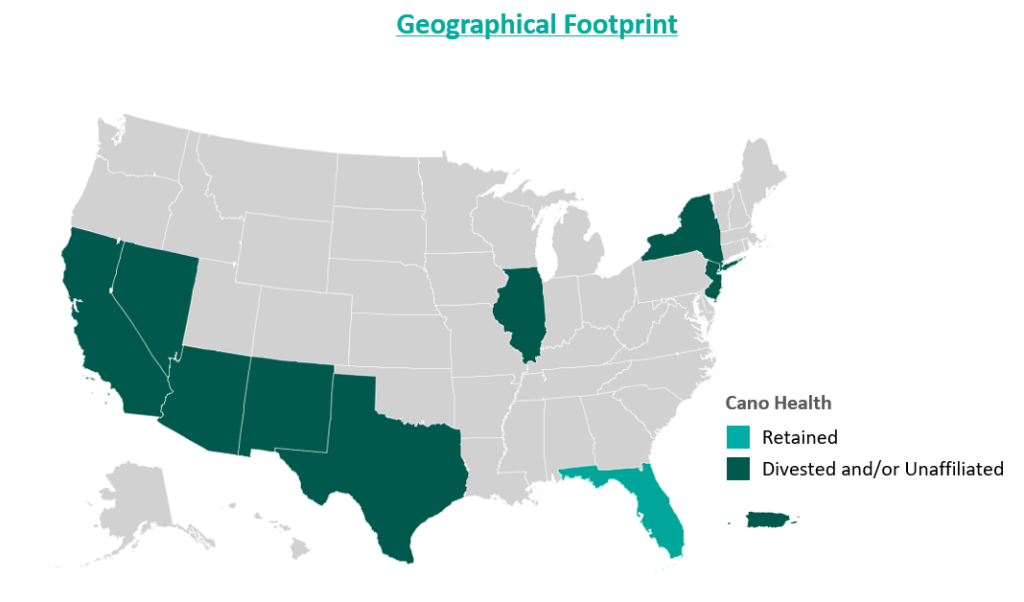
During the second half of 2023, the company also closed medical centers and exited operations in California, New Mexico, and Illinois. These three states represented approximately 5,000 members and 17 medical centers. The company received $19.9 million for the divestiture of certain specialty practices in Florida and assets located in California and Illinois, the net proceeds of which were used as working capital. Cano closed the remaining medical centers in these three states. Finally, Cano successfully exited operations in Puerto Rico at the beginning of 2024.
Despite these transformation efforts, Cano entered into voluntary Chapter 11 proceedings and a Restructuring Support Agreement with most of its lenders in February 2024. The agreement’s primary goal was to reduce debt and position the company for long-term success through cost-cutting measures.
In July 2024, Cano emerged from Chapter 11 as a reorganized private company. The company successfully reduced its debt burden by $1 billion by converting it into equity in the form of common stock and warrants. Additionally, existing investors have contributed an additional $200 million investment to support business operations.
Furthermore, Cano exited its underperforming markets, choosing to focus on its core Florida market. During the bankruptcy process, the court allowed Cano to reject 72 leases in six states. These were sites of offices and medical centers that the company no longer uses.
As established during proceedings, the company’s operational strategy going forward centers around optimizing cost and continuing to evaluate asset performance. To date, Cano is on track to achieve $290 million in cost reductions by the end of 2024. Key drivers of this cost reduction include negotiating with payers, reducing operating costs through decreasing the number of permanent staff, and cutting non-essential spending. In addition, the company is prioritizing Medicare Advantage and ACO Reach lines of business.
Essential to understanding Cano’s emergence from bankruptcy is the amount of divestment the company has undergone. At its peak, Cano operated in nine states and Puerto Rico either directly or through affiliates. To improve operations, the company terminated most of its affiliate partnerships and began to divest many of its operations. Following the reorganization process, the company only operates in Florida. Prior to bankruptcy, Cano had 143 locations in Florida, now reduced to 83 locations.
Cano’s largest asset sale was its centers in Texas and Nevada to CenterWell in a deal worth $66.7 million. At closing, the centers covered 14,450 members and 24 medical centers. These figures imply a multiple of $4,600 per member.
In December 2023, the company commenced a sale process for its ACO Reach line of business. The company has engaged with several bidders, but the transaction has not yet materialized. Cano’s ACO Reach business, which comprises 93,300 members, is projected to achieve $32 million in underwriting margin and $11 million in adjusted EBITDA from August to December 2024. The company also continues to explore sale opportunities related to its Medicaid line of business, which is expected to represent 36,200 members in 2024.
Cano’s financial projections estimate $2.9 billion in revenue and 233,000 members during fiscal year (FY) 2025, growing to $3 billion and 239,000 members by FY 2028. During the same period, the company’s adjusted EBITDA is projected at $125 million, growing to $199 million.
Post-reorganization, the estimated value of Cano at the enterprise level was between $580 million and $720 million. The valuation reflects implied Year 1 (2025) multiples at the midpoint of 5.2x adjusted EBITDA and approximately $2,800 per member.
In June 2024, Cano successfully emerged from bankruptcy as a private company with an improved capital structure and more focused operations. The reduced debt burden, coupled with a $200 million injection of capital, has relieved some pressure on the company as it moves forward. Cano has already made significant progress towards its FY 2024 cost reduction goal, achieving $270 million in cost savings and productivity improvements through the first half of the year. Currently, Cano is focused on its Florida operations but has not ruled out a more prudent expansion in late 2025 or 2026 if it continues to meet its financial goals.
Cano Health, Inc. (n.d.). Press releases, public filings, and investor presentations. Retrieved from www.canohealth.com.
Cano Health. (2023, July 18). Cano Health announces successful emergence from Chapter 11. PR Newswire. https://www.prnewswire.com/news-releases/cano-health-announces-successful-emergence-from-chapter-11-302186063.html
Cano Health. (2023, June 7). Cano Health announces agreement with unsecured creditors committee and court approval of disclosure statement for its reorganization plan. PR Newswire. https://www.prnewswire.com/news-releases/cano-health-announces-agreement-with-unsecured-creditors-committee-and-court-approval-of-disclosure-statement-for-its-reorganization-plan-302152012.html
Cano Health. (2023, March 27). Cano Health enters restructuring support agreement with a significant majority of its lenders to strengthen financial position. PR Newswire. https://www.prnewswire.com/news-releases/cano-health-enters-restructuring-support-agreement-with-a-significant-majority-of-its-lenders-to-strengthen-financial-position-302052889.html
PR Newswire. (2023, March 28). NYSE suspends trading in Cano Health Inc. (CANO) and commences delisting proceedings. https://www.prnewswire.com/news-releases/nyse-suspends-trading-in-cano-health-inc-cano-and-commences-delisting-proceedings-302053778.html
Capital IQ. (n.d.). Investor presentations. Retrieved from Capital IQ website.
Public Information related to Cano Health’s Chapter 11 Plan for Reorganization (Case No. 24–10164). (n.d.). Veritaglobal. Retrieved July 26, 2024, from https://veritaglobal.net/CanoHealth
Klas, M. (2023, July 19). The new Chapter 11 plan for Cano Health aims to exit bankruptcy, cut debt. Miami Herald. https://www.miamiherald.com/news/health-care/article289663459.html
Authors
Related Content