
The Importance of Investing in Ambulatory Surgery Center Nurse Leadership
Christa Shephard
July 1, 2024

Written by Christa Shephard
In today’s workplace, employee engagement has hit a standstill. Recent Gallup polls show that many employees have become increasingly detached, leading to a phenomenon known as the “Great Detachment,” which is exacerbating burnout among healthcare professionals. In the sixth episode of Coachify Over Coffee, our certified leadership coaches Laura Baldwin and Savory Turman discuss the importance of coaching in combating disengagement among healthcare professionals.
Employees are showing up, clocking in, and collecting paychecks, but they may not be engaged in meaningful ways. The Great Detachment is not just about productivity—it’s also impacting overall employee wellness, both mentally and physically. It has a ripple effect, reducing organizational growth and employee satisfaction. This phenomenon is particularly troubling in healthcare, where staff engagement is critical to patent care and safety. As healthcare workers become more detached, healthcare organizations face lower job satisfaction among staff, higher turnover rates, and a decline in the quality of care provided. In , The Real Impact of Leadership Coaching, Baldwin and Turman dive into the data that may hold the key to alleviating disengagement at work.
According to a recent study, individuals who work with a coach experience 2.9% faster growth in their careers. Coaching provides the guidance and tools necessary to help employees re-engage with their work and, more importantly, their own professional development. Interestingly, only 23% of surveyed business professionals wanted their managers to serve as their coaches, while 56% preferred instructor-led coaching. These preferences illustrate the need for structured coaching programs that go beyond traditional, managerial feedback.
One of the many concerns stopping individuals from asking for the professional coaching they desire is budget constraints. With companies no longer approving bonuses and raises and performing layoffs, employees who feel like they would like professional coaching—which could reinvigorate their emotional and mental connection in the workplace—may feel that asking for professional development opportunities of any kind is hopeless. It’s important for clinical leadership to understand that high staff turnover is more costly than investing in their current employees. Employee disengagement can place financial strain on healthcare organizations with higher costs for recruitment, training, and retention. Engaged employees are more likely to stay in their positions longer, saving the organization money it would have spent replacing an unhappy worker. One of the most important metrics to quantify return on investment (ROI) on leadership development coaching is employee engagement.
When employees are engaged and connected with their work, they’re more productive. Increased productivity for all employees, regardless of where they fall in the organizational chart, directly benefits a company’s bottom line. Professional coaching is just one piece of the employee engagement puzzle, but it’s an important consideration for individuals who look for an organization that provides growth and development opportunities. Internal employee engagement surveys are an important step in determining the ROI on leadership development coaching. To get a baseline understanding of how this specific investment in your employees has affected engagement, an internal survey can provide insights into improved performance, satisfaction, and overall team productivity.
Baldwin and Turman, leadership coaches at BSM Consulting (a division of VMG Health), reminded listeners that coaching isn’t just about career growth; it’s about helping individuals recognize the choices they’re making and empowering them to take control of their professional and personal lives. The coaching process often reveals how workplace issues bleed into life challenges, and vice versa. By addressing both, coaches help individuals achieve true transformation.
Leadership development coaching offers an important pathway for re-engaging healthcare employees and fostering a more connected, motivated, and productive workforce. It’s an investment that benefits both the individual and the organization as a whole. If you’re looking to provide leadership coaching to your employees, Coachify Over Coffee offers valuable insights and actionable strategies. Apply a new approach to your leadership with the help of Laura Baldwin and Savory Turman, two certified coaches dedicated to sharing their expertise with listeners like you.
Written by Ryan Mendez, Jack Hawkins, and Colin Park, CPA/ABV, ASA
The following article was published by Becker’s ASC Review.
The ambulatory surgery center (ASC) sector continued to evolve in 2023, reflecting a trend of steady growth, higher-acuity cases, and some changing regulations. 2023 featured continued consolidation through a combination of investment by prominent ASC platforms and acquisitions made by new entrants in the market.
Higher acuity cases continued to decant to the outpatient setting, and with the Centers for Medicare & Medicaid Services (CMS) moving total shoulder arthroplasty to the ASC Covered Procedures List, we expect this shift to continue. In addition to these trends, 2023 saw significant changes in the regulatory landscape, particularly with the liberalization of Certificates of Need (CON) requirements for certain states. The changing of CON regulations is poised to further accelerate the development opportunities of ASCs, enhancing their ability to meet the increasing demand for outpatient surgical care. 2023 continued to solidify the ASC’s role as a dynamic force in healthcare, poised to meet the surging demand for efficient, accessible surgery.
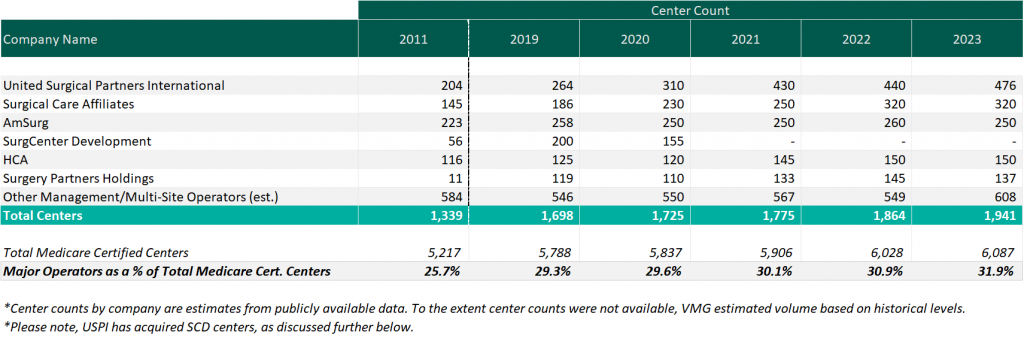
As of December 31, 2023, the largest operators (in terms of number of ASCs) are United Surgical Partners International (USPI), Envision Healthcare/Amsurg Corporation, and Surgical Care Affiliates (SCA), with ownership in approximately 476, 320, and 250 ASCs respectively. As noted in the chart below, the number of total centers under partnership by a national operator saw an increase from 2011 to 2023, growing from approximately 1,339 centers to 1,941 centers, which represents a compound annual growth rate of 3.14%. Additionally, the top five management companies have increased the number of centers under management by approximately 578 centers since 2011, which represents a compound annual growth rate of 4.85%. As management companies have increased in size, they can increasingly provide a greater level of strategic value by bringing greater leverage with commercial payors, enhanced management and reporting capabilities, and improved efficiency related to staffing, supplies procurement, and other general and administrative expenses.
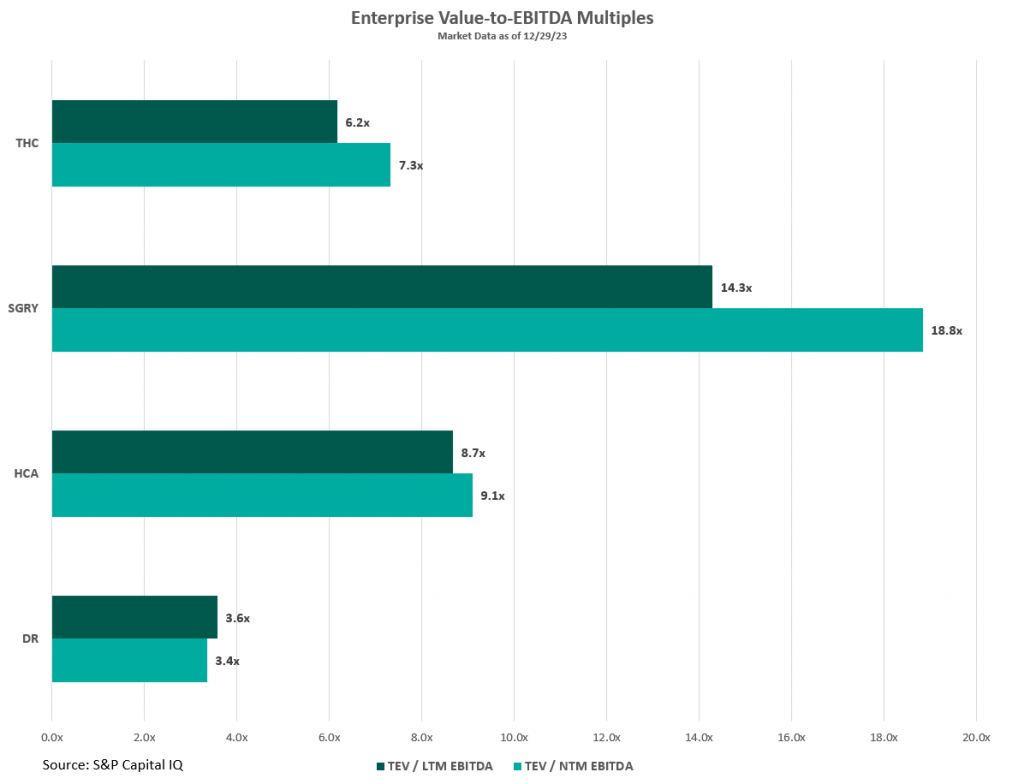
Public companies in the ASC market such as HCA Healthcare (HCA), Tenet Healthcare (THC), Surgery Partners (SGRY), and Medical Facilities Corporation (DR) offer insights into the ASC industry’s trends, challenges, and transaction data. These firms’ valuation multiples, illustrated in the figure below, serve as indicators of market valuation that are key to understanding the broader trends within the sector. Considering these multiples requires a nuanced approach, especially since larger organizations like HCA and THC have diversified operations beyond ASCs, which affect their market valuation and risk profiles. For example, HCA manages a large number of hospitals within its extensive healthcare services network, and THC’s ASC management platform, USPI, significantly impacts its profitability despite THC also operating numerous hospitals. To gain a comprehensive understanding of the ASC industry, it is beneficial to examine the detailed financial disclosures of these public companies. These include investor presentations and SEC filings, which offer a deeper insight into their performance and prospects than valuation multiples alone can provide.
For those interested in exploring the ASC industry further, including obtaining benchmarking information and analysis of ASCs across the United States, VMG Health’s Intellimarker is a valuable resource. The Intellimarker is an advanced, multi-specialty ASC benchmarking tool designed to facilitate a better understanding of ASCs’ relative financial and operational performance. Additionally, VMG Health’s Pulse on The Public Market provides coverage of various healthcare verticals in addition to the ASC sector.
In Q3 2023, Surgery Partners showcased a solid performance in the ASC sector, with surgical cases rising nearly 6% year –over year to over 172,000, after adjusting for divested facilities. This growth was driven by an emphasis on higher acuity cases and strategic acquisitions, as noted by Executive Chairman Wayne DeVeydt, culminating in $674.1 million in net revenue and $105.5 million in adjusted EBITDA for the quarter. The company experienced an uptick in total joint replacements, which increased by approximately 60% year –to date, supported by the recruitment of nearly 500 new physicians who specialize in musculoskeletal procedures into their centers. Despite facing challenges like anesthesia coverage and cost pressures, CEO Eric Evans is optimistic about the company’s long-term prospects, underlining its strategic focus on complex, higher-margin surgeries. Surgery Partners’ strategic acquisitions throughout the year have both bolstered its competitive position and broadened its geographical footprint and specialty mix, reinforcing its standing in high-growth markets and specialties.
During Tenet Healthcare’s Q3 2023 earnings call, the company highlighted its strong performance in ASC operations by its subsidiary, USPI. The ASC arm of THC reported a robust quarter with $370 million in adjusted EBITDA, a 16% increase from the same period in 2022, driven by a 7.9% rise in same-facility revenues and sustained margins. The subsidiary experienced notable volume growth in high-acuity service lines, including a mid-teens increase in total joint replacements, attributed to attracting high-quality physicians and leveraging increased patient demand for ambulatory surgery care. Additionally, THC expanded its ASC portfolio in Q3 by adding six new centers focused on higher-acuity orthopedic services in states like Nevada, Maryland, Texas, and Florida, featuring top musculoskeletal specialists. According to CEO Saum Sutaria, USPI’s aggressive expansion strategy includes over 30 centers in development, emphasizing high-value, specialized healthcare services. This expansion, part of a broader effort to advance site of service value-based care, aims to position USPI for sustained growth and profitability by tapping into high-growth, high-margin healthcare services and meeting patient demand for specialized ambulatory care.
In Q4 2023, HCA Healthcare reported a robust performance, with CEO Sam Hazen highlighting the strong demand across service lines and the improved operational efficiencies that led to a significant revenue increase to $17.3 billion. This performance, which surpassed expectations, was supported by a near 14% increase in adjusted EBITDA compared to the same quarter last year. This growth was driven by an 11% increase in same-facility revenue and improvements in operating margins, highlighting HCA’s ability to leverage increased revenue effectively. CFO Rutherford identified HCA’s ambulatory surgery division contributions to this success, demonstrating the company’s strategic focus on expanding its high-acuity service offerings and enhancing patient care through strategic acquisitions and network expansion.
During the 2023 Q3 earnings call, Medical Facilities Corporation demonstrated a strong financial performance, driven by strategic divestitures and a concentrated effort on core operations, resulting in a 7.4% rise in facility service revenue to $104.6 million. The executives highlighted significant operational improvements, including a 13.7% increase in EBITDA, attributed to enhanced efficiency and cost-saving strategies. Interim President Jason Redman noted that the increased performance was largely due to case mix, but that surgical case volumes also increased by 1%. Medical Facilities Corporation saw three of their surgical hospitals recognized for excellence in joint replacement, emphasizing the strategic shift towards managing higher-acuity cases in outpatient settings.
The trend of shifting higher-acuity procedures from inpatient or Hospital Outpatient Department (HOPD) settings to ASCs continued to grow throughout 2023. Specialties like cardiology, orthopedics, and advanced spine procedures increasingly marked their presence in ASCs. Throughout the year, many ASCs doubled down on their high-acuity procedures to drive revenue growth. Annu Navani, founder of Comprehensive Spine & Sports Center in Campbell, CA, elaborated: “The growth in orthopedics, spine and pain has been steady and will remain so. These are safe specialties, as the need is always there and will continue to thrive…” It is more than just a concept, as Surgery Partners CFO, David Doherty, provided some insight into how higher-acuity cases have spurred growth during the company’s Q3 earnings call. Doherty noted, “On a same-facility basis, total revenue increased 14.2% in the third quarter, with case growth at 2.9%. Net revenue per case was 11.0%, higher than last year, primarily driven by higher-acuity procedures.” This continued shift towards higher-acuity procedures being performed in ASCs is a clear indicator of the sector’s adaptation and growth, meeting the evolving demands of healthcare while offering efficient and cost-effective solutions for complex medical needs.
In 2023, ASC operators focused on both organic growth within their existing high-acuity specialties and actively pursued M&A opportunities as a key strategy to expand their footprint. During Surgery Partner’s Q1 earnings call, CEO Eric Evans noted that, “With an increase in the share of orthopedic and cardiac procedures moving into lower-cost, high-quality, short-stay surgical facilities, we are considering all options to capture our fair share, including sourcing and managing a robust M&A pipeline…”
Similarly, during THC’s Q3 earnings call, CEO Saum Sutaria, reiterated that THC is committed to scaling their ASC portfolio: “During the quarter, we added six new centers, the majority of which were focused on higher-acuity orthopedic services.” These developments illustrate the sector’s dynamic response to changing healthcare demands, positioning it for sustained growth and wider service reach as more high-acuity cases continue to shift to the ASC setting.
CMS noted in its fact sheet that, “in addition to finalizing payment rates, this year’s rule includes policies that align with several key goals of the Biden-Harris Administration, including promoting health equity, expanding access to behavioral health care, improving transparency in the health system, and promoting safe, effective, and patient-centered care. The final rule advances the Agency’s commitment to strengthening Medicare. It uses the lessons learned from the COVID-19 PHE to inform the approach to quality measurement, focusing on changes that will help address health inequities.”
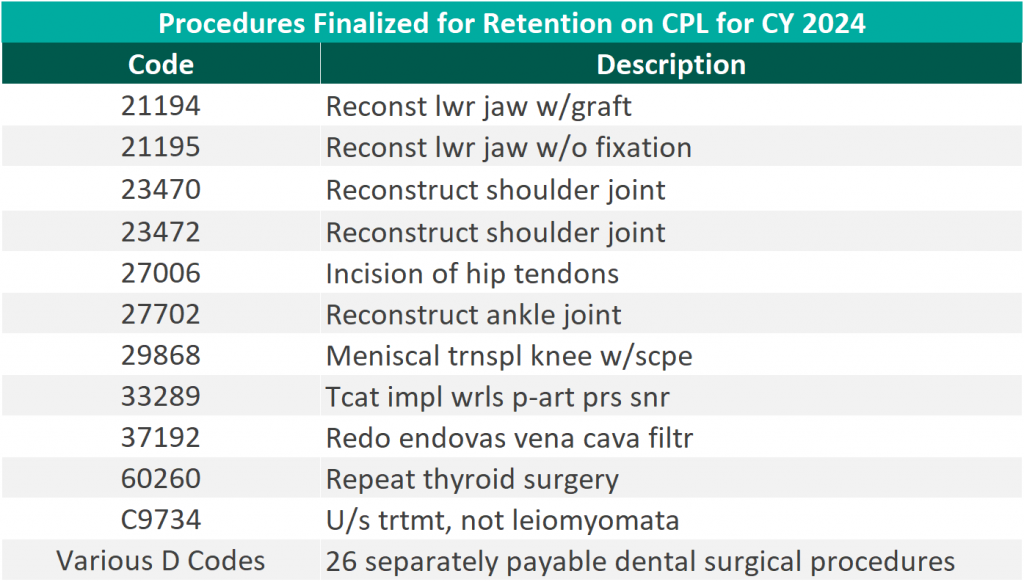
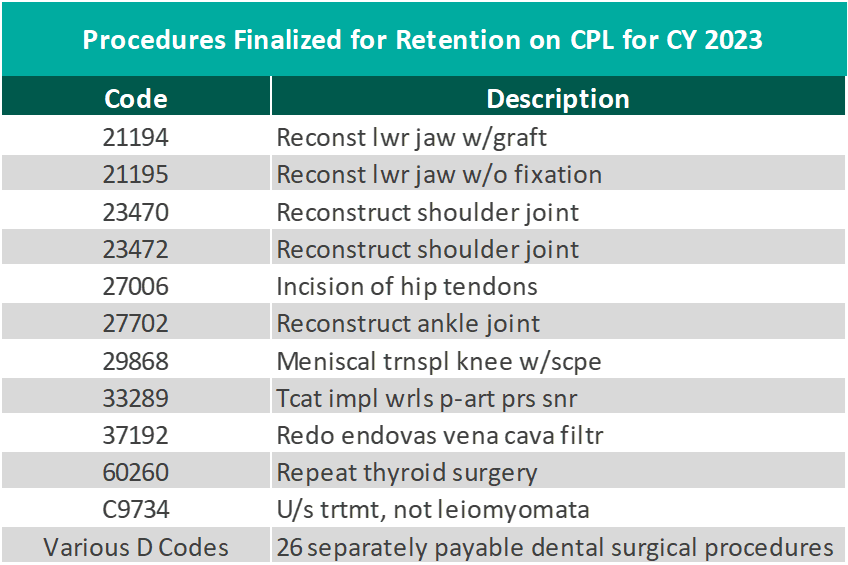
CMS finalized the addition of 37 surgical procedures to be added to the ASC CPL for CY 2024, outlined in the table below. These include 26 dental codes that were included in the proposed rule, and 11 surgical codes that were not included in the proposed rule—most notably total shoulder arthroplasty. These codes correspond to procedures that have little to no inpatient admissions and are widely performed in outpatient settings.
“We thank CMS for heeding our request to move additional surgical procedures—including total shoulder arthroplasty—onto the ASC payable list. Doing so benefits both Medicare beneficiaries, who now have a lower-cost choice for the care they need, and the Medicare program itself, which will save millions of dollars as volume moves to the high-quality surgery center site of service.” – Bill Prentice, Chief Executive Officer, ASCA
On November 1, 2022, the Medicare reimbursement fee schedule for ASCs in 2023 was finalized by CMS. Consistent with previous years, For CYs 2019 through 2023, CMS will update the ASC payment system using the hospital market basket update, rather than the Consumer Price Index for All Urban Consumers (CPI-U). CMS published the 2022 ASC payment final rule, which resulted in overall expected growth in payments equal to 3.8% in CY 2022. This increase is determined based on a hospital market basket percentage increase of 4.1% less the multifactor productivity (MFP) reduction of 0.3% mandated by the ACA. The 3.8% growth in payments represented the largest increase in projected payments year over year and was a direct result of the increase in labor, supplies, and other cost pressures seen over the last year.
Moreover, CMS released the ASC payment final rule for CY 2024 on November 2, 2023, resulting in overall expected growth in payments equal to 3.1% in CY 2023. This increase is determined based on a projected inflation rate of 3.3% less the MFP reduction of 0.2% mandated by the ACA. This is an increase of 0.3% from the proposed rule. Many healthcare industry leaders think the recent payment hike is too small given the intense cost pressures on hospitals and ASCs. How ASCs manage in today’s changing economic climate will be closely watched in the coming years
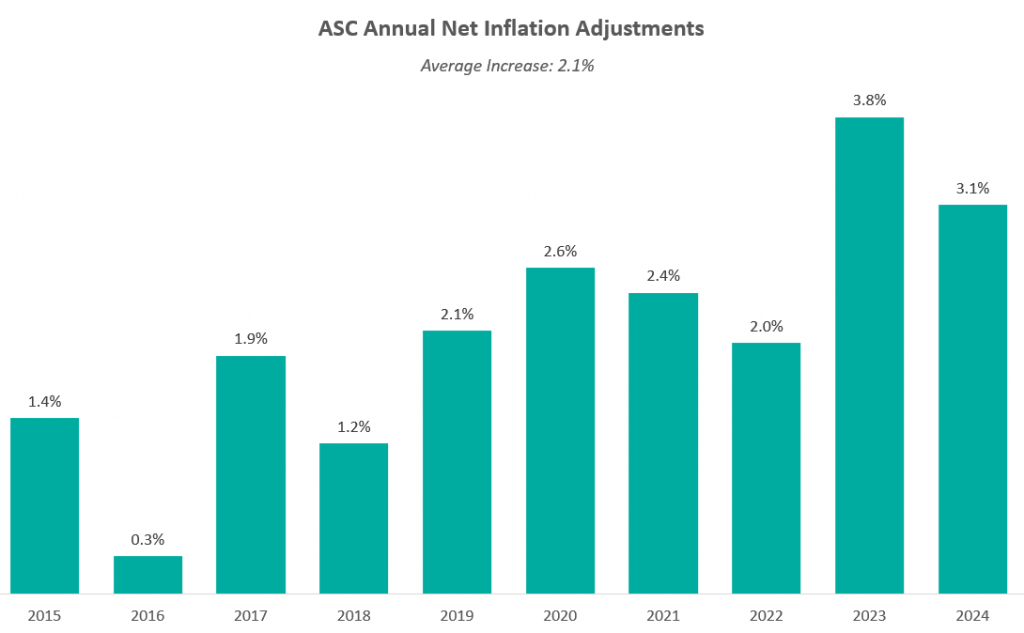
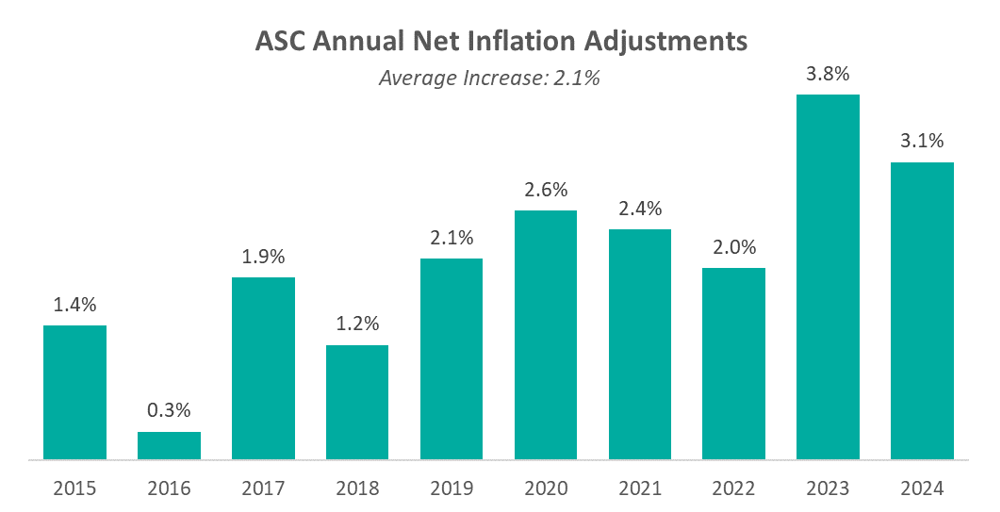
The chart below presents a summary of the historical net inflation adjustments for CY 2015 through CY 2024. The annual inflation adjustments are presented net of additional adjustments, such as the MFP reduction, outlined in the final rule for the respective CY. The CY 2024 inflation adjustment is slightly lower than the increase observed last year, although it continues to be elevated compared to the adjustments observed prior to 2023 largely driven by labor and supply cost pressures.
The table below reflects a summary of the estimated Medicare ASC payments for 2023 and 2024 for the top 10 CPT codes performed in ASCs in 2023. As noted below, the estimated 2024 payments by Medicare for the top 10 CPT codes from 2023 are projected to remain relatively flat overall, though there are some notable changes at the individual CPT level, including large decreases to three spinal/neuro stimulator codes.
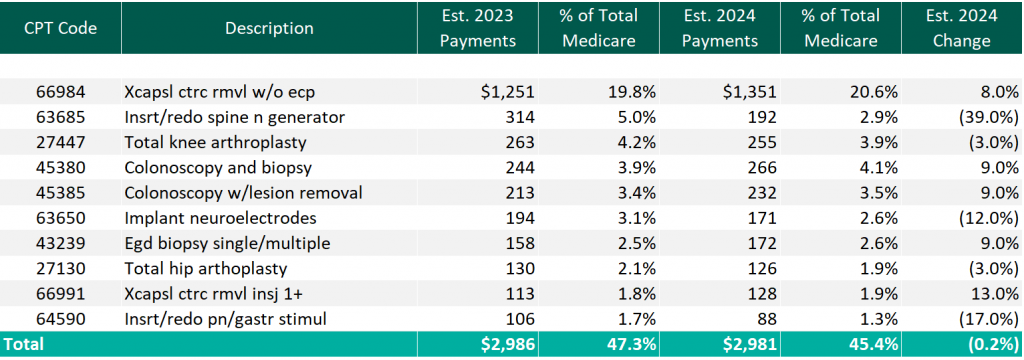
CMS has projected total ASC payments in 2024 to increase to approximately $7.1 billion, an increase of approximately $207 million compared to estimated CY 2023 Medicare payments.
In 2023, we saw the continued consolidation of the ASC market with individual transactions by prominent, large-level ASC platform players and M&A activity at the lower-middle-market level with a newly founded, private equity (PE) backed ASC development management company acquiring two centers to begin its platform. Although the industry continues to consolidate, as of 2023, approximately 68% of ASC facilities remain independent, leaving room for further consolidation at the individual-facility level.
The ASC market has seen a continued trend of intentional PE activity with interest in ASCs in recent years, most often tied to related physician practice portfolio companies. Driven by favorable tailwinds, this type of investment in ASCs allows PE investors to capture additional revenue streams related to their physician practice investments. PE interest in an ASC strategy outside of a physician practice portfolio company has also increased recently. Based on data from PitchBook’s Q3 2023 Healthcare Services Report, the ASC industry saw six trackable PE deals through September 30, 2022. These deals were mostly add-on investments, with one deal being a growth investment. PE total deal activity in the ASC space has remained fairly consistent over the last five years, though 2023 notably marks the first time since 2020 when no platform PE deals were tracked through PitchBook’s report. However, October 2023 saw the announcement of a PE-backed ASC platform.
In October 2023, a newly founded, multispecialty ASC development and management company, SurgNet Health Partners, Inc. (SurgNet), announced the acquisition of two ASCs in Michigan and Ohio. SurgNet is newly backed by Fulcrum Equity Partners, Leavitt Equity Partners, and Harpeth Capital. A $50 million equity check was syndicated to launch the platform, and presumably, additional investments will follow to support further investments. SurgNet, together with its equity partners, is expected to rapidly expand in the outpatient surgery market through aggressive growth strategies, including acquisitions, de novo ventures, and effective center management.
On February 9, 2023, United Musculoskeletal Partners (UMP) partnered with two orthopedic practices based in Dallas-Fort Worth. All-Star Orthopaedics, with four clinic locations, and OrthoTexas Physicians and Surgeons, PLLC, operating five clinics and one surgery center, were both acquired by the UMP platform. In August, UMP expanded this partnership by acquiring an ortho-focused surgery center, Pinnacle Orthopaedics, in an add-on LBO transaction.
In May 2023, The Office of Health Strategy (OHS) approved two settlement agreements allowing Hartford HealthCare (HHC) to acquire two outpatient surgical centers in Connecticut. On May 12, 2023, Surgery Center of Fairfield County, a subsidiary of HCA Health, was acquired by HHC, for an undisclosed amount. Further, in October 2023, HHC acquired Lichfield Hills Surgery Center, also for an undisclosed amount.
Covenant Physician Partners expanded its ASC footprint with the merger of its St. Vincent Eye Surgery Center and Wilshire Center for Ambulatory Surgery, adding an additional facility for surgeries.
On September 18, 2023, Unifeye Vision Partners (UVP), a management and support services company with an ophthalmology and optometry practice network including 13 ASCs, announced the acquisition of Insight Vision Group, a comprehensive eyecare platform in California. Insight Vision Group is made up of 10 clinics and two multi-specialty ASCs. UVP was active in the M&A space earlier in the year, acquiring Premier Surgery Center of Santa Maria, through an LBO for an undisclosed amount.
Surgery Partners further expanded its reach in September 2023, with the announcement of the acquisition and partnership with NorCal Orthopedic Surgery Center in San Ramon, CA. The center, an out-of-network ASC originally comprised of nine separate operating entities along with 25 physician partners, was advised by Merrit Healthcare Advisors in structuring the merger of the nine entities into one ASC to then be sold to Surgery Partners.
TriasMD, the parent company of DISC Surgery Centers and another musculoskeletal management company, declared its acquisition of Pinnacle Surgery Center in October 2023. This strategic move extends DISC’s data- and evidence-driven ASC model into Northern California, marking the second acquisition within the past six months. TriasMD previously acquired Gateway Surgery Center in Santa Clarita in February.
In November 2023, Regent Surgical Health acquired majority ownership in Oregon Surgical Institute (OSI), expanding a joint venture partnership that started in 2016. Notably, OSI was the northwest US’ first ASC to focus on complex spinal and total joint replacement cases. Regent COO Jeff Andrews said, “Our evolved partnership was made possible by the trust OSI’s leadership team has placed in us, and this will bolster both value and access by strengthening OSI’s position as a home for the growing list of procedures being delivered through ambulatory surgical centers nationally.” This development highlights the continued emphasis on pushing more complex cases to the outpatient setting through health system joint venture partnerships.
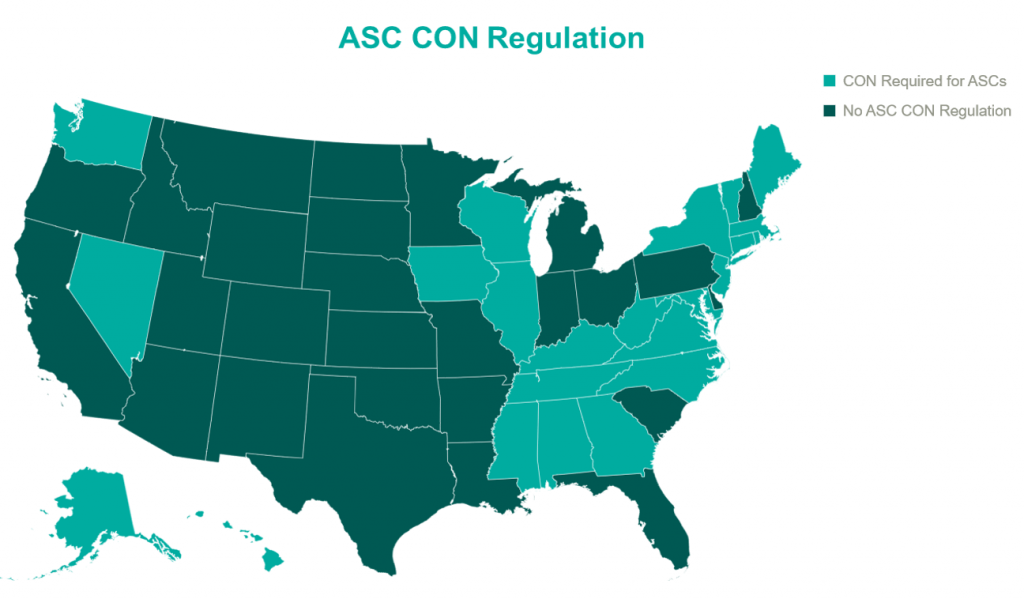
In 2023, the landscape of Certificates of Need (CONs) for ASCs underwent notable changes. South Carolina led the way with significant reform, eliminating CON requirements for most health facilities, including ASCs. North Carolina amended its CON law, reflecting a trend toward liberalizing these regulations. North Carolina’s modifications to its CON law specifically targeted easing the process for ASCs and certain medical facilities by adjusting the threshold for review. By raising the financial thresholds for mandatory review, ASCs can undertake significant investments in innovative technologies, expansions, or renovations without the need for a lengthy CON application and review process. The complete repeal of ASC CONs in North Carolina is expected in the coming years. In parallel, Mississippi and Georgia engaged in legislative actions to reevaluate their CON laws as well. Mississippi put forward a provision that would allow Hospitals to establish single-specialty ASCs without the requirement of a CON. Georgia proposed a bill that would eliminate CON requirement for hospitals and establish a unique healthcare service licensure process. With a potential domino effect that could sweep through many states, these regulation changes are important to keep an eye on in the coming years. The relaxation of CON laws may foster growth in the ASC sector with new center development, with more states likely to follow suit in the future, potentially leading to increased access to ASC services and further transformations in healthcare delivery and facility expansion.
The ASC sector experienced significant growth in 2023, driven by factors like industry consolidation, continued shift of care to outpatient settings, and new revelations in the regulatory environments. Key players expanded their operations, reflecting an overall increase in the number of centers managed by national operators. Higher-acuity cases continue the shift into outpatient settings as more procedures are added to the ASC Covered Procedures List. CMS’ policies and reimbursement rates played a crucial role in shaping the sector alongside the evolving landscape of CON regulations. Overall, the ASC market in 2023 demonstrated resilience and adaptability, positioning itself for continued growth and a more significant role in healthcare delivery.
At VMG Health, we’re dedicated to sharing our knowledge. Our experts present at in-person conferences and virtual webinars to bring you the latest compliance, strategy, and transaction insight. Sit down with our in-house experts in this blog series, where we unpack the five key takeaways from our latest speaking engagements.
I spoke about the 2024 regulatory changes from the Centers for Medicare & Medicaid Services (CMS) as well as the American Medical Association (AMA) CPT changes. These changes are important to stay up to date on to avoid audits and noncompliance.
For telehealth, the relaxations of those regulations and what’s permissible post-pandemic may be surprising. For example, Federally Qualified Health Centers can serve as distant site providers for behavioral health telemedicine services; Medicare patients can receive their behavioral health care through telehealth in their homes; behavioral and mental health services can be received through audio-only platforms.
For evaluation and management (E&M) services, the CMS and AMA shared/split E&M guidelines may be surprising to providers. In 2024, AMA redefined “substantive portion” and CMS adopted the CPT definition. Organizations should educate providers on these changes and establish ongoing monitoring and auditing of shared/split services to ensure compliance with revised guidelines.
The most impactful way for leaders to prepare is by concentrating on upcoming audit risks and identifying areas for improvement through internal audits.
To really ensure your practice is billing and coding correctly, using technology can remove some of that heavy lifting from your staff. VMG Health’s Compliance Risk Analyzer (CRA) is a suite of tools that analyzes every insurance claim your practice submits. The CRA identifies high-risk providers, services, and procedures. The solution provides your practice with a risk-based audit workflow that is easy to access and understand, allowing you to focus on patient care rather than audits and recoupment demands.
Monitor, monitor, monitor. All regulatory changes lead to greater audit risk when people don’t pay close attention to every requirement of those changes. Implement regular monitoring of coding and billing practices to mitigate risk and enhance revenue integrity for your organization.
Our team serves as the single source for your valuation, strategic, and compliance needs. If you would like to learn more about VMG Health, get in touch with our experts, subscribe to our newsletter, and follow us on LinkedIn.
Written by Johnny Zizzi, CPA, and Melissa Hoelting, CPA
In the dynamic world of healthcare mergers and acquisitions (M&A), decision-makers need to understand the intricacies of historical spend normalization and cash-to-accrual conversions for accurate financial analysis. One often underestimates the impact, but a critical factor in this process centers on accounting for supply cost inflation. As companies enter into transactions, they must consider how fluctuations in supply costs impact historical financial data and, subsequently, their future financial outlook. In an era of high inflation, financial due diligence takes on a new level of complexity and significance for businesses and investors alike. The impact of soaring prices and rapidly changing economic conditions can significantly affect the accuracy of financial assessments, making it imperative for financial professionals to adopt unique strategies and considerations in their due diligence processes.
In high inflationary periods, traditional financial metrics may lose their relevance. Businesses should prioritize inflation-adjusted financial analysis to obtain a more accurate picture of a company’s performance. Historically, healthcare inflation has outpaced overall inflation. Medical and surgical supply costs have steadily increased over time. From 2017 to 2021, average medical surgical supply costs increased by 6.5% each year. From 2019 to 2020, the increase in these supply expenses was approximately 3% before the more rapid increase of about 10% in 2021. With these significant increases and fluctuations, advisors must be able to recalculate key financial indicators and assess a company’s ability to maintain profitability and manage costs.
Converting financial statements from a cash basis to an accrual basis can significantly impact the quality of earnings, particularly when dealing with supply cost inflation. Under cash accounting, expenses are recognized only when cash changes hands, which can distort the true financial picture when supply costs are rising. To convert supply expenses on a cash basis, advisors typically begin by calculating monthly reported supply costs as a percentage of monthly revenue. Then, depending on the frequency of supply purchases, the average percentage of the last six to 12 months becomes each month’s adjusted supply cost percentage. However, with rising costs, advisors might need to reduce the lookback below six months regardless of the purchasing patterns, as using older data could result in understating supply costs for the most recent months. Thus, a financial due diligence team becomes essential in transactions with rising supply costs, as the cash-to-accrual process becomes more complicated and requires an in-depth analysis and conversation.
Rising labor expenses, growing inflationary pressures, declining admissions, and intermittent supply chain disruptions have placed significant pressure on profit margins across the healthcare industry. Through the mid-point of Q4 2022, the median hospital operating margin equaled (0.5%) as compared to 4.0% during this same period in 2021.
As inflation and supply chain uncertainties continued throughout 2023, forecasting and scenario analysis are paramount because they enable businesses to proactively manage the financial impact of rising costs and make informed decisions. This proactive approach allows companies to adjust pricing strategies, negotiate better contracts with suppliers, seek alternative sourcing options, or implement cost-cutting measures—all of which are vital for maintaining profitability and ensuring business continuity in the face of supply cost inflation.
If a company begins these steps before any potential transaction, it sets itself up for potentially favorable pro forma adjustments to offset any historical inflation. However, the key to receiving credit for these changes comes from having proper support and evidence of a downward trend in price, such as current invoices, signed contracts, or cost-per-volume analysis. Ultimately, instituting the results of forecasting and scenario analysis can serve the dual purpose of mitigating the adverse effects of inflation on current performance and providing an avenue for potential upside adjustments in future transactions.
Net working capital analysis takes on heightened significance in accounting for supply costs during times of high inflation within the context of a quality of earnings analysis. As supply costs rise, they can impact a company’s balance sheet, affecting both assets and liabilities. For example, inventory values may increase due to higher supply costs, potentially inflating total assets. Meanwhile, accounts payable may also rise as the company incurs additional liabilities for unpaid invoices related to these increased costs. Advisors must align the timing of cash flows associated with assets and liabilities to mitigate liquidity risks stemming from supply cost inflation. Additionally, the typical 12-month lookback may be inappropriate in times of rising costs, as older periods will not reflect current and future market conditions. As a result, many transactions shift towards a three- to six-month lookback to set the price/earnings-to-growth (PEG). In times of rising prices, the due diligence team’s role becomes even more essential: Determining the balance sheet impact of market conditions requires careful consideration.
Healthcare M&A is undeniably dynamic, and the ability to navigate its intricacies is contingent upon a deep understanding of historical spend normalization and cash-to-accrual conversions, as well as the nuanced impact of supply cost inflation. The rising tide of inflation has placed an exceptional level of complexity and significance on financial due diligence for both businesses and investors in healthcare. To tackle these challenges effectively, we have highlighted the importance of inflation-adjusted financial analysis to provide a more accurate depiction of a healthcare organization’s performance in the face of escalating costs. Transitioning from cash to accrual accounting methods and employing pro forma adjustments are vital tools for enhancing the quality of earnings analysis in the healthcare landscape. Moreover, robust forecasting and scenario analysis, as well as vigilant net working capital management, are fundamental strategies in addressing the complexities introduced by supply cost inflation. As increased inflation shows little signs of subsiding, the role of financial due diligence in healthcare transactions becomes even more vital in addressing the current market conditions’ added complexities and considerations.
Physician compensation continues to have new areas to tackle, from payments for quality to excess call to shared savings. In addition, VMG Health has recently seen an increase in unlisted procedures and inquiries from organizations on how to appropriately compensate physicians for their services. It is important to note that while unlisted procedures may still be reimbursable by a payor(s), they do not yet have a corresponding work relative value unit (WRVU) assigned by CMS and the American Medical Association (AMA).
This raises the question from health systems: what is an appropriate methodology to account for unlisted services when determining physician compensation if the physician is paid based on a WRVU productivity model and/or a base salary with a WRVU-based bonus model?
Due to the complexity of the CMS Medicare Physician Fee Schedule (MPFS) and the magnitude of codes listed, CMS and the AMA do not rebase WRVUs for each CPT code each year. As a result, advances in medical technology and the development of new, innovative procedures lead to services being provided to patients who are unlisted on the MPFS. VMG Health has observed a sizeable uptick in unlisted services including, but not limited to, implants, imaging, surgical, and laparoscopic services.
When determining physician compensation for unlisted services, health systems should ensure the proposed payment is consistent with fair market value (FMV). In addition, contractual terms should be considered to prevent the potential for duplicate payments. One approach VMG Health has frequently observed in the marketplace is compensating the physician based on a percentage of revenue received for the unlisted service. A few important factors to consider:
Another approach when compensating a physician for unlisted procedures is a comparative code method and utilizing the WRVU associated with the comparative code. However, it can be difficult to confirm an accurate comparative code for certain procedures. This could understate or overstate the WRVU associated with the unlisted service. There are several factors to consider when selecting a comparison code such as:
As more new technology is introduced to the healthcare market, determining physician compensation for unlisted procedures will continue to be a topic of discussion for health systems. Before paying physicians for unlisted services, health systems should ensure that the compensation arrangements are commercially reasonable and do not result in compensation that exceeds FMV.
Written by Grant White, CPA, Colin Haslett, and Joe Scott, CPA
In the healthcare industry, investors evaluate potential investment opportunities that typically first come through sell-side marketing materials like teasers or confidential information memorandums (CIMs). These materials show the company’s financial performance over the past two years and projections for the current and next two to three years. It’s crucial to note that these projections naturally involve assumptions about future growth.
While these assumptions help buyers grasp the company’s strategic direction and growth opportunities, relying solely on them might lead to overestimations in purchase prices or underperformance post-acquisition. Financial projections have the potential to be biased and overly optimistic by overlooking potential market shifts or industry trends that may impact performance.
For instance, in the healthcare services industry, projected financial performance might hinge on key events such as:
Prudent investors recognize the importance of buy-side due diligence. This diligence serves not just to verify historical data, but also to test the credibility of projected financial assumptions. Diligence teams must reconcile key documents, analyze historical financial and operational trends, and engage in candid conversations with key management personnel to evaluate these assumptions.
To illustrate this point, consider two scenarios wherein a company projects $1 million in revenue from hiring a new provider in its CIM distributed to potential investors:
In summary, buy-side diligence is instrumental in verifying management’s claims and assessing the feasibility of a company’s projections. The insights gained through the diligence process help buyers make informed investment decisions, guard against inflated purchase prices, and provide buyers with more accurate expectations of post-close performance.
By Taylor Anderson, CVA, Taylor Harville, and Trent Fritzsche
The Department of Health and Human Services Office of Inspector General (OIG) posted Advisory Opinion No. 23-07 on October 13, 2023 (“Opinion”). The Opinion was related to the request submitted by a redacted requestor (“Requestor”) to pay bonuses to its employed physicians based on net profits derived from certain procedures performed by the physicians at ambulatory surgery centers (ASCs) operated by the Requestor (“Proposed Arrangement”). More precisely, the Requestor was seeking the opinion of the OIG about whether the Proposed Arrangement would lead to sanctions under the federal Anti-Kickback Statute (AKS).
Based on the relevant facts detailed in the Opinion, the Proposed Arrangement consisted of the following key facts and circumstances:
Ultimately, the OIG concluded the quarterly bonus structure would not generate prohibited remuneration under the federal AKS.
In the analysis summarized in the Opinion, the OIG highlighted several considerations that ultimately led to the conclusion. These included the following:
The OIG also noted that a compensation structure tied to profits generated from services provided to patients referred by the compensated party is suspect under the federal AKS, particularly in arrangements where the physician is an independent contractor or there is a different corporate structure. However, because the Proposed Arrangement satisfied the regulatory safe harbor for employees, the compensation would not be prohibited.
Lastly, the OIG noted that while the Proposed Arrangement would not generate prohibited remuneration under the federal AKS, it was clear that it expressed no opinion as to whether the Proposed Arrangement would implicate the physician self-referral law.
When developing unique compensation structures with physicians or any service provider it is important to be mindful of the various laws and statutes in place. Proper review and consideration of the federal AKS and other healthcare regulations is essential for any organization when structuring compensation plans to ensure proper regulatory compliance. Additionally, documentation of fair market value and commercial reasonableness is another key element of any provider compensation arrangement, especially if those providers are a source of potential referrals.
For additional guidance related to structuring and valuing provider compensation arrangements, please reach out to Managing Director Jonathan Helm at jonathan.helm@vmghealth.com to learn more.
*The Opinion noted there were two ASCs operating as corporate divisions of Requestor.
On November 2, 2023, the Centers for Medicare & Medicaid Services (CMS) released the CY 2024 Hospital Outpatient Prospective Payment System (OPPS) and Ambulatory Surgery Center (ASC) payment system policy changes and payment rates final rule. Based on the final ruling, CMS finalized its proposal to continue to align the ASC payment system by using the hospital market basket update, rather than the Consumer Price Index for All Urban Consumers (CPI-U) for an additional two calendar years through 2025. The final rule resulted in overall expected growth in payments equal to 3.1% in CY 2024. This increase was determined based on a projected inflation rate of 3.3% less the multifactor productivity (MFP) reduction of 0.2% mandated by the ACA. This is an increase of 0.3% from the proposed rule. In an official AHA statement on the CY 2024 OPPS final rule Executive Vice President of AHA Stacey Hughes said:
Presented in the chart below is a summary of the historical net inflation adjustments for CY 2015 through CY 2024. The annual inflation adjustments are presented net of additional adjustments, such as the MFP reduction, outlined in the final rule for the respective CY. The CY 2024 inflation adjustment is slightly lower than the increase observed last year, although it continues to be elevated compared to the adjustments observed prior to 2023 largely driven by labor and supply cost pressures.
CMS noted in its fact sheet that “in addition to finalizing payment rates, this year’s rule includes policies that align with several key goals of the Biden-Harris Administration, including promoting health equity, expanding access to behavioral health care, improving transparency in the health system, and promoting safe, effective, and patient-centered care. The final rule advances the Agency’s commitment to strengthening Medicare. It uses the lessons learned from the COVID-19 PHE to inform the approach to quality measurement, focusing on changes that will help address health inequities.”
CMS finalized the addition of 37 surgical procedures to be added to the ASC CPL for CY 2024, outlined in the table below. These include 26 dental codes that were included in the proposed rule, and 11 surgical codes that were not included in the proposed rule -most notably total shoulder arthroplasty. These codes correspond to procedures that have little to no inpatient admissions and are widely performed in outpatient settings.
CMS has projected total ASC payments in 2024 will increase from approximately $207 million in 2023 payments to approximately $7.1 billion. The source of this increase in payments is a combination of enrollment, case mix, and utilization changes.
In conclusion, the trend of rising labor and supply costs continues to play out through 2023 and into the finalization of the CY 2024 payment system. CMS continues to show stability on the annual inflation adjustment by utilizing the hospital market basket to update rates and extending the five-year interim period. However, as Hughes has said, the costs of providing care continue to rise rapidly which directly impacts health systems’ margins and ability to provide effective care. CMS finalized the addition of 37 procedures to the ASC CPL for CY 2024, which is a substantial increase from the addition of only four codes in 2023. These additions have created positive feedback from outpatient providers due to the ability to continue to perform additional procedures in the ASC setting safely and successfully.
On November 2, 2023, the Centers for Medicare & Medicaid Services (CMS) unveiled a significant final rule marking the latest step in the administration’s comprehensive effort to create a more equitable, accessible healthcare system. The rule introduced policy changes that will impact Medicare payments under the Physician Fee Schedule (PFS), effective from January 1, 2024. Here are some key highlights and takeaways:
In CY 2024, CMS will enact a 1.25% reduction in overall payment rates under the PFS compared to CY 2023. However, this will be accompanied by substantial increases in payment for primary care and direct patient care. The final CY 2024 PFS conversion factor is set at $32.74 which represents a 3.4% decrease from the 2023 conversion factor of $33.89.
CMS is introducing a separate add-on payment for HCPCS code G2211, effective from January 1, 2024. This add-on code will recognize the resource costs associated with primary care and longitudinal care during evaluation and management visits. Use of the G2211 code will likely increase total wRVU volumes by 5-10% for many E/M-heavy specialties.
For CY 2024, CMS is revising the definition of a “substantive portion” of a split (or shared) visit. The substantive portion will be defined as either more than half of the total time spent by the physician or non-physician practitioner during the visit or a significant part of the medical decision-making process. This change is in response to public feedback, and it aims to provide more flexibility in billing for split (or shared) E/M visits. Previous indications from CMS did not include medical decision-making in the criteria for “substantive portion,” which would have had a considerably higher impact on provider wRVU volumes in inpatient settings.
CMS is expanding telehealth services under the PFS for CY 2024. This includes the expansion of telehealth originating sites to include patients’ homes, the inclusion of additional healthcare practitioners in the definition of telehealth practitioners, and the continuation of payment for telehealth services furnished by RHCs and FQHCs. The rule will also postpone the requirement for in-person visits before initiating mental health telehealth services.
In CY 2024, telehealth services furnished in patients’ homes will be paid at the non-facility PFS rate to ensure continued access to these essential services. The definition of direct supervision for telehealth will remain in place through December 31, 2024.
VMG Health’s experts can assist organizations by assessing the new Medicare Physician Fee Schedule changes including how it will impact physician compensation spend. For more insight on physician compensation strategies and alignment, download the 2023 Physician Alignment: Tips & Trends Report.
Written by Tyler Perper and Matthew Marconcini, CPA
The following article was published by Becker’s Hospital Review.
The landscape of healthcare is continually evolving, with a growing emphasis on providing better outcomes for patients while controlling costs. Value-based care (VBC) is a departure from the traditional fee-for-service (FFS) model and is transforming healthcare delivery into a capitated model that balances the total cost of care with the quality of patient outcomes. Investment within VBC or alternate payment models (APMs) quadrupled from 2019 to 2021, while investment in legacy-care delivery models has remained relatively flat. Additionally, the estimated number of Medicare enrollees participating in Medicare Advantage (MA) plans is expected to increase by more than 24% in 2023 compared to the 2022 MA enrollment growth. The explanation for the significant VBC investment and the growth in VBC players is primarily driven by the acknowledgment amongst U.S. policymakers, providers, and payers that VBC offers a sustainable model of care for patient populations across the country, as well as the opportunities presented by new technology and tech-enabled services that facilitate VBC for both providers and payers.
VBC is a payment model that incentivizes healthcare providers to focus on delivering high-quality care while containing the costs. Unlike the FFS payment model, in which providers are reimbursed based on the number of services they render, the APM model encourages providers to prioritize the patient’s health and well-being by promoting preventive measures, care coordination, and better health outcomes. In addition, as providers transition to value-based care their reimbursement model aligns more closely with that of payers. This shift requires providers to gain a fundamental understanding of the expertise needed for managing risk, similar to payers.
Managing risk and risk sharing in healthcare refers to the practice of distributing and managing the financial risks associated with healthcare services among different stakeholders, such as insurers, healthcare providers, and sometimes patients. It involves mechanisms and arrangements designed to ensure the financial burden and responsibility for healthcare costs are shared rather than being shouldered entirely by one party. The goal is to promote cost efficiency and improve healthcare quality.
Transitioning to VBC reimbursement models presents providers with a spectrum of options. At the outset, pay-for-performance models link claims reimbursement to quality and value. This means that providers are reimbursed using a fee-for-service structure while qualifying for value-based incentives or penalties based on quality and cost performance. Such models are particularly favorable for smaller practices lacking extensive health IT and data analytics infrastructure.
Moving further along the spectrum, shared savings arrangements offer higher financial rewards and allow providers to retain a portion of the savings if they reduce healthcare spending below established benchmarks. Shared risk models, where providers must cover healthcare costs exceeding benchmarks, foster greater accountability, especially within accountable care organizations.
Finally, capitation payments place full financial risk on providers and offer either global capitation with a fixed payment for all services or partial capitation covering specific services with all other care reimbursed through fee-for-service. While capitation models provide prepaid reimbursements and an incentive for innovation, they present challenges related to quality measures and data sharing. Overall, this spectrum allows providers to select the most suitable value-based reimbursement structure to enhance revenue and adapt to evolving healthcare reimbursement models.
Medicare, including both MA and traditional Medicare, serves as a hub for VBC innovation in the United States. Centers for Medicare & Medicaid Services (CMS) is the largest payer in the healthcare system and holds significant influence in shaping industry standards and promoting the adoption of APMs. The elderly population, which is covered by Medicare, tends to have higher rates of illness and multiple health conditions. This, coupled with the long-term coverage provided by Medicare, makes VBC interventions particularly impactful in reducing the cost of care for these patients.
Within traditional Medicare, the Medicare Shared Savings Program (MSSP) is a widely participated program. The program offers mild shared savings and shared-risk arrangements. The more intensive-risk ACO REACH program attracts more sophisticated VBC providers that are often engaged in MA-capitated contracts.
Currently, VBC is not as common within the Medicaid and commercial markets on a national basis for numerous reasons. For Medicaid, the lower rates of reimbursement (in comparison to Medicare and commercial payers) limit the VBC capitated care model. Also, the high fragmentation of Medicaid regulation from state to state limits the scalability of the APMs. There is a high level of enrollee turnover within Medicaid programs which makes it more difficult to understand individual patient populations over the course of time.
The lack of implementation within commercial markets is due to one main reason: the demographic profile of a typical commercial patient (skewed younger and of higher socioeconomic status) leads to lower health risks. This means that investing a dollar in primary care for a commercially insured individual results in lower, less substantial total cost of care savings compared to Medicare or Medicaid patients. However, the traction of Medicaid and commercial patients in risk-sharing arrangements depends on the market across the U.S. In certain markets, such as California, risk-based arrangements are more common due to the early adoption of health maintenance organizations and the way those programs have shifted into risk-bearing organizations. As data analytics improves and payor-provider convergence continues, the development of Medicaid and commercial VBC structures is increasing.
In the traditional FFS models, the primary relationship was between payors and providers. The shift towards value-based care has led to the evolution of the players involved. These relatively novel VBC participants can be categorized into three main groups, each with its own subcategories.
Many of the prominent VBC players fall within the provider management category. This category aims to back or acquire medical practices operating within VBC frameworks. There are several models that facilitate VBC provider management. There are those operators who seek to establish new clinics and healthcare practitioner recruitment by prioritizing consistent branding and patient experience while tackling capital-intensive challenges.
Other operators contract directly with self-insured employers by offering comprehensive primary care services that often include behavioral health and pharmacy, and by promoting clinic growth through employer contracts. Another provider management model of VBC is the acquisition of provider groups. This model transitions them into physician-owned primary care practices and shifts the revenue toward taking on riskier VBC contracts. Lastly, there are operators that focus on taking specialty practices, such as orthopedics, oncology, or nephrology, and transitioning them into VBC contracting. This is done by leveraging specialty-based operational sophistication and specific specialty VBC payment models.
The second category of VBC players comprises organizations that opt for collaboration with independent providers or medical groups rather than acquiring practices outright. These entities, often referred to as “VBC enablers,” play a pivotal role in facilitating the transition to value-based care. They offer a comprehensive suite of services, including advanced technological solutions, expert consulting, and various forms of support. Through their involvement, these enablers actively engage in the shared risk associated with value-based contracts, demonstrating their commitment to advancing healthcare transformation and fostering a culture of collaboration and innovation. By forging these strategic partnerships, VBC enablers empower independent providers and medical groups to navigate the complex landscape of value-based care successfully, ultimately improving the quality and efficiency of healthcare delivery for all stakeholders involved.
The third category encompasses the technological solutions and ancillary services that play a pivotal role in facilitating the shift from FFS to VBC. There are many different players within this category and the technology-based solutions these companies provide include patient population/risk management, care coordination, surgery coordination, outcomes measurement, and care management. Patient population management is software that helps providers track patient health outcomes, utilization patterns, and risks. It aids in identifying high-risk patients and implementing interventions to reduce costs. Care coordination is the technology behind building quality referral networks, ensuring closed-loop referrals, and sharing patient information among care providers. Surgery coordination is software used to orchestrate surgeries efficiently and manage costs, especially in a VBC context. Outcomes measurement highlights the importance of understanding the quality metrics of the care provided and managing costs of care. Furthermore, care coordination is what guides patients through the healthcare system to improve outcomes and minimize costs. This includes services for chronic condition management and care navigation. These players can provide one or multiple of the services previously described and often contract with other entities in the VBC environment.
The transformation towards VBC healthcare delivery models holds the promise of significant benefits that extend to both cost reduction and the enhancement of satisfaction among providers and patients alike. By concentrating on preventive measures and evidence-based treatments, VBC stands to ameliorate health outcomes and particularly benefit patients with chronic conditions. Furthermore, it promotes the efficient allocation of resources, thereby generating cost savings for both patients and healthcare systems, in particular. One pressing issue is the high rate of hospital readmissions, and it requires attention because it is. Currently hovering at approximately 15% within Medicare. Through an increased emphasis on care coordination and follow-up care, VBC aims to mitigate the frequency of avoidable hospital readmissions. Additionally, it underscores the importance of the patient’s experience and positions the patient at the core of the healthcare process. This ultimately results in heightened patient satisfaction and engagement. Lastly, it addresses physician satisfaction by reducing resource utilization while potentially maintaining reasonable compensation levels. Ultimately, VBC stakeholders expect to create a healthcare system that is more sustainable and centered around the needs of patients, while unlocking profitability and returns for investors.
Although promising, VBC presents its own set of challenges for providers and payers alike. Effective VBC relies on robust data collection and analysis capabilities which necessitates technological infrastructure upgrades for many healthcare organizations. Additionally, determining meaningful quality metrics for specialty care can be intricate due to the specificity of outcome measures required for different conditions. Providers may encounter financial risks if they fail to meet VBC targets, particularly in shared savings or full risk-sharing arrangements. Ensuring alignment of incentives among various stakeholders, including physicians, hospitals, and payers, is pivotal to the initiative’s success. These challenges must be navigated to fully realize the potential benefits of VBC.
Despite the significant hurdles in the way, the healthcare market’s accelerating shift to VBC signifies a profound change towards patient-centered and outcome-driven healthcare delivery. As the healthcare landscape continues to evolve, embracing VBC offers the prospect of enhancing patient outcomes, improving the patient experience, and promoting cost-effective care. However, to unlock the complete potential of this shift in payment models, it may be necessary to seek guidance from healthcare advisors who possess specialized expertise in this field. These advisors play a vital role in helping address patient population challenges, defining pertinent quality metrics, and aligning incentives effectively. In addition, transactions for entities in the VBC space, or healthcare operators looking to enter the VBC space have a need for a specialized understanding of these relatively novel APM models in terms of valuation, reimbursement dynamics, and related transaction agreements.
Related Content