2021 Diagnostic Imaging Rate Changes: Impact & Outlook
April 20, 2021
Written by Greg Henderson & Samuel Betsill
Diagnostic imaging in the United States is estimated to generate over $100 billion annually, with outpatient, non-hospital-based imaging accounting for approximately 40% of the total market. Since Congress passed the Deficit Reduction Act of 2005, significant reimbursement rate cuts have been made to the diagnostic imaging business. Since 2010, the Center for Medicare Services (“CMS”) has further reduced reimbursement for imaging procedures by revising the methodology used to determine relative value units (“RVUs”) under the Medicare Physician Fee Schedule (“MPFS”). These cuts have impacted all imaging modalities, but some more than others due to perceived over-utilization. These rate cuts will result in increased pressure on independent freestanding operators to pursue affiliations with larger platform imaging center operators.
Medicare pays for non-hospital-based imaging services under the MPFS. On December 27, 2020 CMS passed the revised MPFS that cut reimbursement primarily for the professional component of radiology procedures. The charts below detail the CMS reimbursement rate by imaging modality.

Note: Payment calculated based on evenly weighted average of all CPT codes within each modality on a national average payment basis. Actual reimbursement may vary depending upon geography.
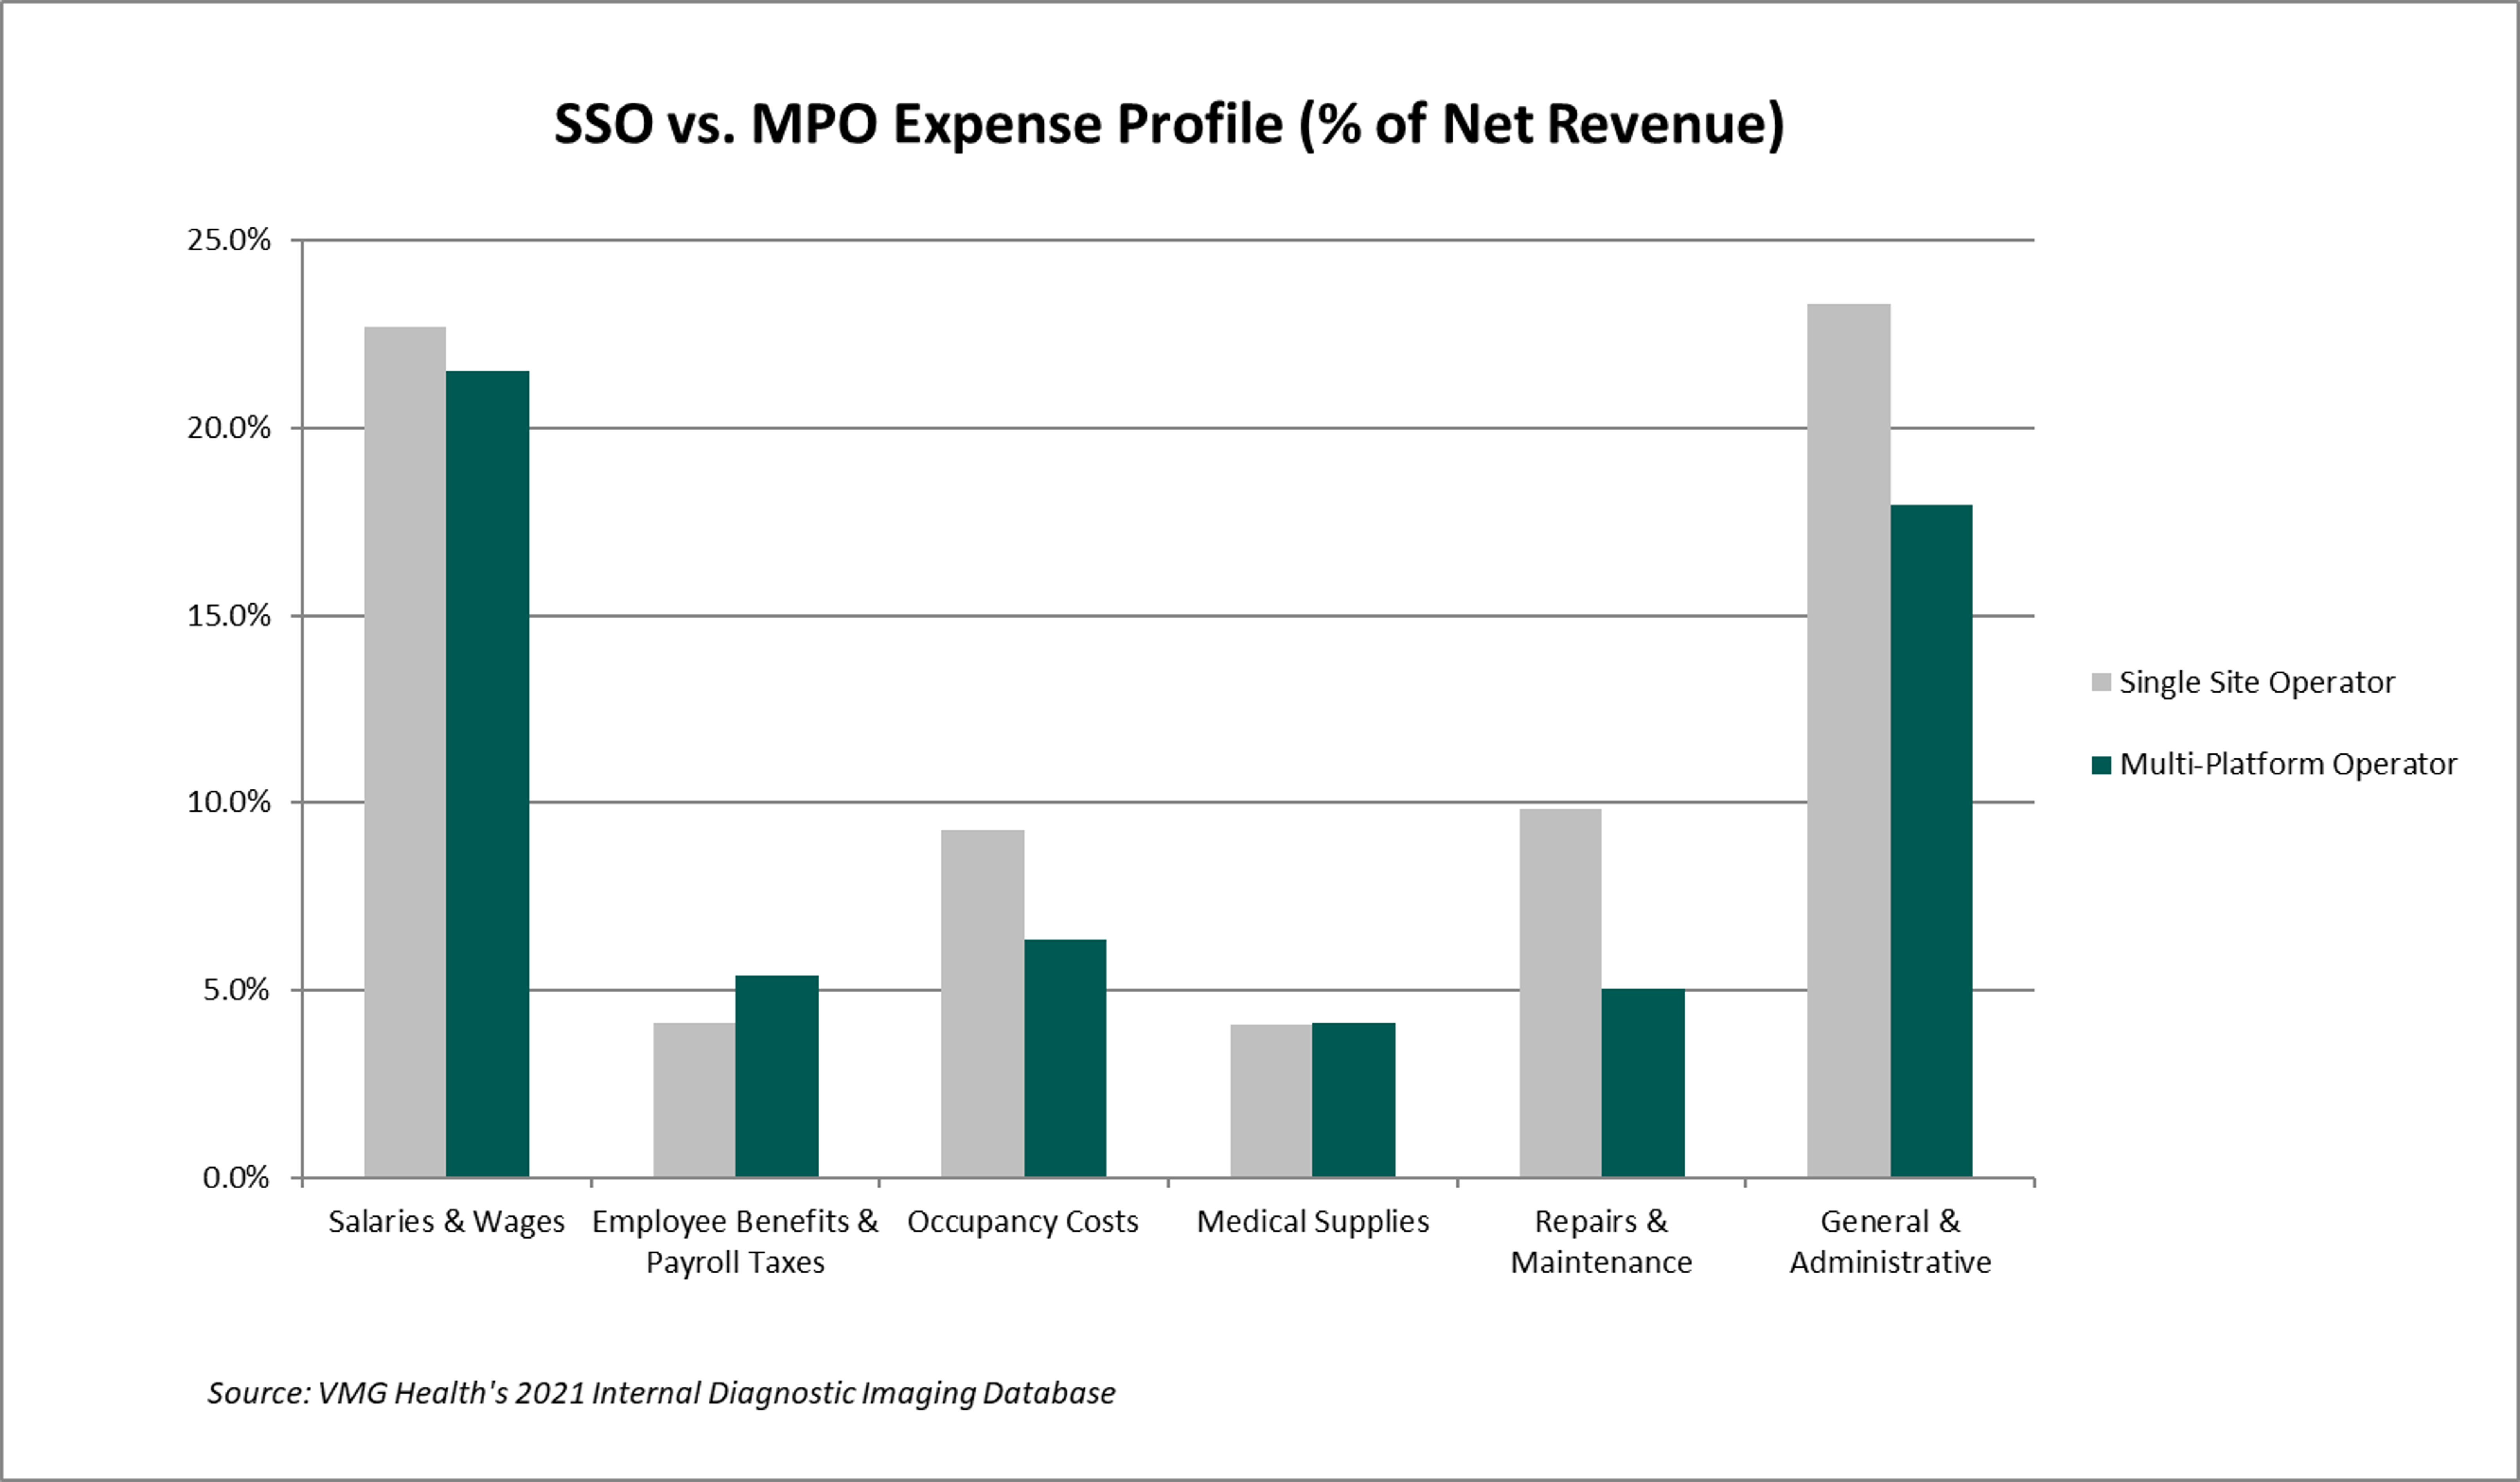
These reimbursement rate cuts will likely affect certain operators more than others. Single site operators (“SSOs”), in contrast to multi-platform operators (“MPOs”) are expected to face greater challenges due to the 2021 MPFS rate cuts.
Single Site Operators
The single site operator, defined as freestanding and in-office, will face the most severe impact from the 2021 MPFS rate cuts if they rely heavily on government payors.
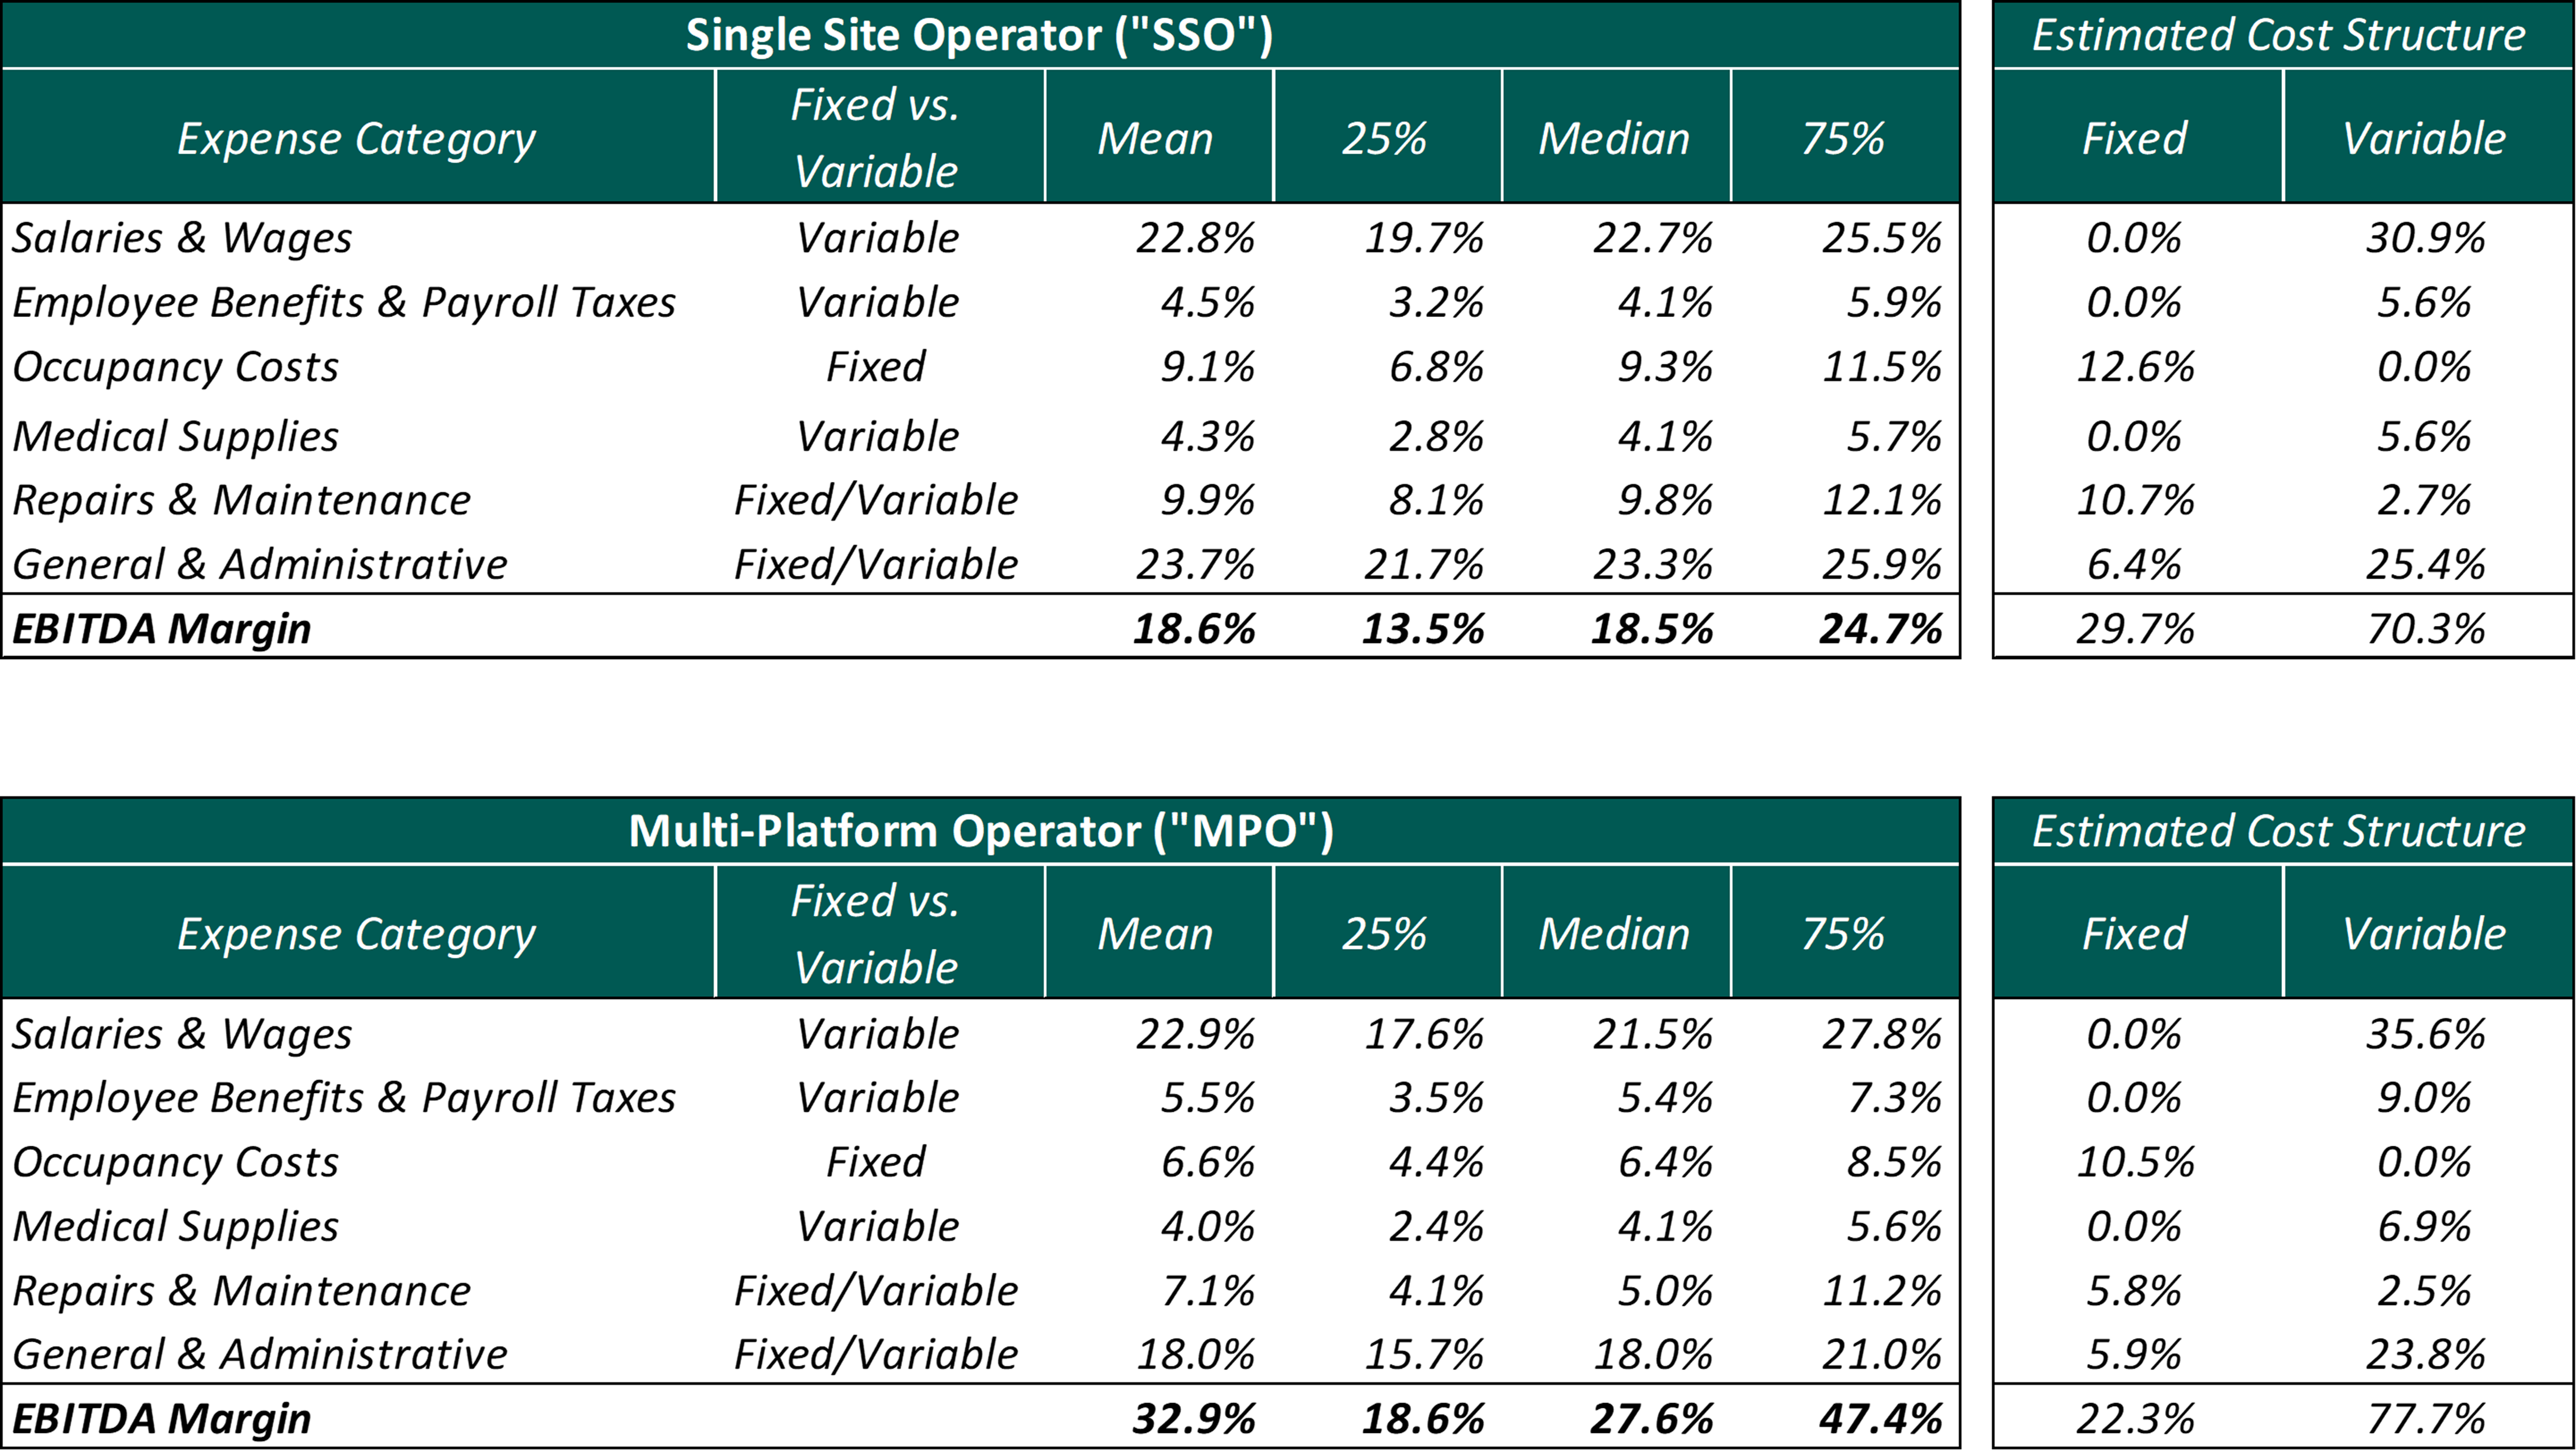
Based on VMG’s internal diagnostic imaging database, the median EBITDA margin for SSOs is approximately 18.5% with approximately 29.7% of operating expenses designated as fixed. Conversely, the MPO has a median EBITDA margin of approximately 27.6% with approximately 22.3% of operating expenses designated as fixed. Please note, these percentages are comprised from a limited sample size and not necessarily representative of all imaging centers.
These dynamics expose SSOs to more operating risk. Compared to a reduction in scan volume, where variable expenses trend more closely with volume, reimbursement rate cuts have a direct negative impact to the bottom line. Due to the high fixed cost nature of a diagnostic imaging business (predominantly repairs & maintenance and occupancy costs), future capital requirements and the access to said capital, any variance in an SSO’s business model can create significant impacts to underlying earnings and the value of the business. Additionally, centers with a large percentage of government payors will experience a more severe impact.
The SSO has two potential options to combat reimbursement pressure: invest more heavily in advertisement and marketing or renegotiate rates with commercial payors. The former would require higher short-term investments, but if implemented correctly, could drive higher scan volume, and increase revenue to mitigate reimbursement cuts. However, this option might require increased spending on advertising and marketing that the SSO may not have the margin to sustain.
Alternatively, given commercial payor’s increasing interest in consumer driven health plans, SSOs could attempt to negotiate increases in reimbursement rates. This is made possible by the lower cost structure of freestanding and office-based imaging centers as compared to a hospital-based provider. However, many smaller SSOs may not have the leverage to renegotiate with large payors. Ultimately, SSOs that have sufficient cash flow to invest in advertisement and marketing, or SSOs that have the leverage to negotiate more favorable rates with commercial payors will succeed more in mitigating decreases in operating revenue caused by reimbursement rate pressure.
Multi-Platform Operators
Multi-platform operators (“MPOs”) are characterized as diagnostic imaging centers with multiple locations, providing multiple imaging modalities at each location. The MPO and the SSO alike will be affected by the 2021 Medicare rate cuts, but given greater access to capital, operational efficiencies, economies of scale, and more sustainable profit margins, the MPO is likely to be be more favorably positioned to withstand the effects.
As illustrated below, operational efficiencies and economies of scale can be realized in multiple areas of the MPO business. Due to multiple locations, general and administrative costs, such as billing expenses and management oversight, can be allocated across many centers. Additionally, operational staffing efficiencies may be leveraged as MPOs have the benefit of utilizing shared staff across multiple centers, which can effectively reduce the number of paid hours per scan. In contrast, these staffing efficiencies are not attainable by the SSO. Although decreases in reimbursement rates will negatively impact the net revenue for MPOs, effective operational efficiencies and economies of scale can reduce operating expenses and mitigate the impact that reimbursement cuts have on the MPO’s bottom line.
Publicly traded imaging center companies serve as the closest industry benchmark for the MPO. The largest publicly traded diagnostic imaging center company identified is RadNet, Inc. (NASDAQ: RDNT). RadNet’s stock price has increased over the last twelve months and has remained relatively steady at 9.3x Total Enterprise Value / EBITDA. As discussed in RadNet’s 2020 fourth quarter earnings release, the recent positive performance of the company is attributable to a focus on cost reductions, center consolidations, and operational efficiencies, resulting in an Adjusted EBITDA margin of 16.4 percent, an increase of 80 basis points (0.8%) relative to the previous year’s fourth quarter1.

Ultimately, the continued success of the MPO model relies on management’s ability to capitalize on the cost-cutting benefits associated with operating multiple imaging center locations. Although reimbursement rate cuts will impact revenue, realizing the available operational efficiencies will result in a lessened impact to the bottom line. Coupled with advantageous access to capital, the market will see expansion in the scope and size of MPO imaging services.
Conclusion
The 2021 Medicare rate cuts for the diagnostic imaging industry will affect the profitability of the industry, but SSOs, as opposed to MPOs, will likely be impacted more negatively. It is reasonable to assume that there will be continued consolidation in the market as reimbursement pressures negatively impact earnings of SSOs. Without the ability to increase scan volume, SSOs will likely be approached by larger organizations (MPOs) or health systems that have access to capital looking to expand breadth of sites and services. Depending on the specific operator, measures can be taken to reduce the impact of rate cuts, but if the SSO is unable to adapt to the current pricing pressures by engaging in the strategies outlined above, it is probable the SSO will seek joint venture models or outright buyouts by MPOs, health systems, or management companies.

Sources:
- https://www.radnet.com/about-radnet/news/radnet-reports-fourth-quarter-results-record-revenue-and-adjusted-ebitda-and
2 Major Themes from Public Healthcare Firms Trailing COVID-19 – Part 1: COVID’s Trailing Effects
April 14, 2021
Contributors: Madi Whyde, Alex Malin, Spencer Coronado, Keith Ponsler
As the healthcare sector begins to recover from the coronavirus (“COVID-19”) pandemic, insights and experiences from payors and providers paint an optimistic picture for 2021.
In this two-part series, VMG has summarized key observations regarding the following two major themes from public healthcare firms:
Part 1: COVID-19’s Trailing Impact on Payors and Providers
Providers: Near Pre-COVID-19 Levels; Referral Pattern Shifts
An unexpected surge in COVID-19-related volumes in the fourth quarter of 2020 led to a period of anxious anticipation for stakeholders awaiting the release of the year’s earnings reports. However, Q4 2020 EBITDA was unexpectedly in-line or above Q4 2019 levels. Despite the challenges providers faced throughout the year, COVID-19 appears to have spurred innovation, collaboration, and other efficiencies for public operators. Q4 2020 earnings calls, the latest occurring on March 8, 2021 (RadNet), consisted of management’s reflections on the year, providing insight into the trailing effects of COVID-19. Many of the public sector’s providers have indicated volumes returning toward pre-COVID-19 levels, while some sub-sectors continue to be disproportionately impacted. In particular, lower acuity cases in the acute care sector and post-COVID-19 patients entering the physical therapy and rehabilitation spaces. Home health and hospice providers additionally indicated a burgeoning shift in referral patterns toward lower cost of care options in home health services.
Acute Care
“Despite another surge in COVID cases, hospital volumes held steady compared to Q3. Our USPI surgical volume trends improved slightly, recovering to about 95% of 2019 levels. As we’ve discussed in the past, more complex and emergent procedures have recovered from the pandemic at a stronger pace than less critical, lower acuity care. Our COVID inpatient cases were approximately 11% of our Q4 hospital admissions compared to about 10% in the third quarter.”
Daniel J. Cancelmi, CEO & Executive VP – Tenet Healthcare Q4 2020 Earnings Call Transcript
“Quarter-over-quarter, our same-store admissions for our acute care hospitals alone was up almost 20%, up 18%. In addition to that, many of the operators, as I mentioned on the last earnings call, were able to make lot of expense adjustments. We’ve seen that with some of the HCA reporting. That is the same thing with our operators as well. So, I think that as HCA reported, I think that they all will come out of this in a much stronger position. And we are very excited about where they are operationally, and we’ll continue to see those numbers grow. I do not know when we get back to a trailing 12 above where we were pre COVID, but these are very, very strong numbers. When you think about a 2x coverage with an entire quarter being shut down, that’s extremely strong.”
Edward K. Aldag, Founder, Chairman, President & CEO – Medical Properties Trust, Inc. Q4 2020 Earnings Call Transcript
“In terms of the rebound of this current wave, as I said earlier, cases peaked mid-January. We were already active in our redeployment plans, just like we have in the subsequent waves — or I’m sorry, previous waves of COVID, wave 1 and wave 2. A little bit slower of a rebound in some of our communities, I think largely due to some patient hesitancy. We’re hearing a little bit more from our providers that patients are getting the vaccine and now want to wait for that vaccine to take effect. So, we say that with optimism that bringing patients back into the health care system vaccinated, reducing the spread, all that would bode well for us in the near to midterm.”
Tim L. Hingtgen – CEO & Director – Community Health Systems Q4 2020 Earnings Call Transcript
“Across many dimensions, we improved our enterprise capabilities, which should allow us to support our local health systems better and enhance their abilities to provide higher quality care with greater efficiency. More importantly, we demonstrated an organizational ability to respond quickly and effectively to possibly the greatest challenge the company has ever experienced. And now I believe we are emerging on the backside of this event stronger and better positioned to grow and drive value for our stakeholders.
In the face of the highest surge yet of the COVID-19 pandemic, we finished the year with strong financial results in the fourth quarter. These results were driven once again by highly acute inpatient volumes, coupled with solid cost management.”
Samuel N. Hazen, CEO & Director – HCA Healthcare, Inc. Q4 2020 Earnings Call Transcript
“During the fourth quarter of 2020, we also continued to experience a material unfavorable impact on our operations and financial results from the COVID-19 pandemic before giving effect to the revenues recorded in connection with the CARES Act and other governmental grants. Specifically, we experienced an increased wave of COVID patients in December 2020, which peaked in the first half of January of 2021. The negative impact resulting from this elevated level of COVID volumes was primarily a function of accompanying declines in elective and scheduled procedures, declines in both acute and behavioral patient days, along with increased expense pressures, particularly on salaries and wages.
What we have generally noted in 2020 is that the level of intake or inquiries has remained rather strong. And what has really occurred, particularly, I think, later in the year, is more challenges for us to meet that demand either because of COVID patients in our behavioral facilities that preclude us from admitting non-COVID patients, proxy for them on their units on their floors, whatever, or because we’ve got a significant chunk of our labor force that either has been exposed to the virus or has the virus or is out for some other, I’ll call virus-related reason, and we simply can’t sort of operate all of our beds in a particular hospital or a particular geography at a point in time.”
Steve G. Filton, Executive VP, CFO & Secretary – Universal Health Services, Inc. Q4 2020 Earnings Call Transcript
Post-Acute Care
Post-acute care has been uniquely impacted by the COVID-19 pandemic, with drops in patient volume at the start of 2020 giving way to increased referral patterns for home health by the end of 2020. With quality of care in home settings increasing, the aging boomer population, and COVID-19 causing individuals to want to receive treatment in the comfort of their own home, home health is positioned to see a large increase in patients moving forward.
“Factors that have impacted our volumes include the number of COVID-19 cases in a community, the status of operations at acute care hospitals, the number of exposed or positive staff in quarantine, delays in obtaining COVID-19 test results for patients and employees and capacity limitations created by semi-private rooms in some of our hospitals. While COVID patients do not comprise a large percentage of our patients, many of our hospitals, home health agencies and hospice agencies treat patients recovering from the virus. These patients, many of whom have spent time on ventilators, had endured extended stays at an acute care hospital. They are extremely weak and require intense rehabilitation to regain both their strength and cognitive abilities.”
Mark Tarr, Executive VP & CEO – Encompass Health Corporation Q4 2020 Earnings Call Transcript
“We continue to take on COVID-19 confirmed and suspected patients, with that number more than doubling in the fourth quarter in home health and up 70% in hospice. Since the pandemic began, we’ve treated 26,600 of these patients. Our institutional admissions have also increased sequentially during the same time frame and are approaching pre-COVID level, which is closer to the norm for us.
Home health was up [in spend] by 2% with hospital care, physician and clinical services and nursing home care all down low- to mid-single digits. What this demonstrates is that the pandemic has resulted in a shift in referral patterns, with more patients, families, physicians and discharge planners choosing home health over more costly and potentially higher-risk concrete care settings.”
Keith G. Myers, Co-Founder, CEO & Chairman – LHC Group Q4 2020 Earnings Call Transcript
“The most complex issue facing VITAS over the past 9 months has been the disruptive impact the pandemic has had on traditional hospice referral sources, which, in turn, has impacted our patient census patterns. Fortunately, the portions of the health care continuum have — certain portions have normalized, and hospital referral and admissions have significantly improved from low admission rates experienced early in the pandemic. This is reflected in our second half of 2020 admission and census activity. Our third and fourth quarter 2020 admissions increased 4.7% and 2.8%, respectively. Normally 2 sequential quarters of solid admissions growth would result in an increase in average daily census. However, despite the admissions growth, our average daily census declined 2.8% in the fourth quarter. This decline in census is a direct result of disruption in senior housing, which includes nursing homes and assisted living facilities.”
Kevin J. McNamara, President & Director – Chemed Corporation Q4 2020 Earnings Call Transcript
“…The COVID-accelerated trends of doing more for more in the home, no one is better positioned than Amedisys to take advantage of the share shift into the home. And as we grow our SNF-at-home capabilities, technology innovations and other high acuity programs, we expect to take even more share from other post-acute providers. It’s truly an exciting time to be at Amedisys.”
Paul Berthold – Chairman, President & CEO – Amedisys Q4 2020 Earnings Call Transcript
Dialysis
“Despite the good work in 2020, the challenges of COVID remain… The disproportionate impact COVID has on patients with underlying health issues and the elderly continues to manifest itself in the dialysis community. The higher rates of patient mortality that we talked about last quarter unfortunately accelerated in November and continued through January. We estimate that our patient census at the end of 2020 was approximately 7,000 less than what it would have been otherwise absent COVID.”
Javier J. Rodriguez, CEO & Executive Director – DaVita Inc. Q4 2020 Earnings Call Transcript
“Relative to Q3, we experienced changes in first mortality which has had a compounding effect throughout the year; second, a reduction in expense offsets in the quarter, particularly related to the healthcare costs for our teammates, which have helped to temper the net financial impact of COVID in Q2 and then in Q3; and third, higher direct costs related to COVID, including certain benefits to help our frontline teammates with the hardships of COVID and higher PPE costs.”
Joel Ackerman, CFO & Treasurer – DaVita Inc. Q4 2020 Earnings Call Transcript
Clinical Laboratories
“We expect the base business to improve. That’s a significant margin tailwind versus the prior period because we are — in any given window of time, a highly fixed cost operation on our base business.
[We] expect erosion in our COVID volumes. That creates a headwind and how those 2 pieces offset each other is hard to predict slightly, if you understood me specifically. But I would, at this point, expect that the COVID reduction more than offsets the base.”
Mark J. Guinan, Executive VP & CFO – Quest Diagnostics Q4 2020 Earnings Call Transcript
Payors: Increased Consumer Product Offerings
Payors are poised for the future with increased telehealth services and digital-first solutions available to patients amid the COVID-19 pandemic. UnitedHealth Group noted the increased cost savings and on-demand nature of these services that help meet patient needs during this difficult time.
“As I reflect on what we’ve learned from the pandemic, I am energized by the way the collective health care system responded to the crisis and how actions taken to combat the pandemic strengthened and accelerated critical tenets of the system. As an industry, in partnership with policymakers, we took deliberate and sustained actions to remove financial barriers and enhance access to care in response to the pandemic, easing some of the burden on our nation’s most vulnerable population at a time when they need it most. Supported by CMS, health plans and providers proactively addressed social determinants of health that were exacerbated by the pandemic and quickly pivoted to the telephonic and in-home care, advancing in a matter of months what may have taken years absent the pandemic.”
Bruce Dale Broussard, President, CEO & Director – Humana Inc. Q4 2020 Earnings Call Transcript
“While we estimate and accrue for the incremental revenue from anticipated submissions as the year progresses, there is a higher degree of uncertainty in our revenue projections compared to a normal year. Let me spend a few minutes addressing the drivers of this increased uncertainty. First, while we worked tirelessly throughout 2020 to ensure members had access to and were receiving the appropriate level of care, including by significantly increasing outreach and availability of in-home care and providing access to video telehealth clinician visits, the meaningful drop in non-COVID medical utilization in November and December was not expected. Those are important months as they round out our ability to drive meaningful clinical interactions with our members, and therefore, the unexpected decline in utilization affected our ability to appropriately document their conditions. Second, the mix of utilization was very different in 2020 relative to prior years. For example, the dramatic increase in the number of telehealth visits from 2019 to 2020, although critical in allowing our members to access care while affording us the opportunity to document their conditions, nonetheless, creates greater uncertainty around the type and volume of diagnoses codes collected. Separately, utilization for in-patient and non-in-patient continued to increase for COVID diagnosis throughout the year. Accordingly, within the mix of submissions from 2020 that drive our 2021 revenue, we also expect organic diagnosis code submissions tied to COVID claims, for which we have limited visibility at this time. These are just 2 examples of how emerging experience in 2020 creates more uncertainty in our MRA revenue projections for 2021 because we are not able to place the same level of reliance on historical trends as compared to a normal year.”
Brian Andrew Kane, Chief Financial Officer – Humana Inc. Q4 2020 Earnings Call Transcript
“As a general rule, we have seen an inverse relationship between COVID treatment costs and levels of non-COVID utilization, as surges in the pandemic led to less nonessential care being sought by our members. While the ratio of COVID treatment to non-COVID depressed utilization has varied, to date, we have seen in our Medicare book that the level of depressed utilization has more than offset the treatment cost. The shape of the COVID case curve is one of the largest drivers of these 2 related factors, and as such, they remain the 2 largest sources of uncertainty for 2021, given the unprecedented nature of the pandemic.”
Brian Andrew Kane, Chief Financial Officer – Humana Inc. Q4 2020 Earnings Call Transcript
Future Forecast
As patient volumes returned during Q4 2020 across most sectors, many operators noted a recent COVID-19 surge in December of 2020, with expectations that the vaccination options available will solidify the market’s metrics over time. Both payors and providers indicate an optimistic yet cautious outlook regarding 2021 and have stressed the importance of the vaccine’s distribution. While home health and hospice providers noted a shift in referral patterns, many providers indicated lasting changes toward telehealth and digital options, providing lower cost of care options to patients. Part 2 of this article will include detailed market commentary and outlook on the lingering effects of the Pandemic.
Categories:
Quality Metrics & FMV: By Specialty Considerations
April 13, 2021
Written by Kyle Spears and Jen Johnson, CFA
The value-based care reimbursement environment has emphasized the evaluation of quality by measuring performance with metrics. As a result, hospital executives, management, providers, and legal counsel all share a fundamental question: what are the guidelines to selecting metrics that properly measure the quality of care and are consistent with what is being paid for in the market? VMG Health has seen a growing trend in this question as quality metrics are now found in employment agreements, medical director contracts, co-management arrangements, and other innovative alignment models.
This question has been further highlighted across the industry with the new stark law and anti-kickback statute final rules which were released December 2020 and effective January 2021. Specifically, the rules provide important guidelines and support payments for quality metrics tied to measurable outcomes that are backed by credible medical evidence.
In addition to regulatory commentary addressing paying for quality, it is important to understand how the market is paying for quality to support payments as fair market value. From a valuation perspective, based on analyses of quality payments to physicians in the market from both government and commercial programs, the most valuable metrics (in terms of attaching dollars to the improvement in quality) include the following components:
- The metrics are nationally benchmarked and/or supported by credible medical evidence, rather than internally established and/or created to meet a facility-specific objective.
- The metric performance for maximum payment is representative of superior performance (typically consistent with top decile performance for the industry).
- The metric performance for maximum payment is difficult to achieve compared to historical performance, rather than payment for maintaining historical performance.
- The metrics require high physician impact/involvement, rather than other support staff having a high impact/involvement.
Types of Metrics
In addition, the type of metric is instrumental to determining its value. If you have followed the value-based care movement, you have seen the transition from paying for reporting, to paying for process, and now paying for outcomes. This trend has been led by CMS and from a FMV perspective, supports rewarding more value when outcomes are achieved, such as higher patient satisfaction. However, not all specialties share the same definition for a strong outcome metric. Below you will find some of the more common specialties that reward for quality and the nuances to their respective metrics.
- Surgical Specialties – outcomes-based metrics are most often utilized in surgical specialties in which surgical site infections, readmission rates, and surgical mortality rates can be objectively measured. As a general rule, the clinical procedures and interventions that objectively improve the overall health of a patient are often considered strong metric types for surgical specialties.
- Gastroenterology – minimally invasive procedures such as endoscopies and colonoscopies and chronic care management for conditions such as inflammatory bowel disease are common for gastroenterology care. Therefore, the available metrics are process-based and efficiency-based, which ensure that appropriate screening, appropriate follow-ups, and proper utilization of resources occur according to patient-level factors such as age and medical history.
- Oncology – clinical outcomes improving patient health are difficult to determine and standardize for oncology care due to the variety of cancer conditions and stages. Subsequentially, the vast majority of available metrics observed in the market are related to the clinical process of care and care coordination (such as hospital vs hospice care).
- Primary Care – the nature of primary care emphasizes the importance of preventive care, care coordination, and the overall wellness of patients, and therefore the available metrics are centered around the process of care and often focused on overall cost savings.
- Hospitalists – similar to primary care physicians, hospitalists primarily direct a patient’s experience of care rather than perform acute care procedures. Accordingly, it is difficult to tie back specific clinical outcomes to a hospitalist, so quality metrics available to hospitalists include timely and accurate documentation, processes, and adherence to best practices that ensure the proper care is ultimately provided.
Key Takeaway
It is important to understand the fundamental guidelines and variations by specialty when selecting the metrics included in any type of arrangement with providers to ensure they are consistent with the market. VMG has extensive experience valuing fair market value payments for the achievement of quality metrics across every specialty in addition to offering consulting services that help clients align their metrics and quality programs with the market.
Categories:
Oncology Reimbursement Environment: Recent Changes, Impact and Outlook
March 22, 2021
Written By: David LaMonte, Ayla Anstice, William Teague & Anthony Metke
Understanding the business of cancer treatment in the United States today is predicated on keeping pace with evolving payment models and reimbursement levels promulgated from the Center for Medicare and Medicaid Services (“CMS”) and other government organizations. VMG has identified four areas where CMS has recently announced major updates that may impact oncology providers:
- The Medicare Physician Fee Schedule (“MPFS”) for Calendar Year (“CY 2021”) and the Consolidated Appropriations Act (“CAA”);
- The 340B Program & OPPS Final Rule for CY 2021;
- The Radiation Oncology Alternative Payment Model (“RO-APM”); and
- Medicare Part B Drug Pricing: Most Favored Nation (“MFN”) Model
The MPFS and CY 2021 Final Rule
The CY 2021 Final Rule was initially published in October 2020 and included significant revisions to two key inputs to the MPFS reimbursement formula – the wRVU value assigned to individual CPT codes and the conversion factor applied to calculate reimbursement. Generally speaking, the CPT codes related to office-based visits received increases to the wRVUs, which was offset by a decline in the conversion factor. Originally, the CY 2021 Final Rule was budget neutral in nature, which created winners (specialties with a high volume of office-based visits) and losers (providers with fewer office visits and more business associated with ancillaries). However, on December 21, 2020, Congress postponed the budget neutrality adjustments with the passage of the CAA. The law increased the conversion factor by 3.75% from the Final Rule and delayed the implementation of CPT code G2211 (an add-on code for evaluation & management services) until 2024. Please note, the expectation is that the increase is only temporary, and the conversion factor will revert to the original level defined in the Final Rule.
For cancer providers specifically, the impact was mixed depending on the type of care delivered. The reimbursement impact for medical oncology and radiation oncology providers is detailed below:

Relative to CY 2020 reimbursement levels, medical oncology providers are expected to benefit significantly from the changes included in both the original version of the CY 2021 Final Rule as well as under the revised CY 2021 Final rule established following passage of the CAA. The increased reimbursement is driven by productivity for Medical Oncologists being heavily weighted towards office-based evaluation & management CPT codes. It should be noted, however, that this reimbursement increase only applies to a portion of medical oncologist revenue as drug revenue is not reimbursed under the MPFS.
As the chart above demonstrates, medical oncology reimbursement increases have been slightly mitigated with the passage of the CAA. While this legislation increased the conversion factor, medical oncologists were also expected to benefit from the implementation of CPT code G2211. Due to code implementation now being delayed until 2024, the projected increase is slightly mitigated.
How will these changes impact the medical oncology market in general? Higher reimbursement levels might make private practice more sustainable, which could slow the long-standing trend of physician employment by hospitals. For health systems that compensate their physicians based on wRVU productivity, the changes may result in higher physician compensation levels that are not entirely offset by revenue growth (due to the lower conversion factor). Assuming employment contracts are not renegotiated, hospital financial profits may be reduced (or losses may grow) which could further slow hospital employment trends. Furthermore, additional reimbursement levels could boost interest from investors in the space, driving private equity transactions to create new platforms with consolidation strategies. Based on these dynamics, the Final Rule and CAA considerations could potentially result in moderate increases in valuations within the medical oncology market.
The estimated impact to the radiation oncology market is much less significant than medical oncology. However, if the changes included in the CAA are not permanent radiation therapy centers could experience reductions to revenue and profitability. These financial headwinds may drive consolidation in the industry as weaker providers could choose to partner with stronger participants to mitigate the impact through economies of scale. As previously mentioned, health systems that compensate their radiation oncologists based on wRVUs, could also see a significant impact to operations.
340B Program & OPPS Final Rule for CY 2021
The 340B Program requires drug manufacturers to offer qualified healthcare providers substantial discounts on select outpatient drugs. Through the program, health systems have historically benefited financially from reduced drug costs which are not available to other market participants. As demonstrated by numerous recent policy proposals, the future of the 340B Program is uncertain as policy makers continue to scrutinize its reimbursement model, citing a potential contribution to rising costs, consolidation and the employment of medical oncologists.
Examples of this include the Outpatient Prospective Payment System (“OPPS”) CY 2018 Final Rule from CMS which included a significant cut to reimbursement. Prior to the OPPS CY 2018 Final Rule, CMS reimbursed at 106% of the drug’s average sales price (“ASP”). However, under the 2018 Final Rule, CMS would only reimburse at 77.5% of ASP. The rate reduction was challenged in federal court prior to implementation, and although the court ruled that CMS did not have the authority to change payment rates, the HHS appealed the ruling and continues to reimburse hospitals at the reduced rate. On July 31, 2020, the U.S. Court of Appeals reversed a previous ruling, which claimed CMS did not have authority to change payment rates for the 340B drug discount Program. As a result, the cut to Part B drug reimbursement for 340B hospitals was permitted to continue.
The OPPS Final Rule for CY 2021 included a fourth consecutive year of reimbursement cuts aimed at Medicare Part B drug purchases through the 340B program. The new rule will reduce payments even further by 6.0%, bringing the CMS payment to 340B hospitals down to a rate of 71.3% of the average sales price (“ASP”).
The threat of future continuation of steeper discounts to ASP could have lasting impacts on the medical oncology landscape if profit margins decline among hospital-based physician practices. This could once again slow the trend of physician employment by hospitals, and more physicians could return to private practice. Fewer physicians employed by hospitals could also mean that private equity backed consolidators would have more opportunities to partner with physicians, driving increased activity and investment.
For more information on the 340B programs, see 340B Program & Oncology: What You Need to Know.
The RO-APM
Finalized on September 29, 2020, the RO-APM is similar to a bundled payment and will reimburse providers on a prospective, per case basis for all radiation therapy services provided in a 90-day episode of care regardless of modality utilized. Services covered under the payments would include treatment planning, simulation and treatment delivery which are currently reimbursement under a fee for service model. Originally expected to be implemented in the beginning of 2021, the CAA includes a provision that delayed the start to at least January 1, 2022.
The RO-APM will cover 16 cancer types and include both the professional and technical components. The national base rate for each cancer type was calculated by CMS based on the historical cost to Medicare for cancer episodes. The national base rates are subject to adjustments for case mix, historical experience and geographic location. The proposal also includes additional withholds/discounts to the case rate for quality, incomplete episodes and to lower beneficiary cost-sharing. The RO-APM is site-neutral in nature as reimbursement will not be affected if treatment is delivered by a physician practice, hospital outpatient department (“HOPD”) or freestanding center.
The RO-APM is modality agnostic, so centers that were heavy utilizers of high-cost treatments may be significantly negatively impacted, where centers that utilized lower cost modalities could see a reimbursement increase. Based on these dynamics, VMG Health expects the RO-APM to drive consolidation as centers severely affected may seek to sell or partner with a stronger counterpart as financial returns decline. In addition, as site-of-service differentials are eliminated through the RO-APM, centers currently structured as HOPDs could convert to a freestanding setting. Re-structuring centers to freestanding entities may encourage more joint venture activity between physicians, management companies and health systems.
In addition, VMG Health expects a faster adoption of hypo-fractionation protocols in response to the APM as the number of fractions delivered no longer impacts reimbursement. However, hypo-fractionation would also need to be offset with higher patient throughput to keep machines utilized at historical rates. This dynamic may once again cause lower volume centers to seek partnership or consolidation opportunities with stronger market participants.
For more information on the RO-APM, see Radiation Oncology Alternative Payment Model – Valuation & Transaction Considerations.
Medicare Part B Drug Pricing: Most Favored Nation Model
On November 20, 2020, CMS announced the MFN Model, which proposed significant changes to Medicare reimbursement for Part B drugs. Intended to be implemented on January 1, 2021, the MFN Model has since been delayed due to public commentary and legal challenges. As discussed above, drug reimbursement is a significant source of ancillary revenue for several medical oncologist practices, and the MFN Model could have a material impact on medical oncologist reimbursement if implemented.
Current Reimbursement Model & Concerns
Medicare reimbursement for Part B drugs is currently structured as a cost-plus model, where the cost of the drug is estimated based on the manufacturers’ ASP and providers receive a 6.0% markup before sequestration, resulting in an effective add-on payment of 4.3% after sequestration. The primary concern with the current cost-plus model is the inherent financial incentive to use higher-cost drugs. If a provider can choose between two drugs with similar clinical outcomes, under the current model there is a financial incentive to choose the higher-priced drug resulting in a greater markup.
Proposed Reimbursement Model & Impact
The MFN Model was introduced as a mandatory national model which would be phased-in over four years. Initially the model would only include the top fifty drugs currently reimbursed under Medicare Part B, but this list is expected to expand over time. The MFN Model proposed two key changes to drug reimbursement: 1) Replacement of ASP price with MFN price and 2) a fixed add-on payment.
ASP Replaced With MFN: The MFN Model proposes replacement of ASP with MFN prices with a 4-year phase in period. The MFN price would be based on the lowest price paid by other countries with a GDP that is at least 60% of the United States GDP per capita. Based on CMS estimates, MFN prices are on average approximately 65% below the comparable ASP price: as illustrated below:

Fixed Add-On Payment: The MFN Model proposes replacement of the current percentage markup methodology with a fixed per-dose payment. This fixed per-dose payment will be consistent for all drugs included under the MFN Model, regardless of specialty or price. Based on CMS estimates, this change to a fixed per-dose payment is expected to have a negative impact on medical oncology reimbursement overall. However, this is heavily dependent upon the mix of drugs utilized at an individual practice level, as illustrated below:

Current Status of Model
After announcement of the Most Favored Nation Model, several healthcare groups published concerns with both the MFN Model’s methodologies and its implementation process, including both the Association of Community Cancer Centers and the American Hospital Association Furthermore, the implementation of the MFN Model has encountered several legal challenges resulting in temporary restraining orders and injunctions against the implemental of the MFN Model. As a result, CMS has announced that the MFN Model will not be implemented without further rulemaking.
Despite the delay in implementation, providers should stay current on any developments related to the MFN Model as it could significantly impact financial performance, valuations and future transaction activity. Given the potential reduction in drug reimbursement, VMG expects further consolidation of the market as larger groups may have better leverage in negotiations with manufacturers for drug pricing.
Please see future publications as VMG will explore the potential impact to medical oncology reimbursement, valuations and transaction activity in greater detail.
Conclusion
Each of the above discussed payment model revisions and updates has the potential to impact significant portions of revenue derived for oncology services. Providers, operators and investors should continue to expect these payment models to evolve in the coming years and this could result in wide ranging impact to trends in transactions, affiliations, physician employment and valuations.
ASCs in 2020: A Year in Review
March 3, 2021
Written by Jack Hawkins & Colin Park, CPA/ABV, ASA
2020 was a unique year for the healthcare industry as it experienced a once in a lifetime event. While the healthcare market as a whole was tremendously impacted by the coronavirus (“COVID-19”) pandemic, the Ambulatory Surgery Center (“ASC”) sub-industry was acutely impacted due to interruptions in normal operations caused by the pandemic. Along with a major, multi-site, transaction in the ASC market in 2020, the fragmented ASC industry continued to consolidate. For ASC’s, we have continued to see the continuation of certain trends from 2019 through 2020: the shift of higher acuity procedures from the inpatient setting to the outpatient setting, increased Medicare reimbursement rates, consolidation, and increased activity by hospitals seeking to grow their ambulatory footprint with a particular focus on ASCs.
COVID-19 Pandemic
For a detailed, macroeconomic analysis on the impact of the COVID-19 pandemic on healthcare M&A, please see VMG Health’s Healthcare M&A Report.
In 2020, we saw the outbreak of the coronavirus COVID-19 pandemic impact the entire world. What first and foremost was a global health crisis, the virus quickly resulted in an unprecedented socio-economic crisis as well. First detected in December 2019, the virus has now spread to over 200 countries, and was characterized as a pandemic by the World Health Organization on March 11, 2020.
The pandemic spared very few industries, the least of which being healthcare, requiring an immediate response by health systems and hospitals around the world. Acute care hospitals across the country were strained for capacity. While all surgery centers were impacted, the duration and severity were mixed based upon a number of factors. Overall, a decline in expected ASC procedure volume was observed. Geographic location of the ASC was the prominent factor impacting volume early during the pandemic —depending on infection rates, local government restrictions, and market-specific healthcare capacity, centers had to react differently in different regions. During the first several months of COVID-19, 100% of ASCs stopped elective surgeries, 73% stopped semi-elective surgeries, and 33% stopped non-elective surgeries. This led to different durations of cash flow disruption created by lower volume levels across the board for ASCs, along with increased levels of bad debt, and restructured staffing models.
On March 27, 2020, Congress passed the third COVID-19 Emergency Supplemental package, the Coronavirus Aid, Relief, and Economic Security (CARES) Act, totaling over $2.2 trillion in relief. The stimulus package addressed topics such as healthcare delivery, state funding, small business and non-profit relief, and overall economic stimulus. Further, the US Department of Health & Human Services (HHS) allocated
an additional $20 billion in grants to Medicare providers including ASCs on April 24, 2020. Both relief efforts allowed qualifying ASCs to receive government funding for coronavirus aid.
Once ASC operations could resume, pent up demand for procedures impacted the centers, with generally higher levels of volume observed in Q3 of 2020 compared to prior quarters. While all specialties were impacted by lower levels of volume, we saw centers that were high in Gastroenterology (“GI”), Ophthalmology, and Pediatric Otolaryngology (“ENT”) impacted the most. Generally these procedures were considered more elective, along with a patient population less likely to schedule procedures during and even after peak COVID infection rate periods. Additionally, GI and Ophthalmology have a more elderly population in comparison to other specialties that has resulted in a slower recovery in volume. Lastly, ENT has appeared to have a slower recovery due to the decline in common infections in children and the concern of parents surrounding COVID transmission.
Longer term impacts of the pandemic include potential rescheduling of delayed elective cases, the impact of local and macroeconomic conditions to a recovery of procedure volumes at ASCs and patient payor mix, and centers requiring additional credit facilities, financial restructuring or an outright sale in order to continue operations during depressed revenue generating periods.
Transaction Activity
In 2020, we saw a prominent mega-merger/platform level transaction, as well as a lower number of transactions at the individual-facility level than seen in prior years. Along with the larger platform-level transaction, the fragmented ASC industry has continued to consolidate. It is worth noting that although the industry continues along the trend of consolidation, approximately 72% of ASC facilities remain independent, leaving room for further consolidation at the individual-facility level. M&A activity during the majority of 2020 was largely stifled due to Covid-19.
On December 10, 2020, Tenet Health announced the acquisition of 45 ASCs from SurgCenter Development for $1.1 billion in cash and the assumption of approximately $18 million of center-level debt. The 45 surgical facilities were added to Tenet’s ambulatory business, United Surgical Partners International (“USPI”), bringing the total number of facilities operated by USPI in the US to 310 (inclusive of surgical hospitals). USPI will have up to 60% ownership in the acquired centers, acquiring SurgCenter Developments’ ownership interest and additional interest from physicians in the deal. The transaction was billed by Tenet leadership as transformative, with facility case mix weighted towards musculoskeletal procedures (orthopedics, spine, and pain) that “cements Tenet’s position as preeminent national musculoskeletal services leader across care continuum” as stated in a Tenet Health press release. As a result of the transaction, USPI will enter new markets in Maryland, Indiana, and Ohio, as well as expand the company’s reach in Arizona, Florida, and Texas, where it already owns centers. Tenet expects adjusted EBITDA from its ambulatory business to be approximately 42 percent in 2021, up from 33 percent in 2019 and 25 percent in 2016 of total EBITDA.
“This is a transformative transaction within our stated strategy to expand our ambulatory platform. It will enhance our overall business mix and further diversify our earnings profile by accelerating our shift toward lower cost of care, consumer-friendly, faster-growing assets for Tenet, USPI and our physician and health system partners.”
Ron Rittenmeyer, Executive Chairman & CEO
The ASC marketplace continues to be an active transaction arena as major operators look to consolidate and look for new opportunities in this space. Although the ASC industry has been temporarily impacted by the COVID-19 pandemic, the role of ASCs in their ability to generate consistent, distributable cash flows, and their contribution to lowering the cost of care in the U.S. will allow ASCs to remain attractive targets over a long-term investment horizon. The disruption in M&A activity within the space in 2020 as a result of the pandemic is expected to result in enhanced activity in 2021.
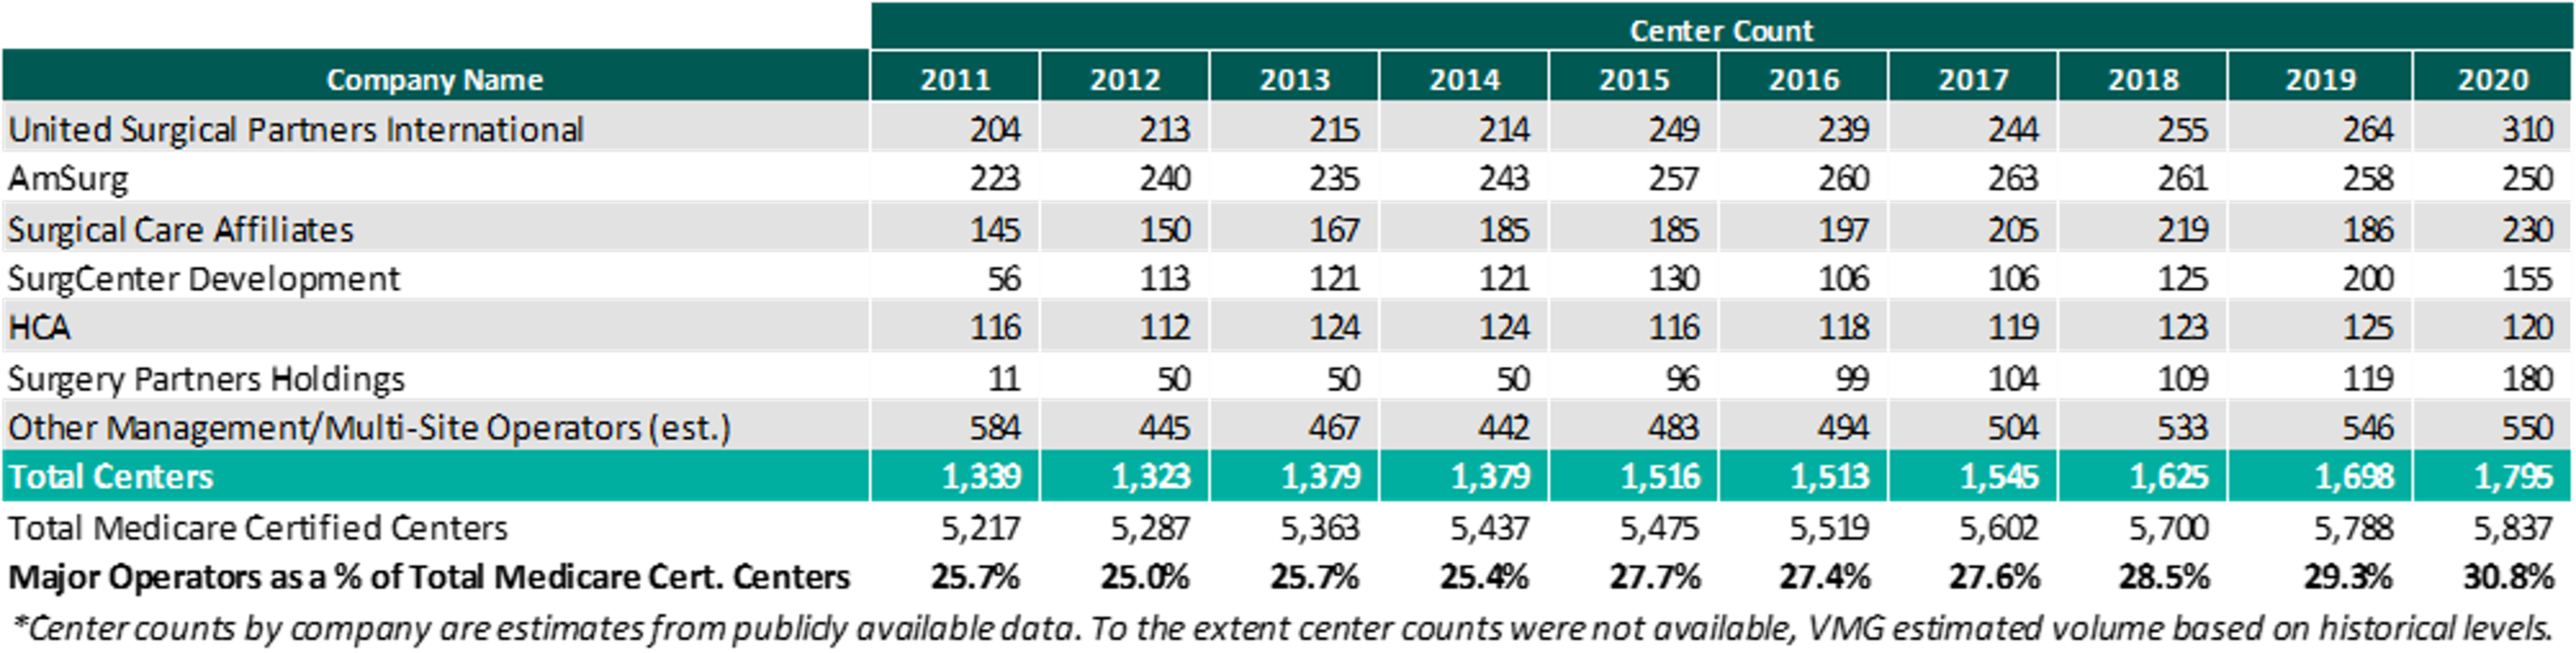
As of December 31, 2020, the largest operators (in terms of number of ASCs) are United Surgical Partners International (“USPI”), Envision Healthcare/Amsurg Corporation, and Surgical Care Affiliates (“SCA”), with ownership of approximately 310, 250, and 230 ASCs, respectively. As noted in the chart below, the number of total centers under partnership by a national operator, as a percentage of total Medicare certified centers, saw an increase from 2019 to 2020 growing from approximately 5,788 centers to 5,837 centers. Additionally the top 5 management companies have increased the number of centers under management by approximately 490 centers since 2011, which represents a compound annual growth rate of 5.1%. As management companies have increased in size, they are able to increasingly provide a greater level of strategic value by bringing greater leverage with commercial payors, enhanced management and reporting capabilities, and improved vendor contracts to acquisition targets.
Reimbursement
On November 1, 2019, the Medicare reimbursement fee schedule for ASCs in 2020 was finalized by the Centers for Medicare & Medicaid Services (“CMS”). For CYs 2019 through 2023, CMS will update the ASC payment system using the hospital market basket update, rather than the Consumer Price Index for All Urban Consumers (“CPI-U”). CMS published the 2020 ASC payment final rule, which resulted in overall expected growth in payments equal to 2.6% in CY 2020. This increase is determined based on a hospital market basket percentage increase of 3.0% less the multifactor productivity (“MFP”) reduction of 0.4% mandated by the ACA. Moreover, the ASC payment final rule for CY 2021 was released by CMS on December 2, 2020, and the rate will increase by 2.4% in CY 2021. This increase is determined based on a hospital market basket percentage increase of 2.4% less the MFP reduction of 0.0% mandated by the ACA. The ASC industry sees the 2020 and 2021 reimbursement increases as a win as CMS continued to follow its proposal to align update factors, moving ASCs to the hospital market basket which historically was used to update HOPD payments. Under the final rule, CMS will use the hospital market basket to update ASC payments through CY 2023.
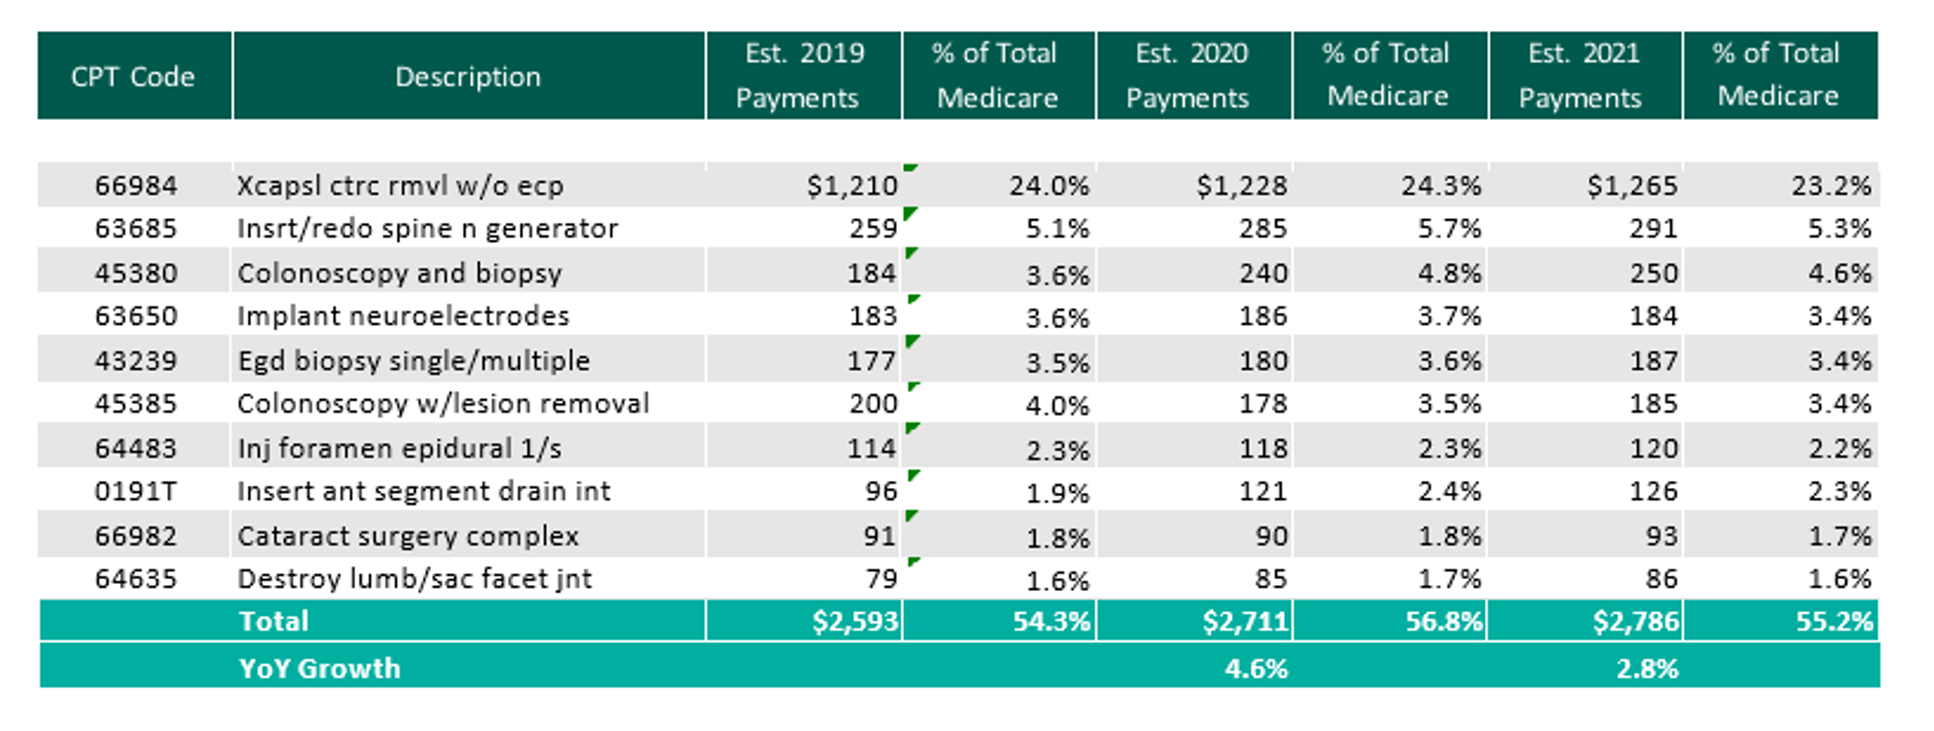
The table below reflects a summary of the estimated Medicare ASC payments for 2019, 2020 and 2021 for the top 10 CPT codes performed in ASCs in 2020. As noted below, the estimated 2021 payments by Medicare for the top 10 CPT codes for 2020 is projected to increase 2.8% through the estimated 2021 payments.
Procedures
On November 1, 2019, CMS released the 2020 OPPS and ASC Payment System final rulings, which finalized the addition of 8 CPT codes to the ASC-Payable List, meaning they are eligible for Medicare payment in the ASC setting in 2020.
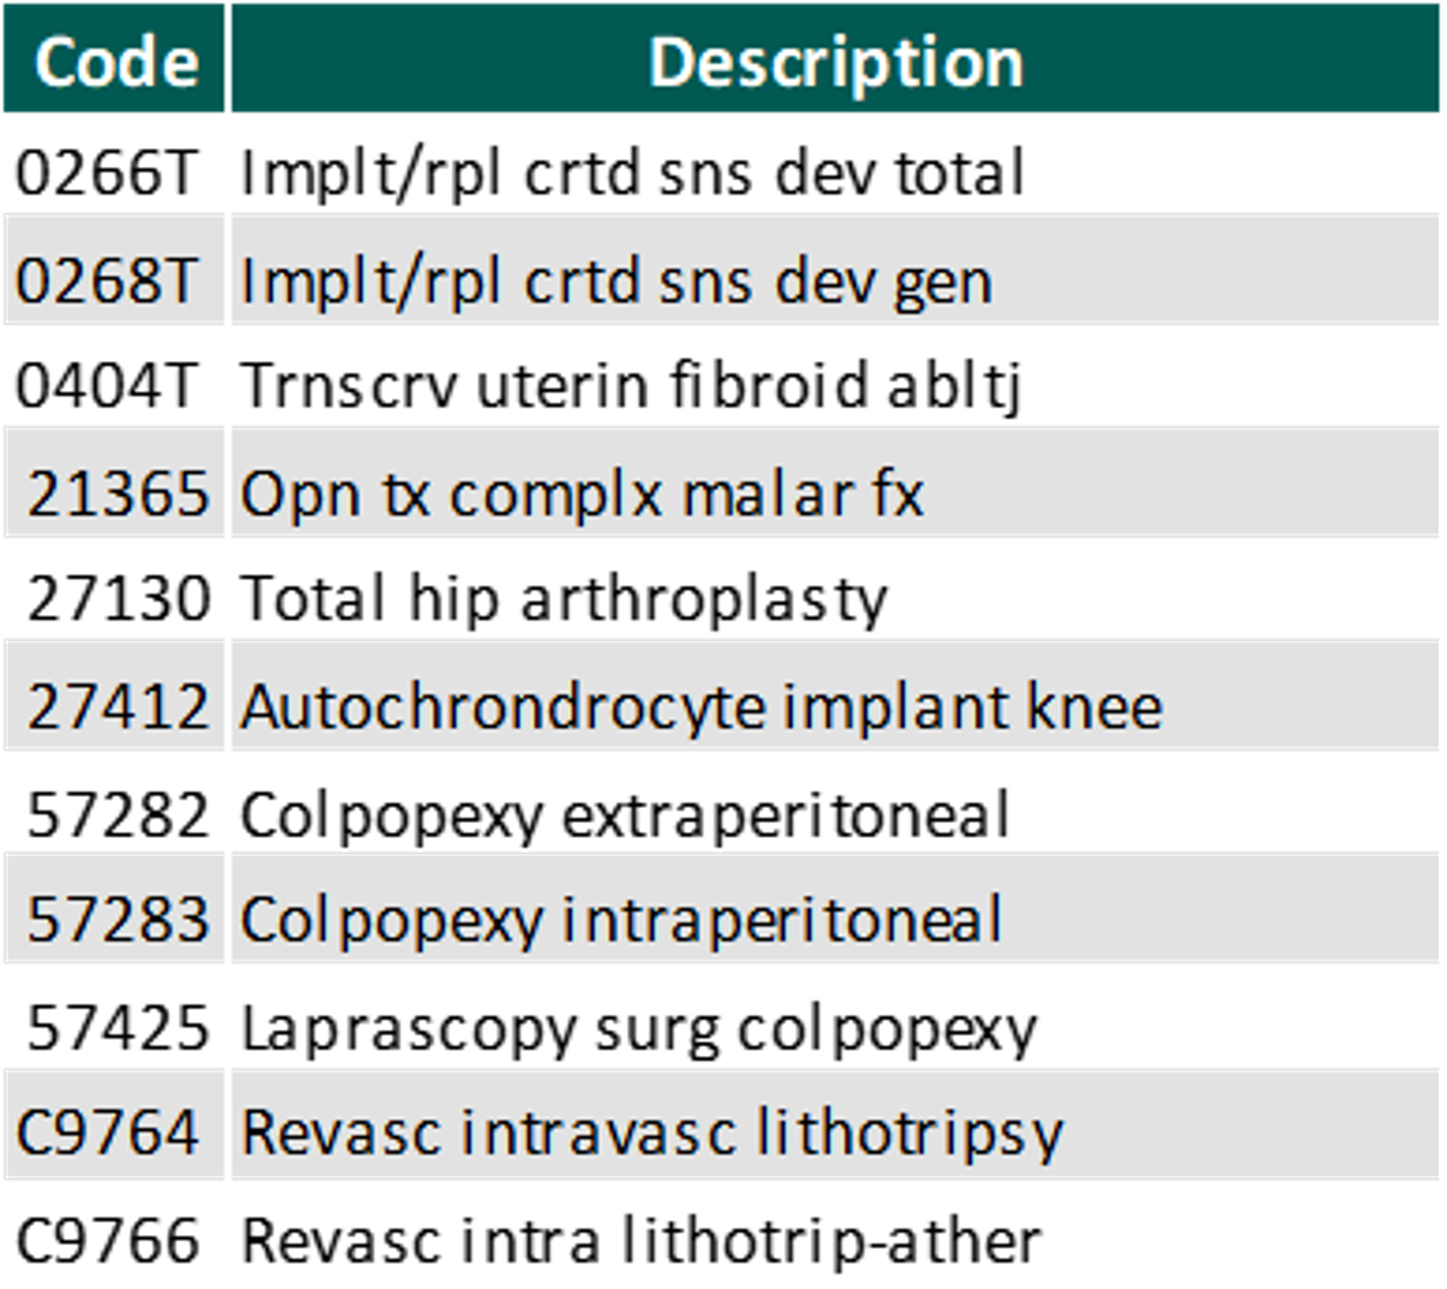
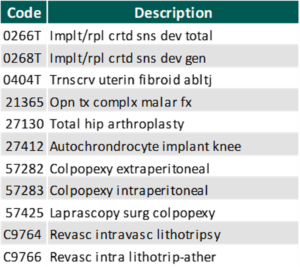
In addition, CMS released on December 2, 2020 the addition of 11 procedures to the ASC covered procedures list (CPL), most notably including total hip arthroplasty (hip replacement surgery). Additionally, CMS revised the criteria used to add covered surgical procedures to the ASC CPL. Under the revised criteria, CMS is adding an additional 267 surgical procedures to the ASC CPL beginning in CY 2021.
With the addition of the new codes and the final ruling for increases to ASC payments by CMS as well as the recovery from Covid-19, it would be expected that total Medicare ASC payments in 2021 would increase compared to 2020. Ultimately, CMS has projected total ASC payments in 2021 to increase approximately $120 million from 2020 payments, to be approximately $5.42 billion. The source of the increase in payments is a combination of enrollment, case-mix, and utilization changes. It should also be noted that CMS reduced the device intensive threshold for ASC procedures to 30% for CY 2019 and subsequent years.
In conclusion, we are continuing to see themes from 2019 play out in 2020 and into 2021. As a whole, the ASC market weathered the COVID-19 storm and was able to recover relatively quickly. The expectation is that there will be further consolidation within the ASC market with the potential for an increase in involvement by private equity companies. At the center level, higher acuity case volume will continue to shift from the inpatient setting further cementing the ASC as the low-cost, efficient alternative to the hospital setting.
Categories:
3 Major Themes from Public Healthcare Firms during COVID-19 – Part 3: Mergers & Acquisitions
January 12, 2021
Contributors: Colin McDermott, Anthony Metke, Spencer Coronado
As the healthcare sector continues to operate affected by the coronavirus (“COVID-19”) pandemic, insights and experiences from the provider sector are particularly interesting.
In this three-part series, VMG Health has summarized key observations regarding the following three major themes from public healthcare firms:
Part 3: COVID-19’s impact on Mergers & Acquisitions
Providers: Experienced Progress and Strategic Opportunities
As indicated, many providers experienced volume declines and had to proactively respond to preserve operational margins during Q3 2020. Despite what some of the public sector has experienced, strategic opportunities have been created for merger & acquisition activity in the healthcare space, with numerous providers indicating large amounts of capital ready for deployment to the market relative to historical norms.
Ambulatory Care
“Going forward, our pipeline remains active with opportunities to strategically add to our network in Q4 and next year. We’re very enthusiastic about continuing our stated strategy to put muscle behind USPI to grow the platform and provide physicians and patients with more convenient options for care and to continue to evaluate our hospital portfolio for fit and make adjustments in that portfolio as we deem appropriate.”
Ronald A. Rittenmeyer, Executive Chairman & CEO – Tenet Healthcare Q3 2020 Earnings Call Transcript
Acute Care
“Our hospitals across the board, in Europe, Australia and here in the U.S. are doing very well. And every one of them, certainly all of the big ones are looking for opportunities and have opportunities to grow.
From an opportunity standpoint with systems, we continue to see a lot of interest in the for profits, buying some of the not-for-profits entities. We see a lot of continued interest, particularly post COVID — post nightmare COVID, I guess, from the not-for-profits that really need to have more than just one facility that are willing to sell at this particular time.”
Edward K. Aldag, Founder, Chairman, President & CEO – Medical Properties Trust, Inc. Q3 2020 Earnings Call Transcript
“Our development activities have continued throughout the year, almost at the same clip as they had pre-COVID. That said, a lot of the deals aren’t closing right now. There’s a lot of conversations. You read a lot of articles about systems all over the country that are struggling. But most or many of them are not at the point where they’re making determinations to change from their current situation to something new.
That said, I do think we’re laying groundwork for the future, near and longer term, where something like that could happen, either within current acute care markets, which we’re most familiar with, or other markets, either markets where we have behavioral presence but not yet acute care or markets that we don’t play in right now, but we track for different reasons, mostly because there’s opportunities there, possible future opportunities. So I do think that, that might happen, but we’re not seeing that happen right at this time.”
Marc D. Miller, President & Director – Universal Health Services Q3 2020 Earnings Call Transcript
Post-Acute Care
“On home health, as Mark [Tarr] mentioned in his comments, we have seen a pickup in the acquisition pipeline. There’s some activity that’s out there right now. It’s more heavily oriented toward hospice than it is home health. But this $50 million to $100 million reflects perhaps the degree of optimism that we’re going to be able to get a deal or two done in the fourth quarter.”
Douglas Coltharp, Executive VP & CFO – Encompass Health Corporation Q3 2020 Earnings Call Transcript
“We have also seen our M&A activity materially increase in recent months. After completing the joint venture with Orlando Health on August 1, we finalized the joint venture with the University Health Care System for home health and hospice in Georgia and South Carolina, a joint venture with Northeast Georgia Health System for home health in Georgia and expanded an existing joint venture with CHRISTUS Health to add a hospice location in Texas. We also completed the acquisition of a hospice provider in Aurora, Colorado that will operate in conjunction with our existing home health location in that market. We believe that this recent activity will continue to gain momentum with increased M&A and continued strong organic growth trends in Q4 and 2021 as we anticipate an historic consolidation opportunity in home health and seeing an increasing number of hospice opportunities in our pipeline.”
Keith G. Myers, Co-Founder, CEO & Chairman – LHC Group Q3 2020 Earnings Call Transcript
“We’re going into our budgeting process for next year. Part of that goes towards us discussing not only our internal metrics, but other markets that we may be very interested in entering, and it gets down to what’s the best entrant strategy, whether that’s de novo or whether that is through an acquisition, but as other providers have alluded to, valuations on those acquisitions in the hospice market given the appetite continue to be at all-time highs. And so we really have to be fiscally responsible around whether those things make sense.”
Nicholas Michael Westfall, CEO & President – Chemed Corporation Q3 2020 Earnings Call Transcript
Imaging
“I think that there’s two facets to answer your question. As far as our competitors are concerned, I think that the impact of COVID will be something that we’ll see more of in 2021 as some of our competitors who have not had the financial resources that we have, as well as potentially the looming cuts in Medicare, force them to consider the viability of their own businesses. So I think the liquidity position that we’re in has put us in a good position to potentially take benefit from that.
The pipeline has always been good here. Generally speaking, we don’t go knocking on doors looking for acquisitions. We want motivated sellers, if you will, or opportunities that come our way. And we expect that those will increase in 2021, particularly if the Medicare reimbursement cuts are implemented. I think it’s just going to make it that much more difficult for the traditional mom-and-pop, I mean smaller operator to be viable. So we will remain disciplined. Part of our growth strategy, since we’ve achieved leverage ratios that we’re very pleased with and hope to even lower. We need to continue to be disciplined about how we do our acquisitions to be certain that the company that does not leverage itself higher than what we believe are comfortable levels.”
Howard G. Berger, Chairman, President, CEO & Treasurer – RadNet Q3 2020 Earnings Call Transcript
Clinical Laboratories
“As a reminder, the 5 elements of our strategy to accelerate our — to grow more than 2% per year through strategically aligned accretive acquisitions; expand relationships with health plans and hospital health systems.”
Stephen H. Rusckowski, Chairman, President & CEO – Quest Diagnostics
“We have a very strong M&A pipeline…. I would prefer to do M&A, because when we do it, we’re highly confident that that’s a better return for our shareholders, but we do have very strict criteria. We have to find deals that meet those criteria. So I’m optimistic that we will deploy a chunk of that for M&A.
Our M&A pipeline remains strong, given the many challenges that hospitals will face we expect many more to be open to discussions about how Quest can help them achieve their last strategy. At the same time, we know that smaller regional laboratories have had their own challenges. This could also produce more opportunity for tuck-in acquisitions. If anything, the pandemic could be in an additional catalyst to help drive immunity consolidation. Some transactions in the pipeline that were paused because of the pandemic are being revisited based on the new realities that this health care system is experiencing at the start.”
Mark J. Guinan, Executive VP & CFO – Quest Diagnostics
Payors: Physician Group Focus
With the ongoing nature of the COVID-19 pandemic, payors are poised to make strategic acquisitions and purchases in specific geographic with size-related metrics in mind. UnitedHealth Group (through OptumHealth) foresees acquisitions of all sized physician groups based upon alignment with their strengths:
“The other piece I’d say […], around your question about physician recruitment is we have seen continued robust interest in both small, tuck-in acquisitions as well as medium and large physician groups who are attracted to both stability, the physician leadership and the evidence-based approach that we’ve embraced in OptumCare.”
Wyatt W. Decker, Chief Executive Officer – OptumHealth (UnitedHealth Group) Q3 2020 Earnings Call Transcript
Watch the Market for Activity
As operations improved throughout Q3 across most sectors, many operators are looking towards opportunistic acquisitions into 2021. Both payors and providers indicate an optimistic outlook given adequate capital, but have stressed the importance of selective acquisitions that align with long-term goals. While acute care provider Tenet is shifting capital deployment focus towards their ambulatory care division, USPI, post-acute care providers including Encompass Health and Chemed Corporation indicate the hospice market as the most active at the moment, as evidenced by LHC Group’s Q3 2020 activity across the country.
Categories:
3 Major Themes from Public Healthcare Firms during the Third Quarter of 2020 – Part 2: Expense Management and Cost Savings
January 5, 2021
Contributors: Madison Whyde, Alex Malin, Chris Madden
Among the companies covered for Q3 2020, there was a continued emphasis on expense management and cost savings strategies. As mentioned in Part 1, COVID-19 restrictions began to ease up in many markets with patient volume reapproaching normalized levels. While many companies are still experiencing increased costs related to PPE, COVID-19 testing, and COVID-related operational inefficiencies, a majority of the companies praised their management teams’ ability to tightly manage and control variable costs. As a result, a significant amount of the incremental revenue attributable to volume and reimbursement tailwinds in Q3 was dropped to the bottom line.
The following earnings call excerpts provide additional detail from executive and operational management:
Imaging
“I think coming out of this year, we have created a lot of operational efficiencies, both from the staffing standpoint and the number of facilities that we need to operate. And I believe the combination of those will create some improvement in our performance, which we mentioned. And I think perhaps the best way to look at this brand would be that the margin expansion that we saw in the third quarter is what we’re going to focus on to try to replicate in forward-going quarters. So — of course, that’s subject to perhaps some of the cuts in the Medicare reimbursement should they go through, which would hurt those margins a little bit. But I think the additional cost savings that have not been fully implemented that we anticipate in 2021 will help mitigate that along with sustaining what I think is better workflows and efficiencies in our staffing.”
Howard G. Berger, Chairman, President, CEO & Treasurer, RadNet Q3 2020 Earnings Call Transcript
Behavioral Health
“We are realizing measurable improvement in our cost management efforts and operating efficiencies that we’ve implemented in 2019 and 2020. We continue to proactively manage staffing and other costs.”
David M. Duckworth, Chief Financial Officer Acadia Healthcare Company, Inc. Q3 2020 Earnings Call Transcript
Post-Acute Care
“Within home health, our continued focus on labor productivity combined with compensation structure changes implemented earlier this year drove a 270-basis point reduction in cost of services for Q3. Visits per episode declines from 17.3 in Q3 2019 to 16.4 in Q3 2020 and cost per visit declined to $75 from $78 in the prior year period. This effective cost management led to segment adjusted EBITDA in Q3 of $51.8 million, an increase of 2% over Q3 2019.”
Douglas E. Coltharp, Executive VP & CFO, Encompass Health Corporation Q3 2020 Earnings Call Transcript
“We continue to make great progress in deploying PDGM cost levers. In the third quarter, we achieved an LPN RN ratio of 46.7%, up from 40.6% in Q3 ’19 and a PTA PT ratio of 49.6%, up from 43.7% in Q3 ’19. As you can see, we are well on our way to our ratio goal of 50-50 by the end of this year which has — will continue to provide significant positive impact to margin and will improve our care as well.”
Scott G. Ginn, CFO, Chemed Corporation Q3 2020 Earnings Call Transcript
Hospitals
“Our teams continue to do an excellent job managing our cost structure during these pandemic cycles, which benefited our performance in the quarter. And our labor, supply and other operating costs as a percent of revenue all showed improvement as compared to the prior year period.”
William B. Rutherford, Executive VP & CFO, HCA Healthcare, Inc. Q3 2020 Earnings Call Transcript
“With respect to managing operating costs, which has been a key part of our solid results this year, we have continued confidence in our team’s ability to hold many of the gains they have made across the different expense categories. In those areas where we anticipate some pressure, we believe we have future resiliency actions that can help offset some of these challenges.”
Samuel N. Hazen, CEO & Director, HCA Healthcare, Inc. Q3 2020 Earnings Call Transcript
“Our continued tight control of costs mitigated the impact of incremental expenses from the pandemic, including higher temporary labor, premium pay and PPE costs.”
“… Before the pandemic occurred, that we have been focused on, over the past several years, realizing about $450 million of cost efficiencies since we started this back in 2018. And we’re fully on track for that for this year. And what we — as we talked about last quarter, too, as a result of the pandemic, we’ve dug deeper, we’ve identified more efficiencies that we’ve been realizing or realize into the future. And it’s really across all the cost elements of our cost
structure, whether it’s labor management supplies or other operating expenses.”
Daniel J. Cancelmi, CFO & Executive VP, Tenet Healthcare Corporation Q3 2020 Earnings Call Transcript
“On the expense side, we managed variable costs down during the second quarter as volumes were negatively impacted by restrictions on elective procedures and shelter-in-place orders. As volumes and net revenue returned in the third quarter, our hospital leadership teams managed variable costs very well. This combined with savings from our strategic margin improvement program drove improved EBITDA and EBITDA margin performance during the third quarter. Overall, we were pleased with our third quarter performance, and I’m excited about the strategic progress we have made during the year. While the management of COVID-19 has certainly garnered much of our attention and focus, we have also continued to effectively execute our strategic plans”
“In terms of contract labor trends, I think we did a good job of limiting contract labor, obviously, in the latter part of the first quarter and in the second quarter when our inpatient volumes were suppressed. So, we actually had a pretty significant decrease in contract labor utilization. We have seen the need for contract labor to go back up over the last several weeks, in particular, as we’ve had COVID cases surge … And in terms of the rate, we have seen some increase in rates in the contract labor space. Working very hard with all the other margin improvement initiatives to offset those, of course. But it is somewhat of an emerging headwind that we’ll be mindful of.”
Tim L. Hingtgen, President, COO & Director, Community Health Systems, Inc. Q3 2020 Earnings Call Transcript
“As we have managed through with lower volume, we have certainly done, I think, an exceptional job of managing our labor costs. So we’ve been able to flex labor consistent and according to the lower volume. The margin improvement program work that we really started late in 2019, a lot of those initiatives are focused on non-patient facing expenses. They deal with how we contract purchase services, how we’re contracting for supplies. And we believe those to be very sticky, so to speak. So we believe those expense reductions will continue going forward as volumes come back. And so that margin lift will be more permanent.”
Wayne T. Smith, Chairman & CEO, Community Health Systems, Inc. Q3 2020 Earnings Call Transcript
Executing Expense Management and Delivering Margin Expansion
Interestingly, a majority of the public companies reviewed reported year-over year increases in EBITDA margins (i.e. Q3 2020 vs. Q3 2019). Although there was a surge in volume levels during Q3 2020, as noted in Part 1, the healthcare system has not completely returned to normalcy as volume remains slightly depressed compared to historical levels. Therefore, it is reasonable to assume that companies are benefitting from expense management strategies implemented throughout the year. Some of these strategies include, but are not limited to, identifying staffing inefficiencies, lean staff management, more prudence as it relates to third-party service and lease agreements, and refining contract labor usage. As a result, the continued focus on expense management is expected to drive greater financial and operational efficiency with volume increases. Based on the Q3 earnings calls, executive management appears to indicate that the COVID-19 pandemic is becoming more manageable from both a financial and operational perspective.
Categories:
Spotlight on Life Sciences – Healthcare Real Estate
December 9, 2020
Written by Grace McWatters, Victor McConnell, MAI, ASA, CRE, Larry Snyder, MAI
Largely driven by growth in the biotechnology research and development segment, real estate associated with the life sciences, which utilizes a combination of office, flex, and lab space, has emerged as a highly favored asset. Accounting for approximately 100 million square feet of product[1], these facilities are primarily concentrated in approximately a dozen markets throughout the United States.
In 2020, the life sciences sector has continued to grow, demonstrating its resilience despite the COVID-19 pandemic. While the industry’s resistance to economic downturns is not new, increased global attention has been spurred, in part, by the international effort to develop a vaccine for COVID-19. Billions of government dollars have been directed to the sector via Operation Warp Speed (OWS)[2] in order to accelerate the development and distribution of a vaccine. Increased government funding combined with the continued flow of capital via NIH research grants and venture capital investment serves to illustrate the industry’s current growth climate.
This article will outline overall trends within the life sciences sector, with a particular focus on the real estate market. Furthermore, we will identify the primary and emerging hubs within the United States, document a decade’s worth of expansion in terms of employment and funding, outline key players in the industry, identify trends resulting from the outbreak of COVID-19, and illustrate the sector’s market fundamentals in terms of supply and demand, rents and vacancy, and cap rates and pricing.
Demographics and Trends
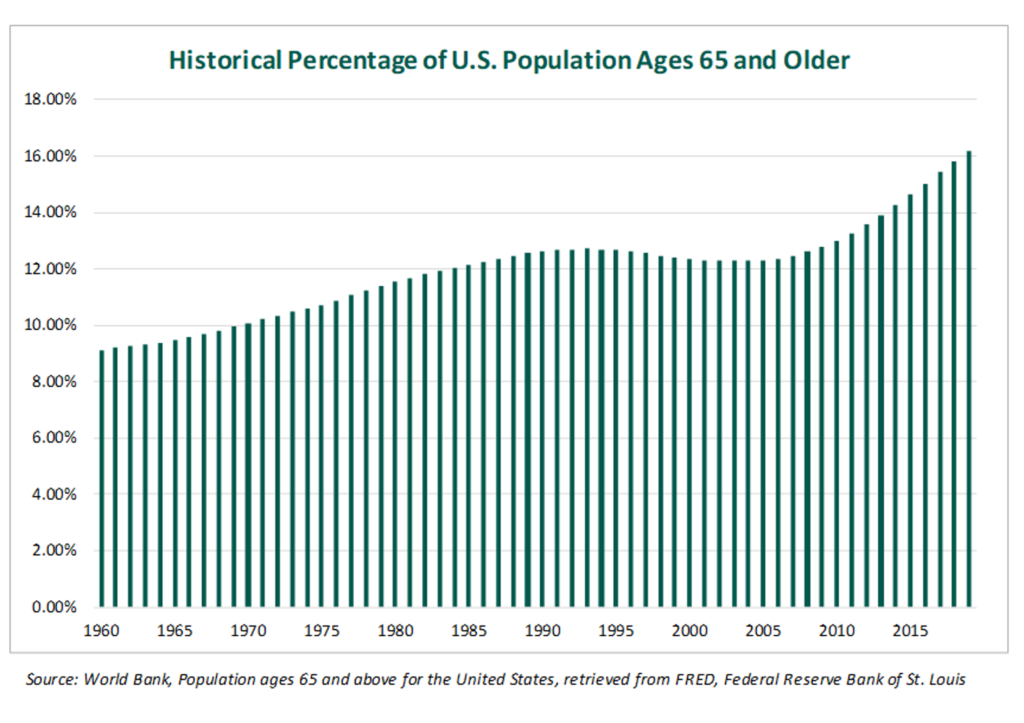
The sector has continued to expand as technological innovation affords more medical breakthroughs to an aging population. According to the U.S. Census Bureau, in 2005, the median age in the U.S. was 36.2 years.[3] In 2018, the median age was 38.2 years[4]. The median age in 2030 is projected to be over 40 years.[5] Moreover, by 2030, the number of people 65 and older is projected to surpass 73 million, or about 21% of the population.[6] Overall, the American population is, on average, growing older, and life spans continue to increase. Like most healthcare verticals, the life sciences sector is expected to benefit from the current demographic trends in the United States.
The following graph[7] shows the historical percentage of the U.S. population ages 65 years and older as of 2019.
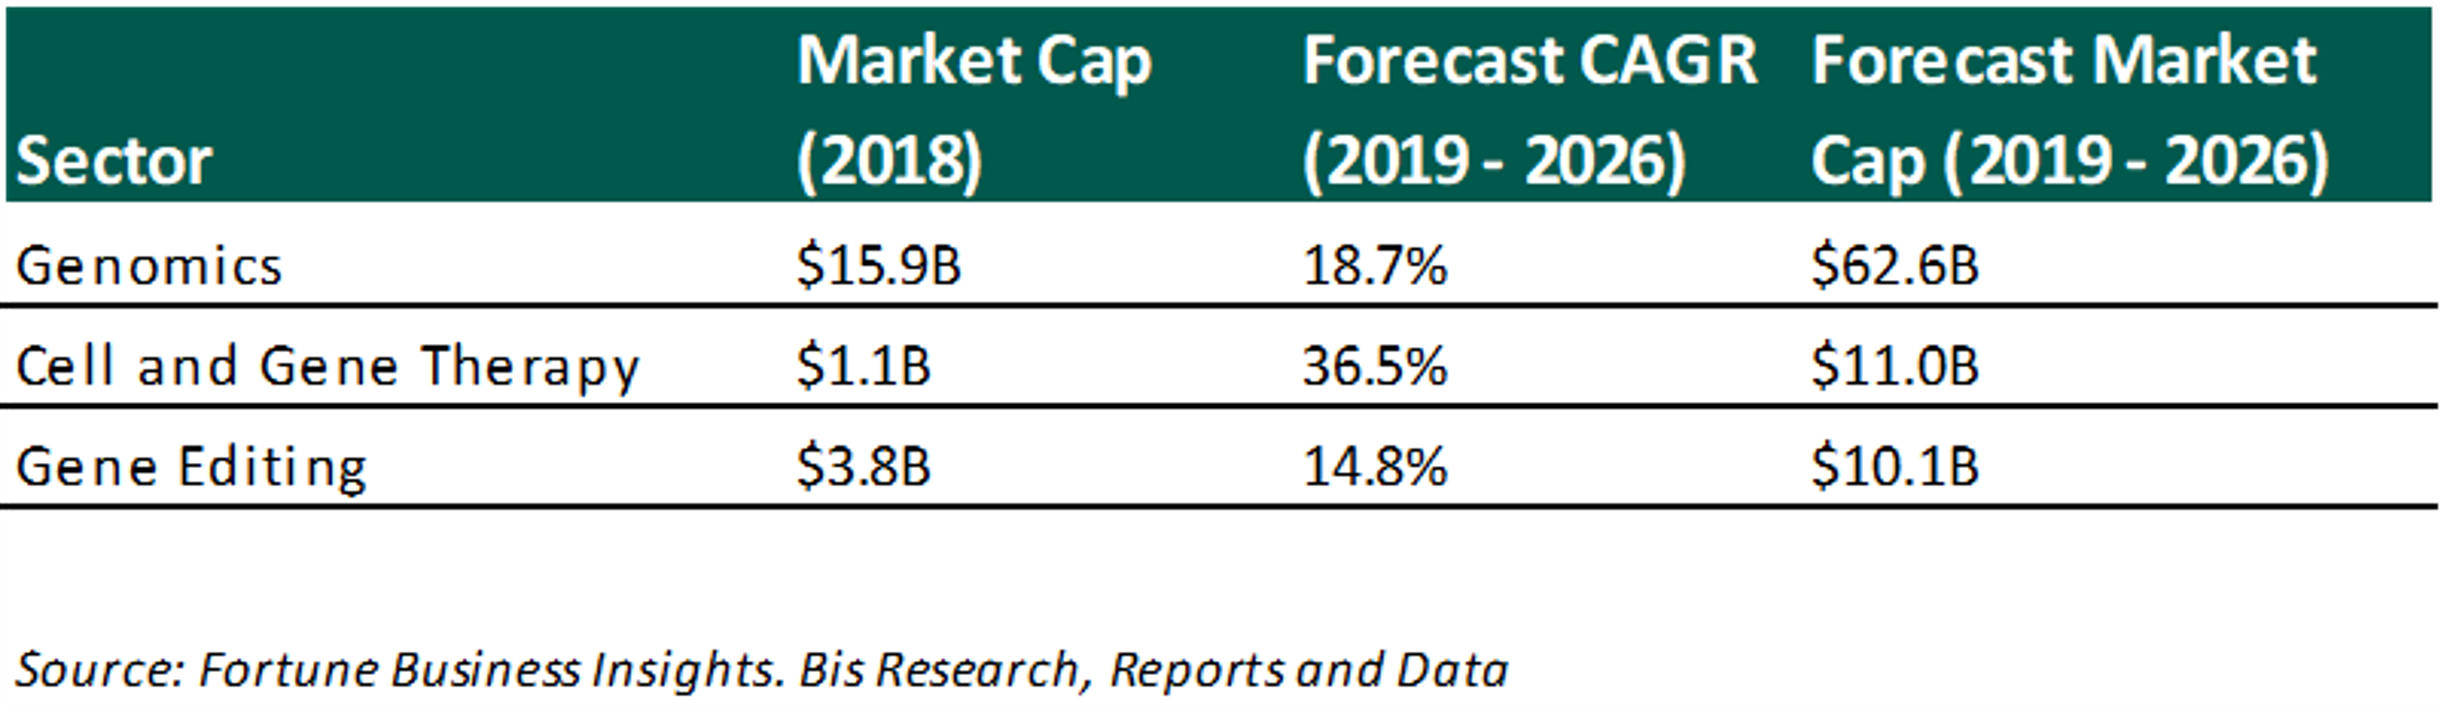
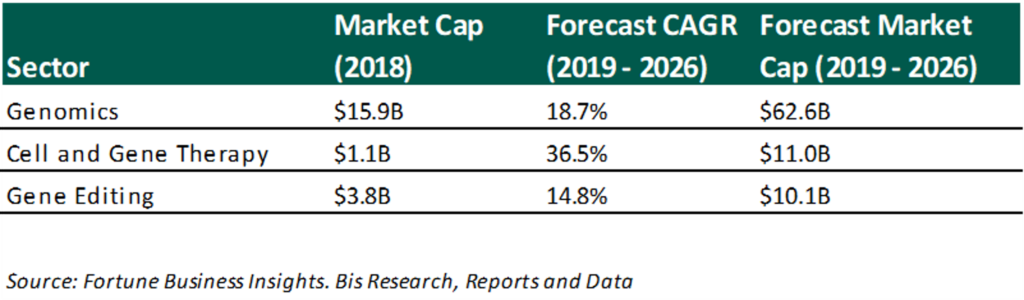
With more consumers on the horizon and technological advancements lowering both costs and failure rates, the life sciences sector expects robust growth in the next decade. Several subsectors, shown below, have compounded annual growth rates projected to exceed 10%[8]. The subsectors with the most growth are related to identifying and potentially modifying DNA in order to reduce risk of disease in humans, animals, and agriculture.
Primary and Emerging Hubs
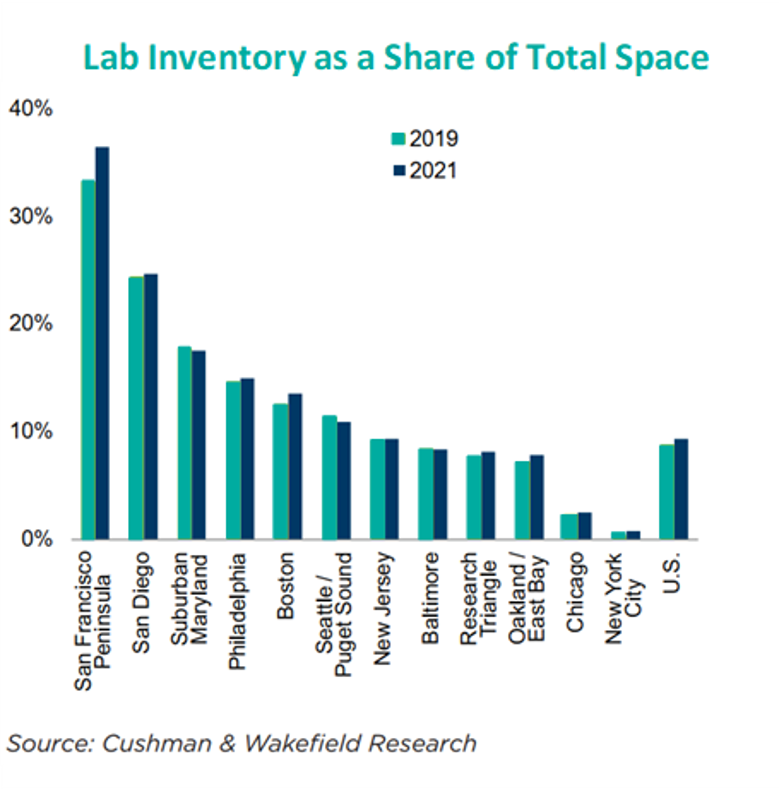
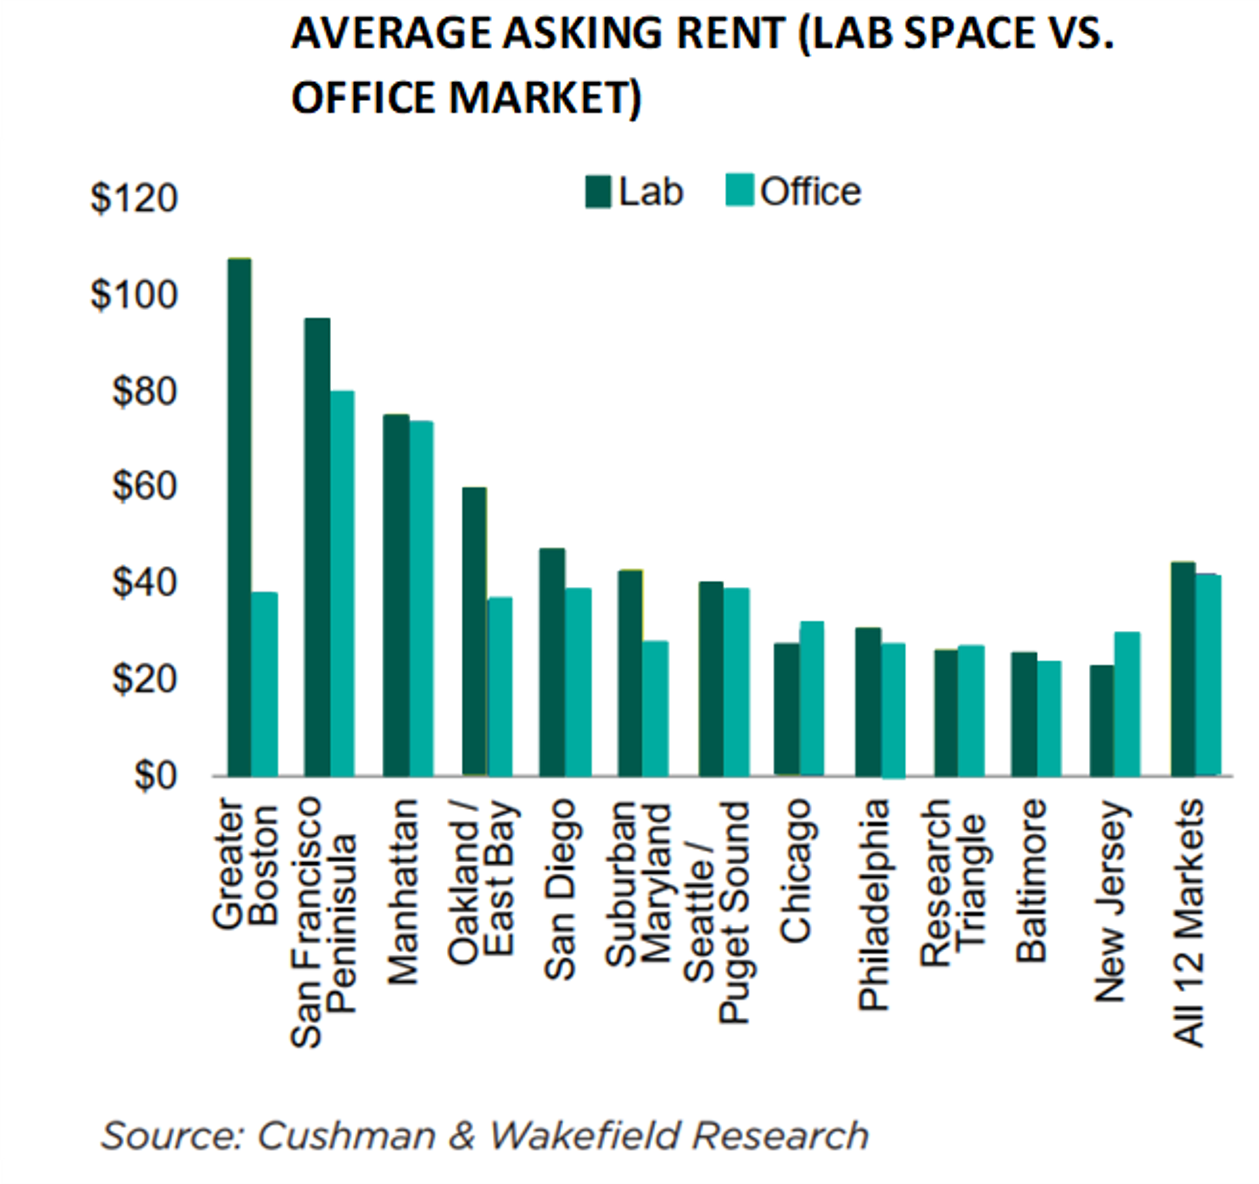
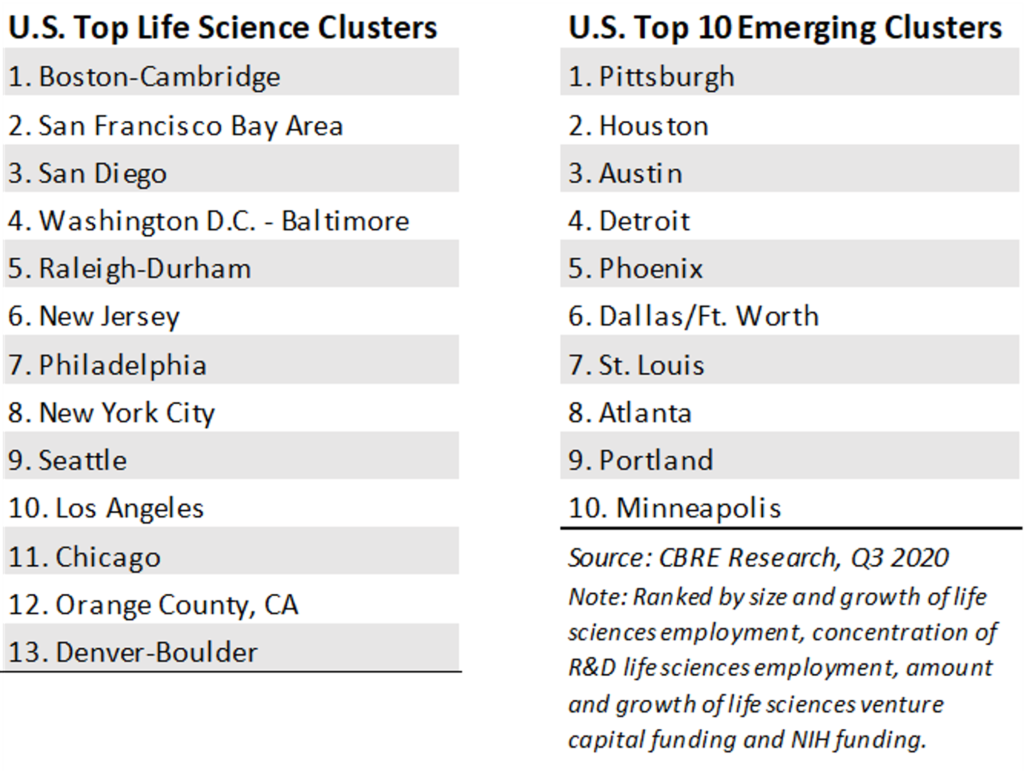
As the influence of life sciences grows, more cities are catering to the industry’s needs. Life sciences are concentrated in over a dozen markets in the United States. Facilities are strategically located within these markets to follow talent and access outside funding. It is easier to acquire funding in a primary market because, if a facility “goes dark,” an investor/landlord will need to re-lease the space or sell to a new owner/user, which could take a considerable time and considerable investment in tenant improvements; a location in a primary market improves a landlord’s ability to re-tenant. Proximity to other life science tenants, access to funding, and a strong talent pool decreases the lease-up time for abandoned facilities, partially mitigating risk associated with a highly specialized build out. Cities or metros where these facilities are concentrated are referred to as “clusters.” Boston-Cambridge, the San Francisco Bay area, and San Diego are the three largest clusters for life sciences within the United States. The following chart identifies the top and emerging life science clusters in the country.[9]
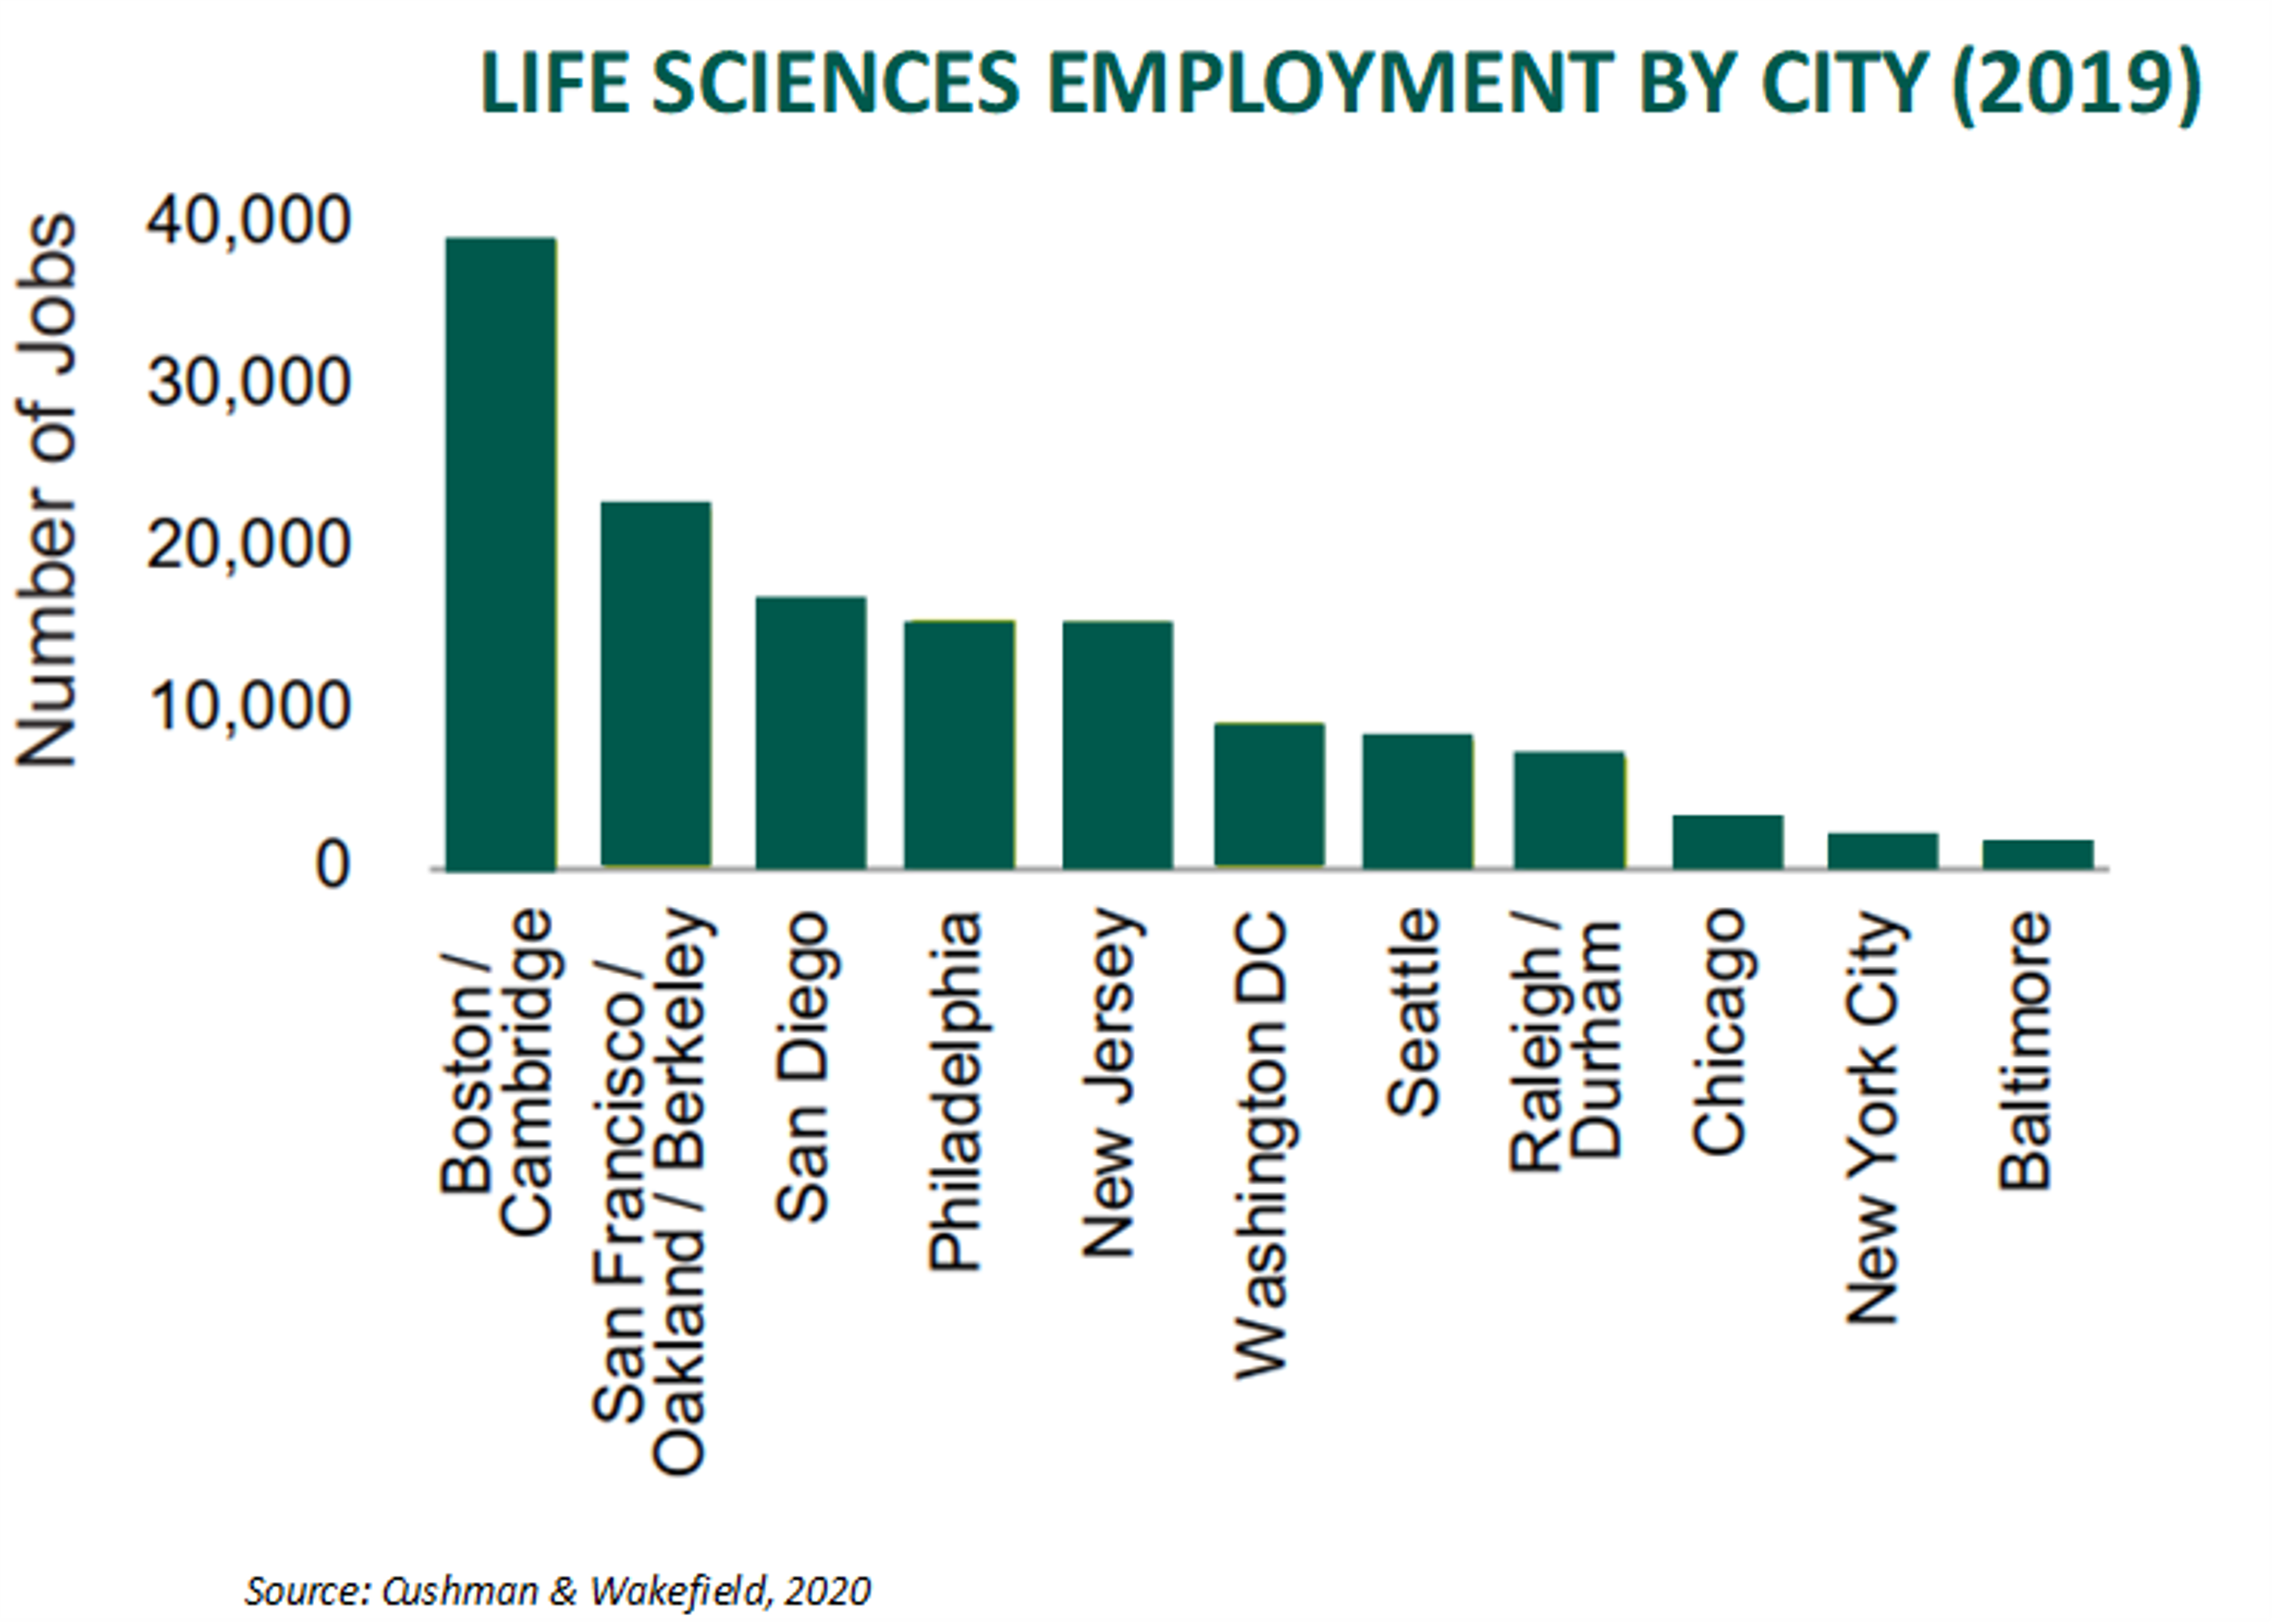
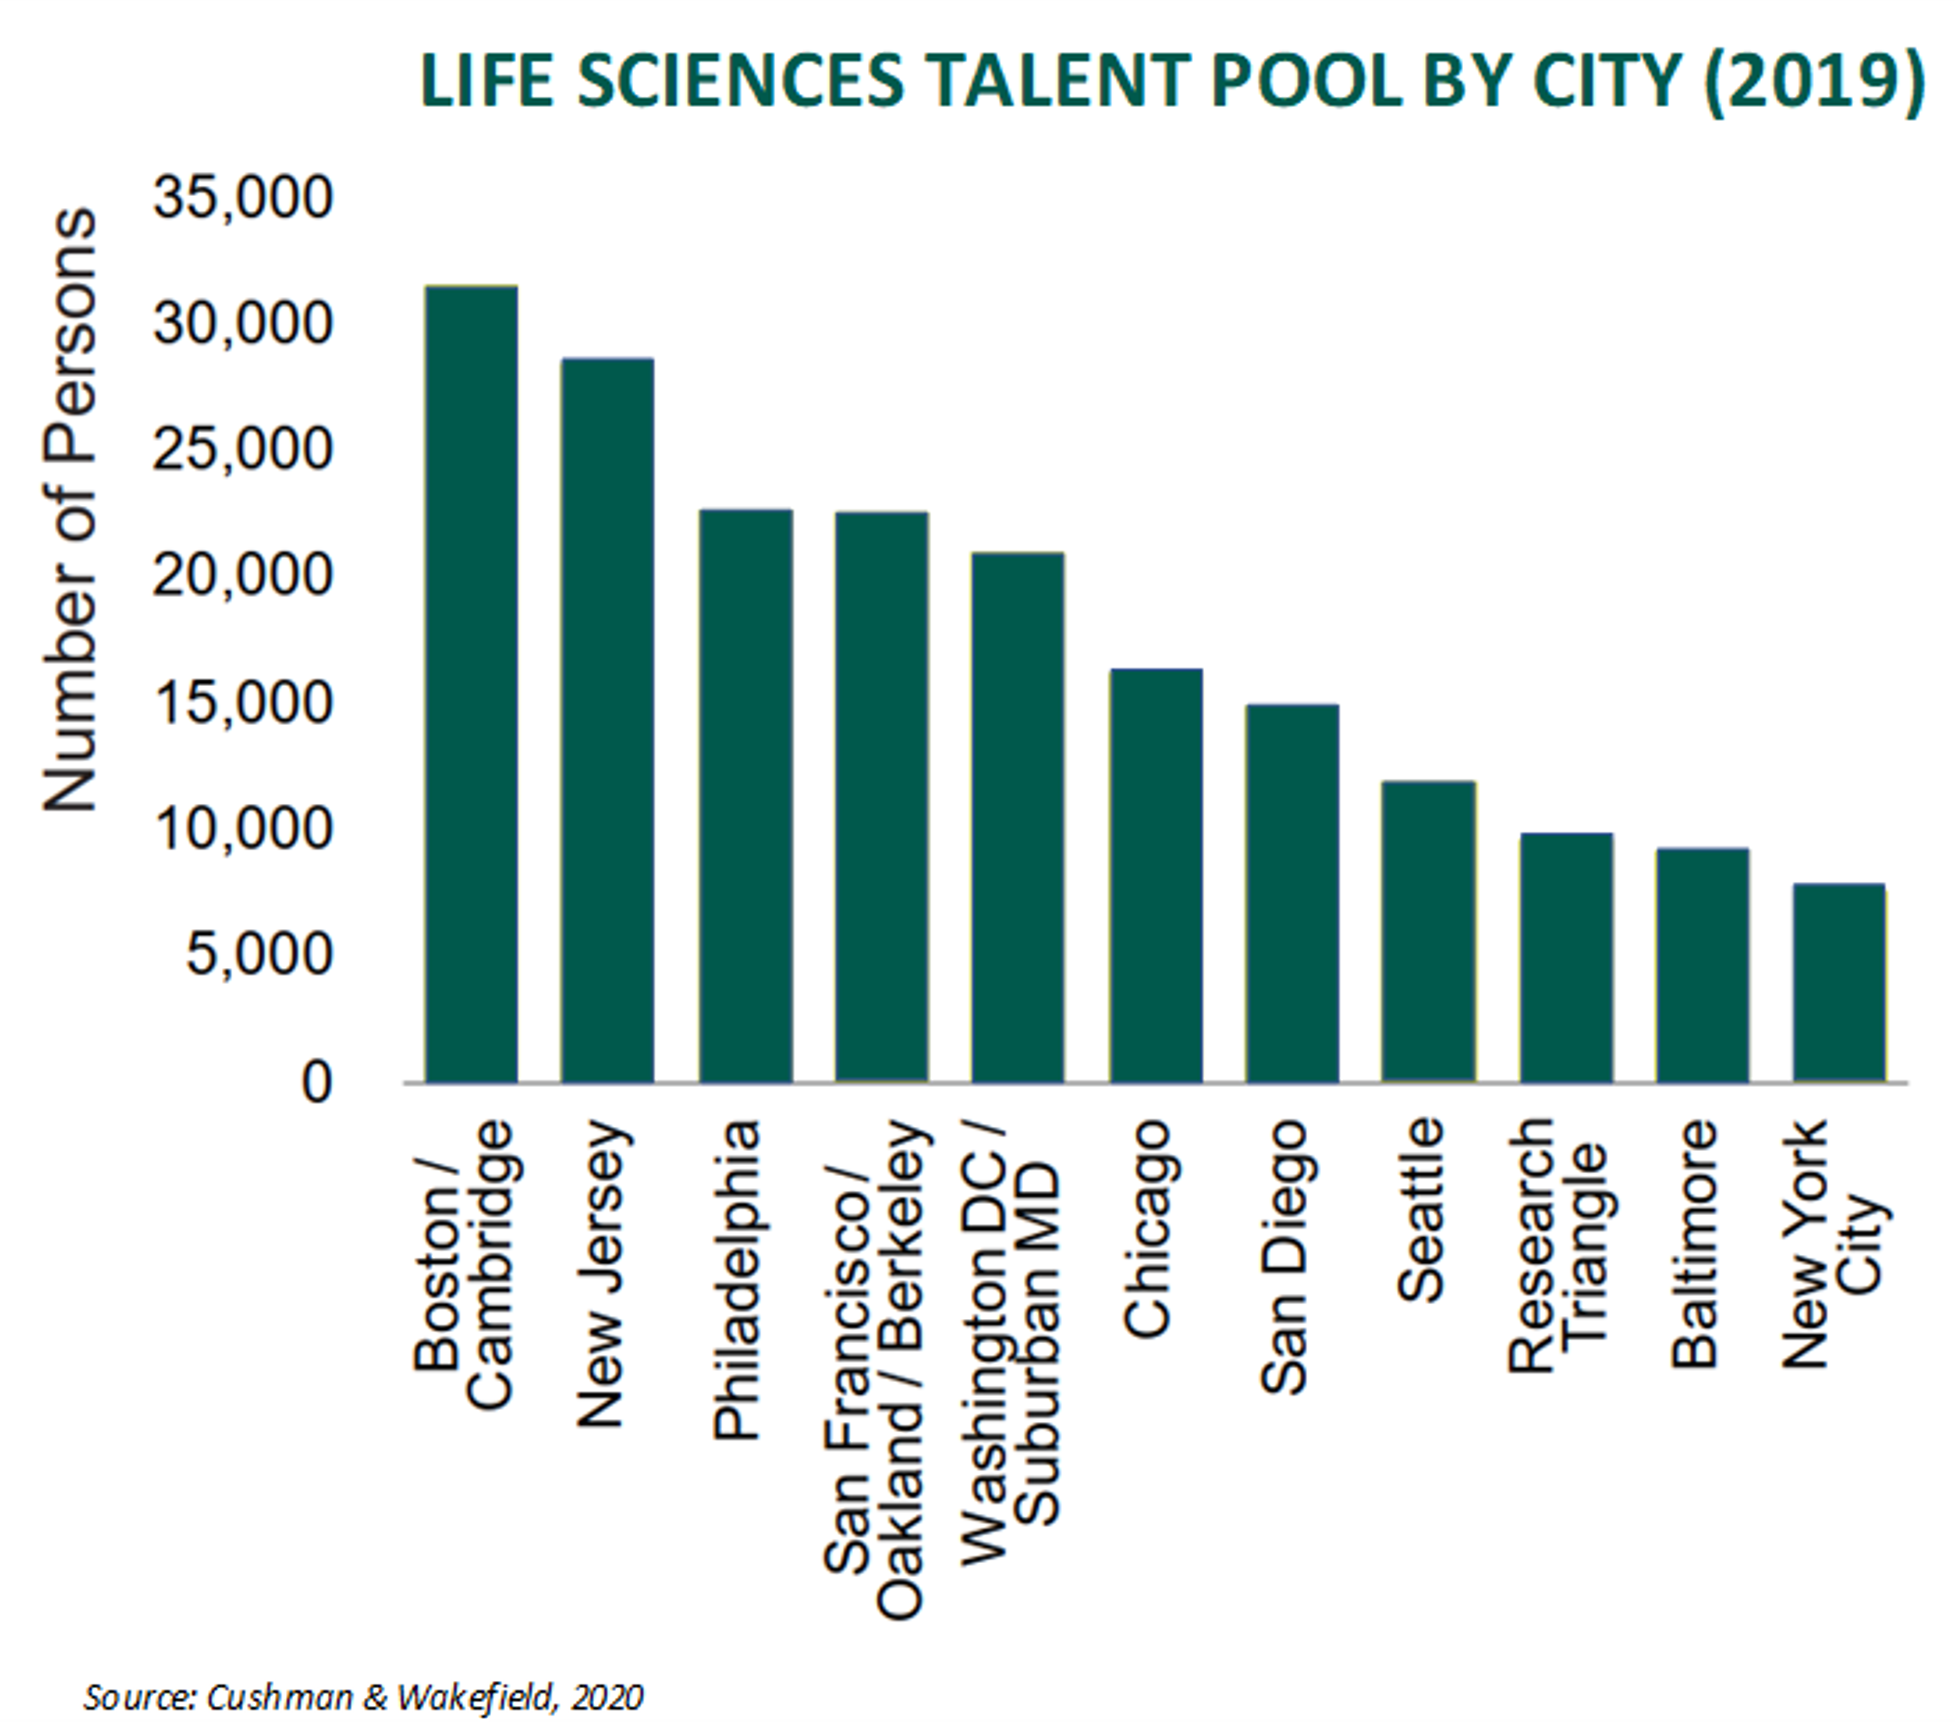
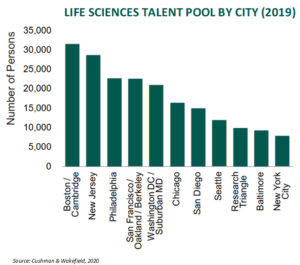
Employment in life sciences totaled 204,800 in 2019. 67% of these jobs were located within eleven clusters, shown as follows.[10]
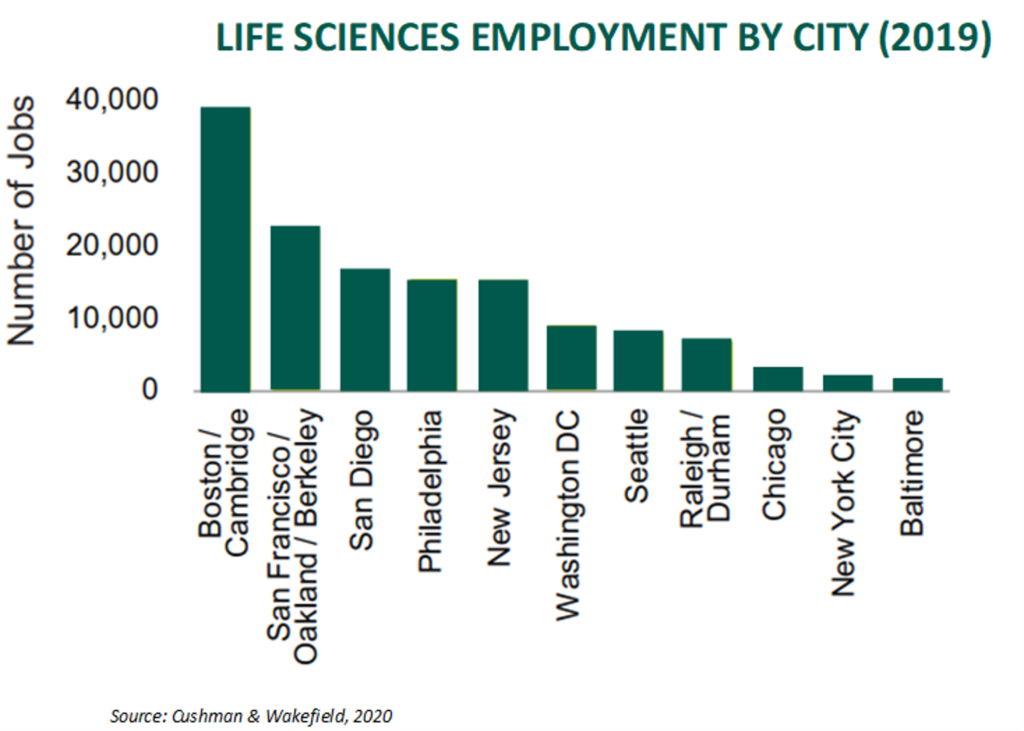

San Francisco Bay area, Boston-Cambridge, and San Diego have the most employees and highest square footage of life sciences real estate in the United States.[11]

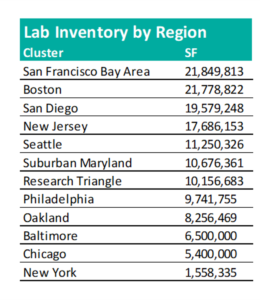
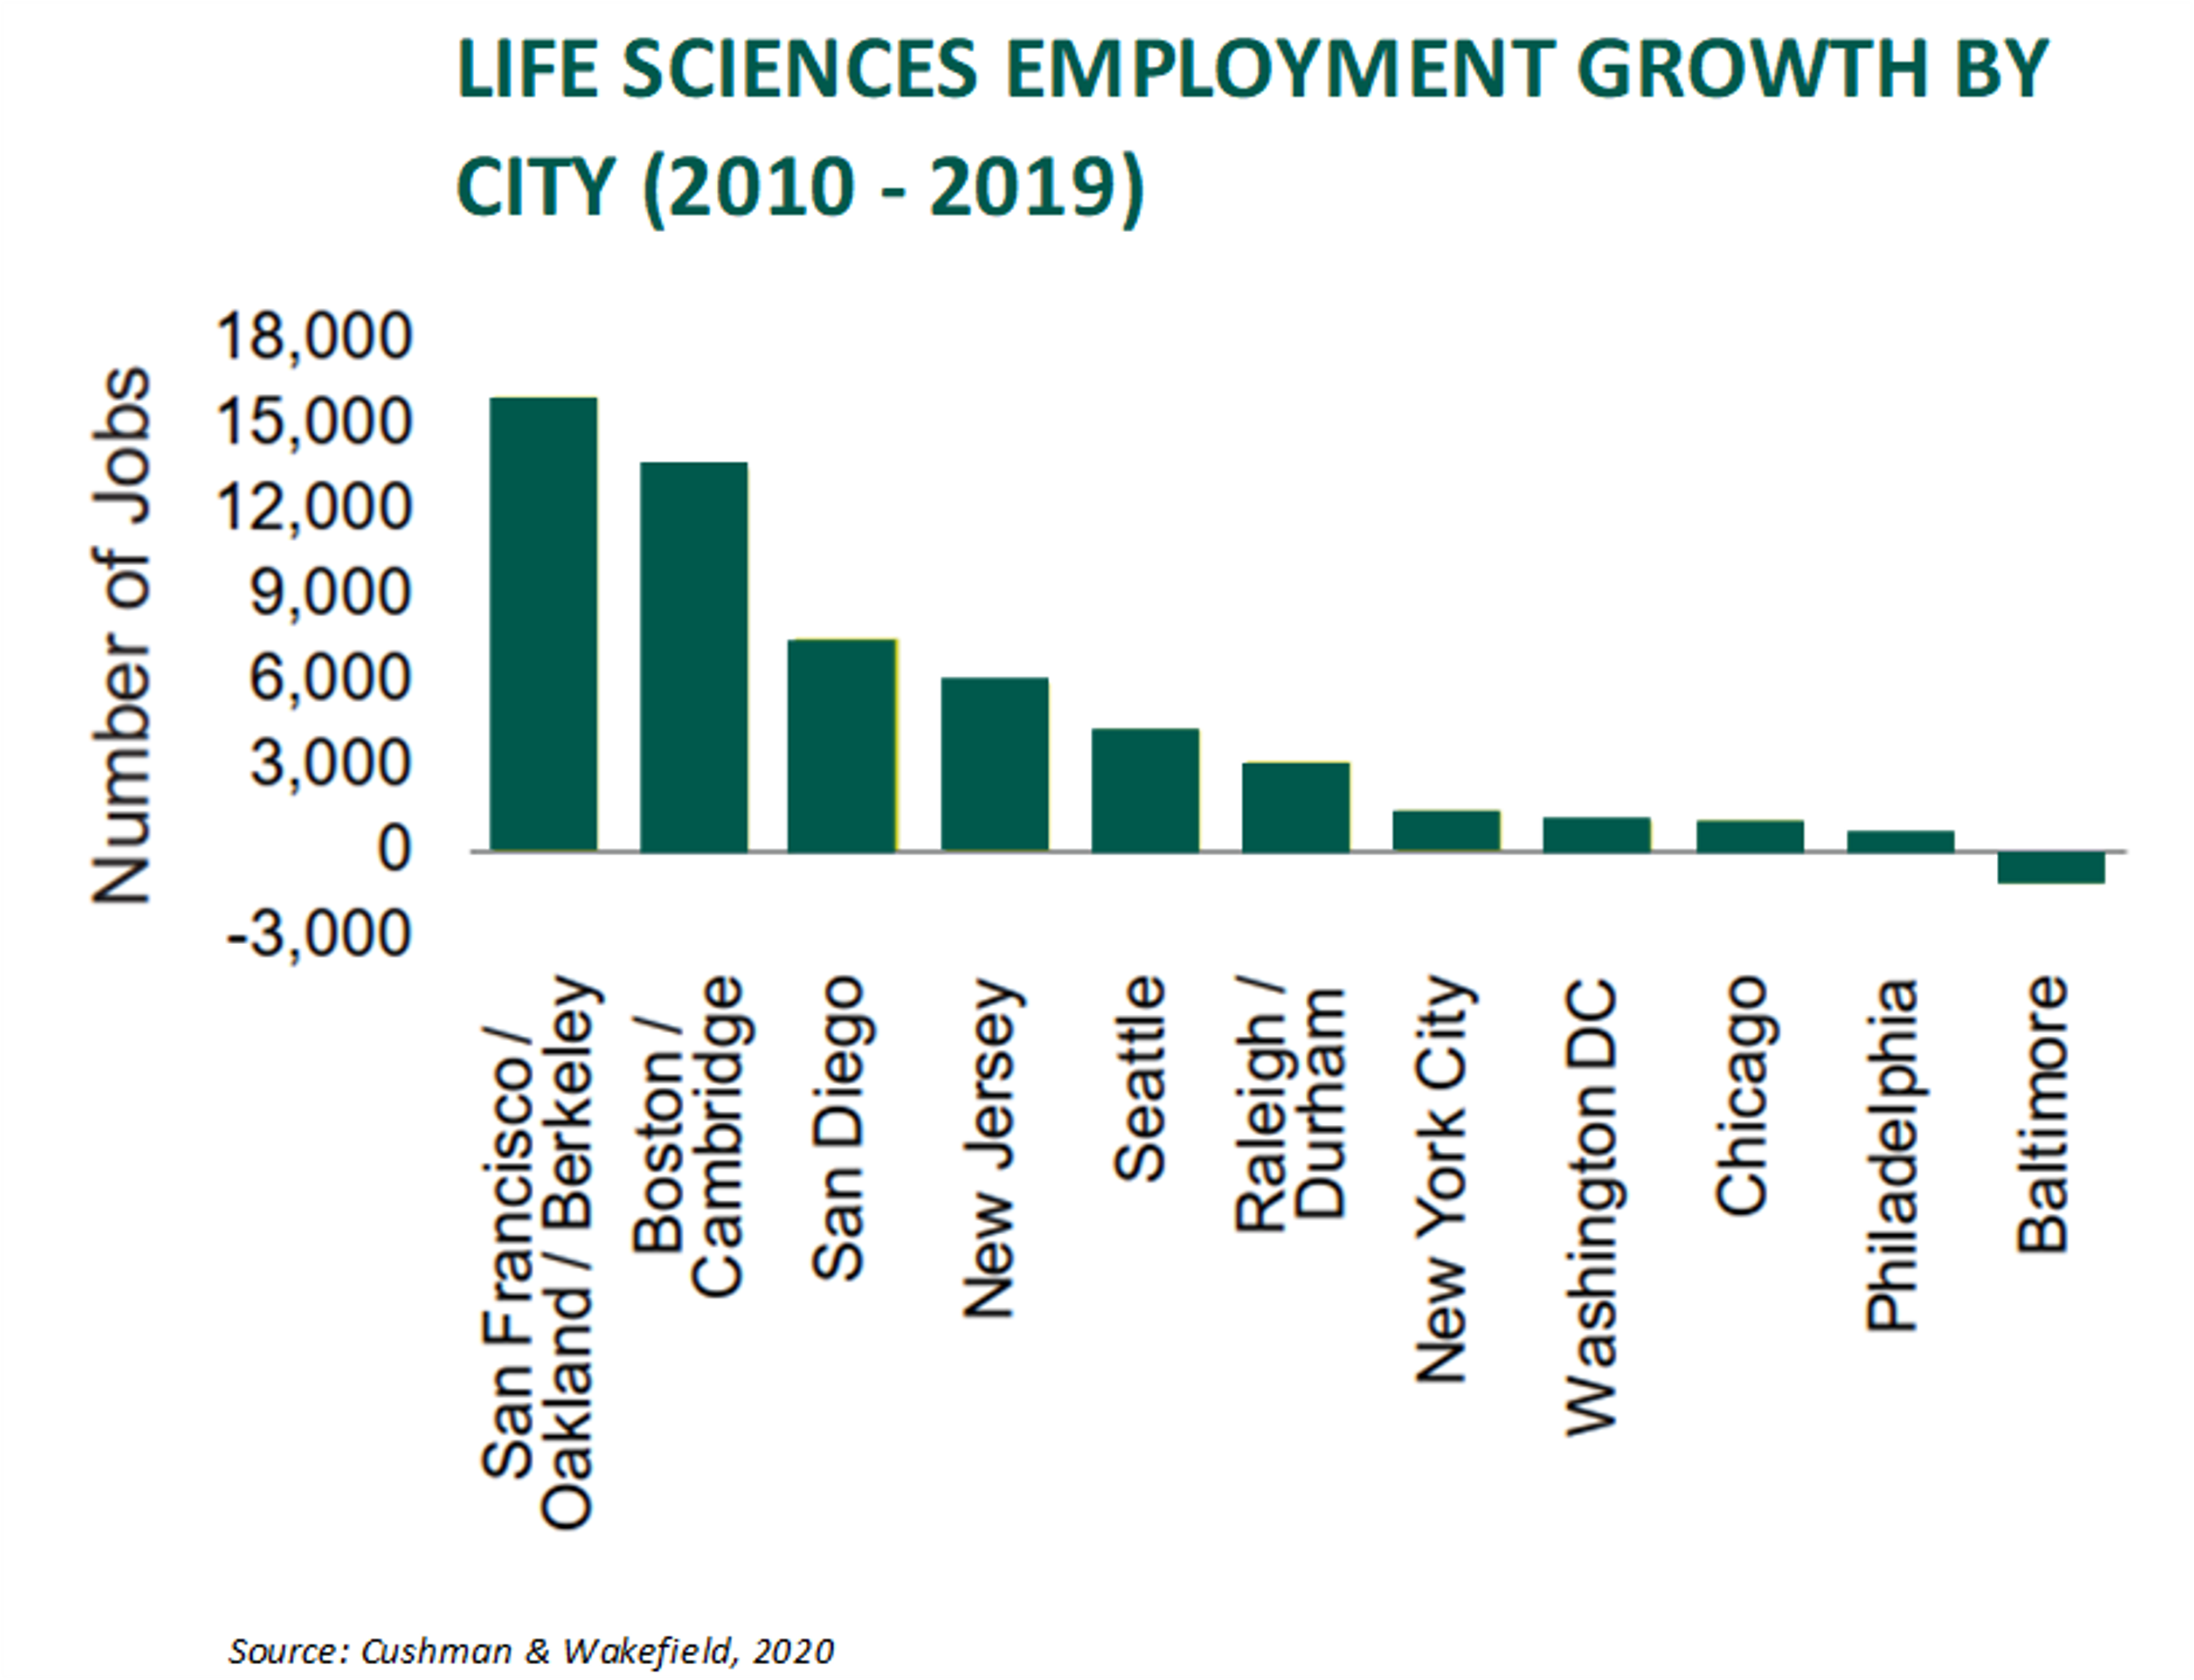
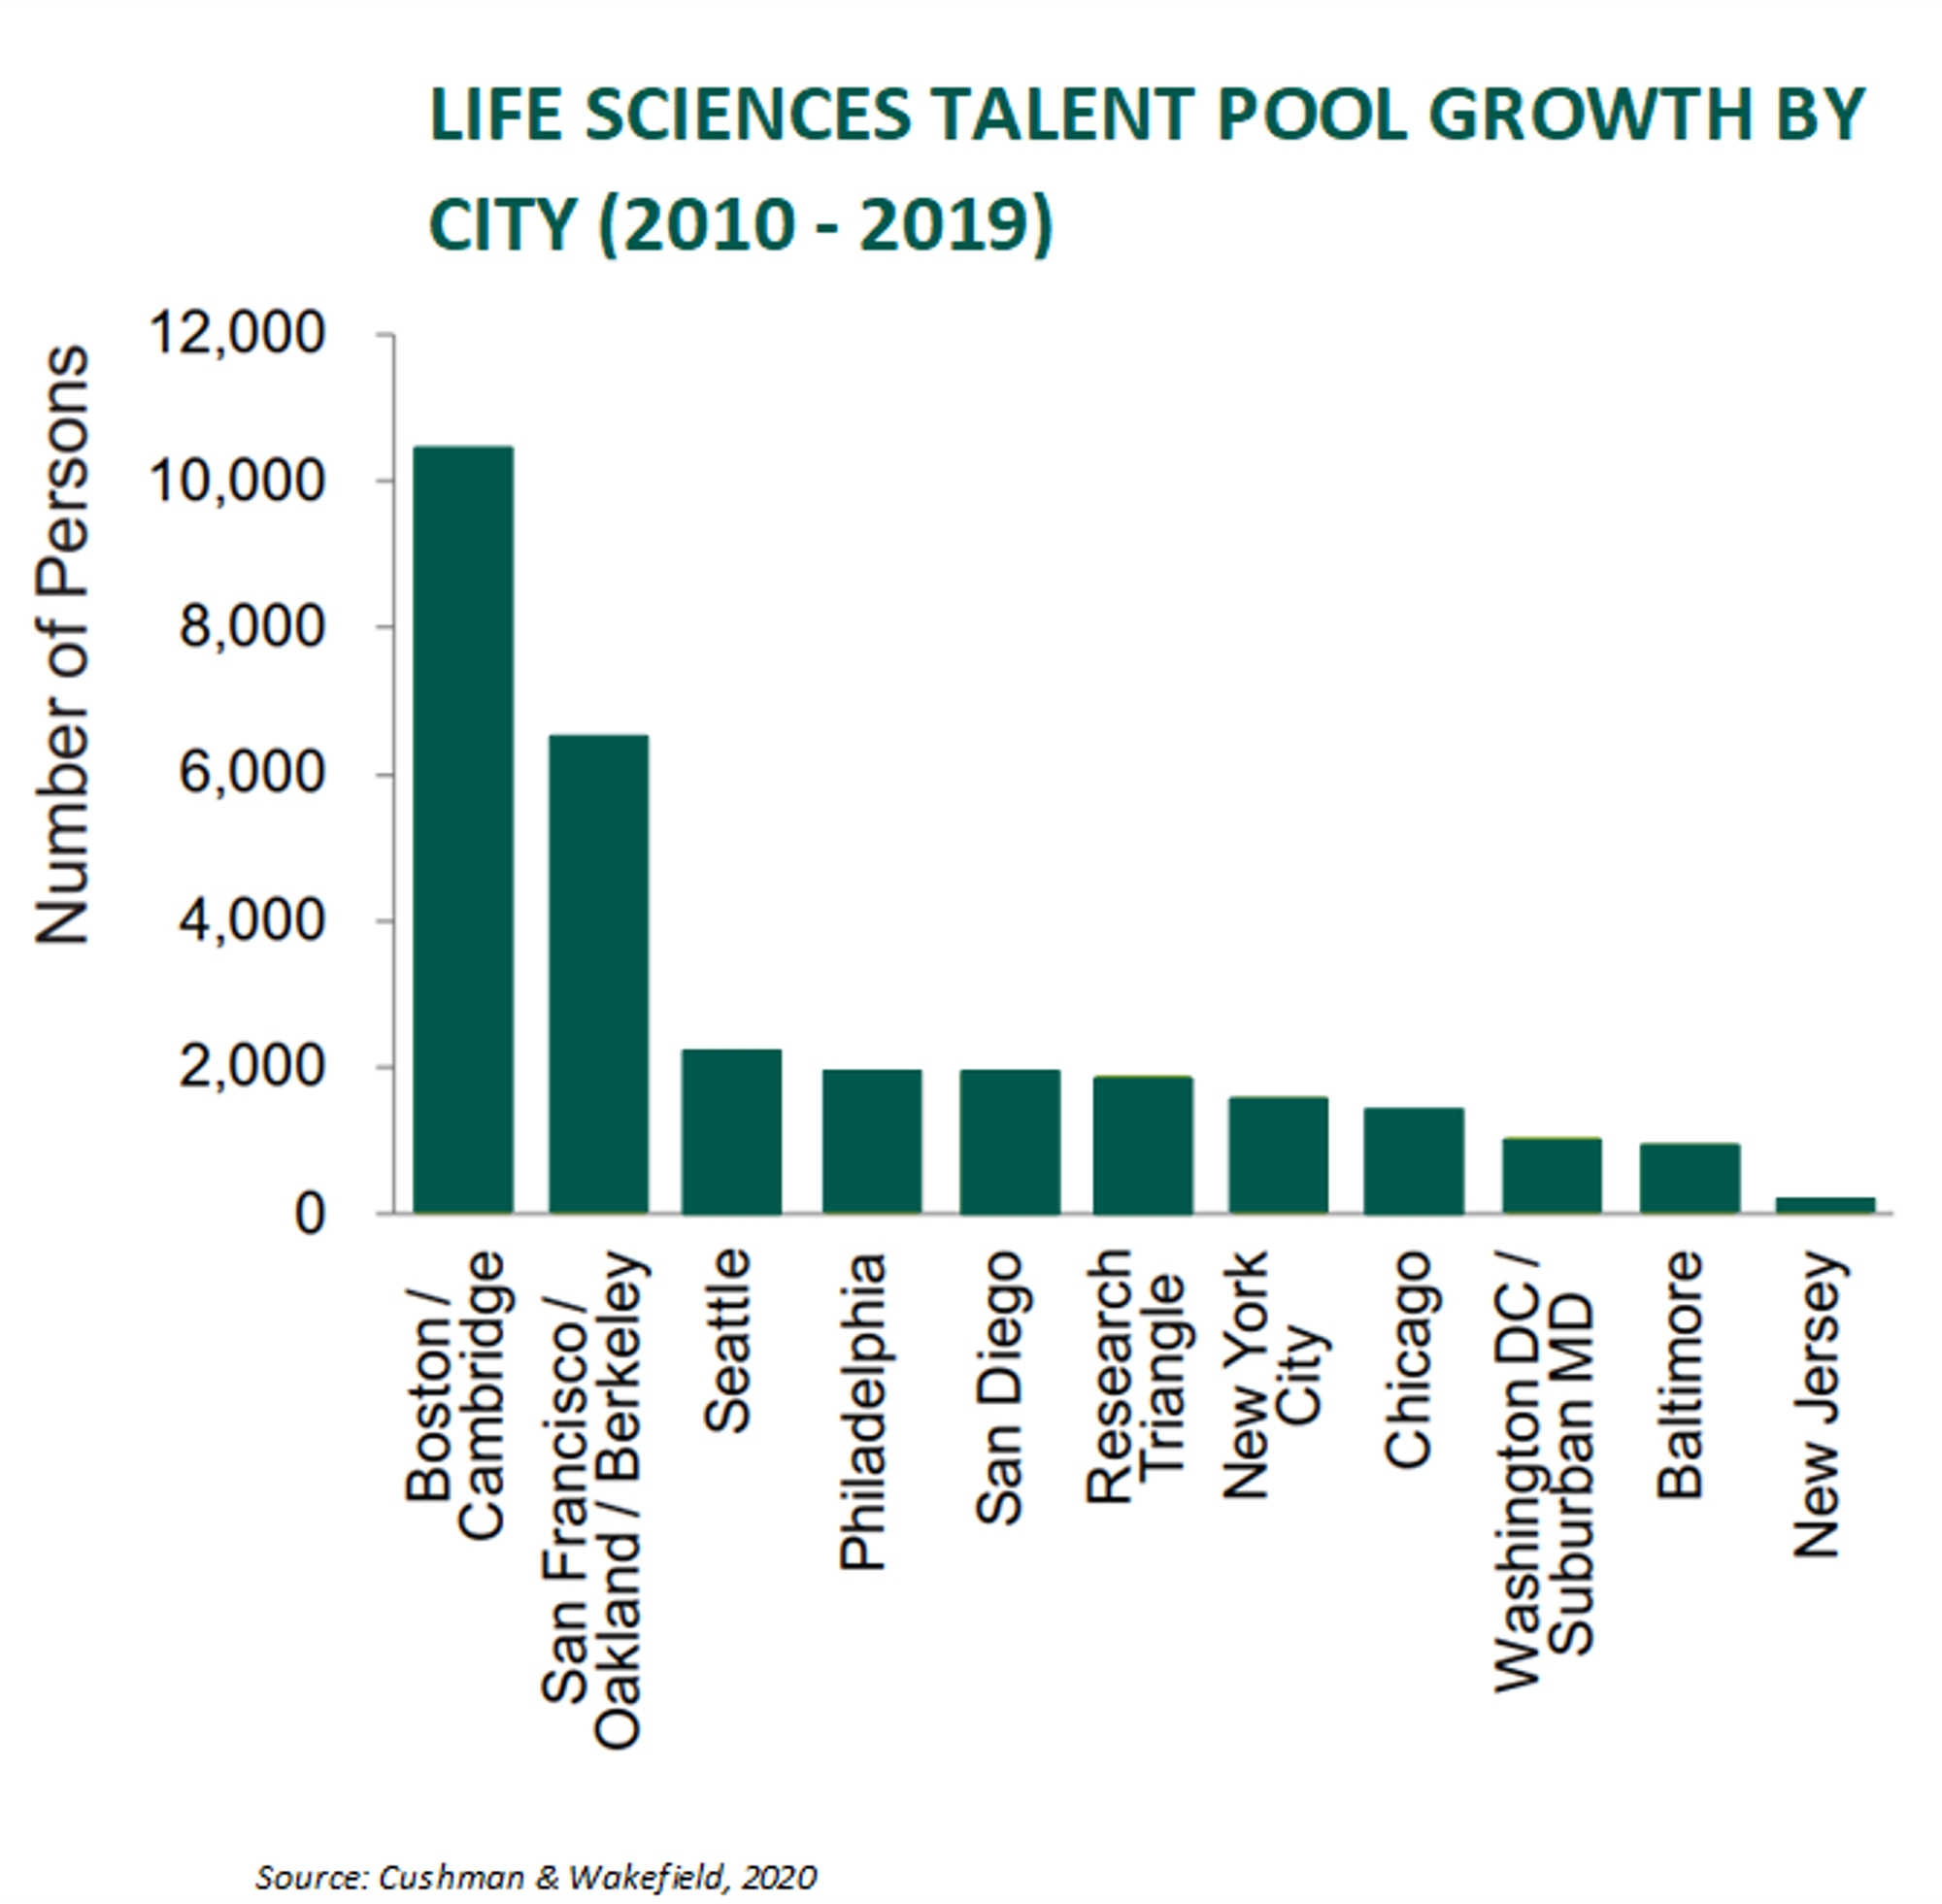
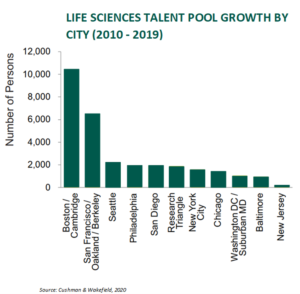
New Jersey is recognized as having a strong talent pool because it is home to several major pharmaceutical manufacturers.[12] However, the area’s talent pool has not grown much in the last decade. The majority of the growth has been in Boston-Cambridge and the San Francisco Bay area.
Employment Growth
The life sciences labor market grew in 2020 despite the high levels of joblessness across the country due to the COVID-19 pandemic. CBRE finds that life science employment is 1% higher than a year ago.[13] CBRE also notes that Biotech R&D saw the greatest employment gains: they are up 4.9% from a year ago.[14] This subsector has grown over 88% from 1999 to 2019.[15] Life sciences employment is growing rapidly and has, on average, outpaced total employment growth since 2000.[16]
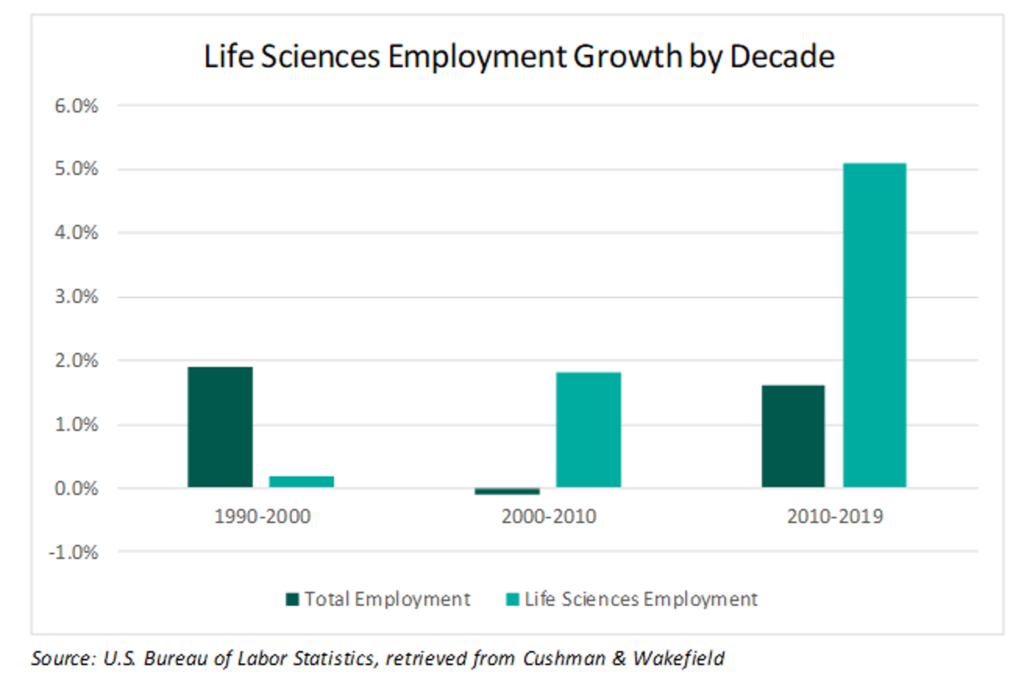
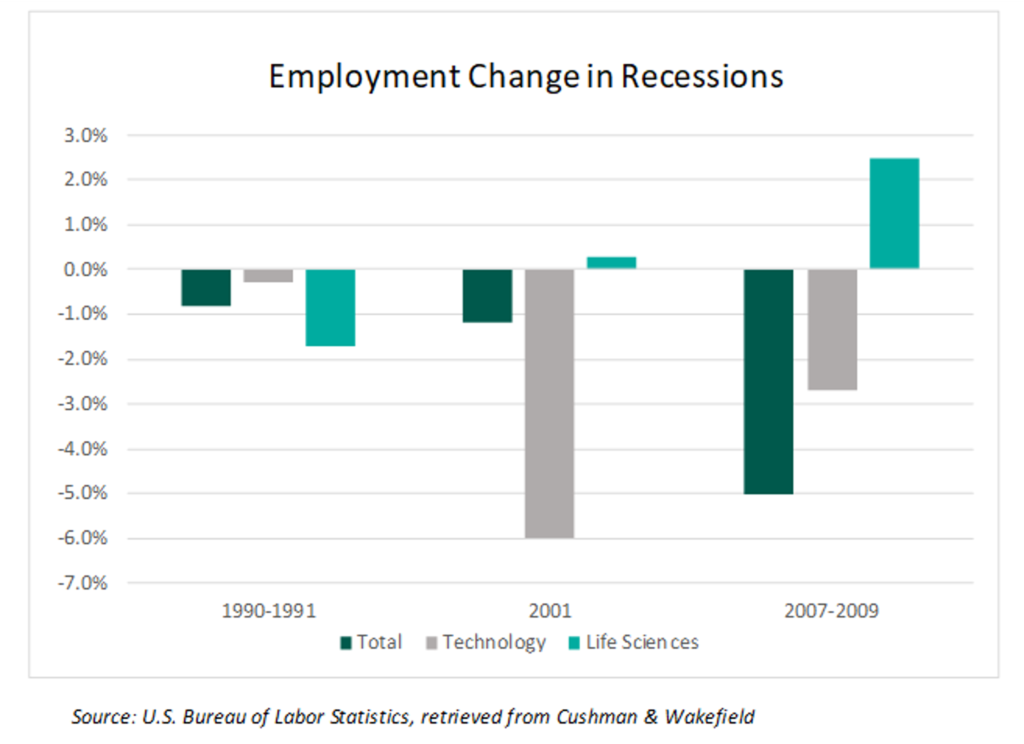
Life sciences tend to fare well in recessions. Since 2000, employment in life sciences has increased 87.9% compared to 14.4% as a whole for the U.S.[17] During the two economic downturns since 2000, life sciences outperformed the economy as well as the tech sector, which helped the industry earn a reputation as being somewhat recession resistant. The following chart illustrates unemployment fluctuations during previous recessions.[18]
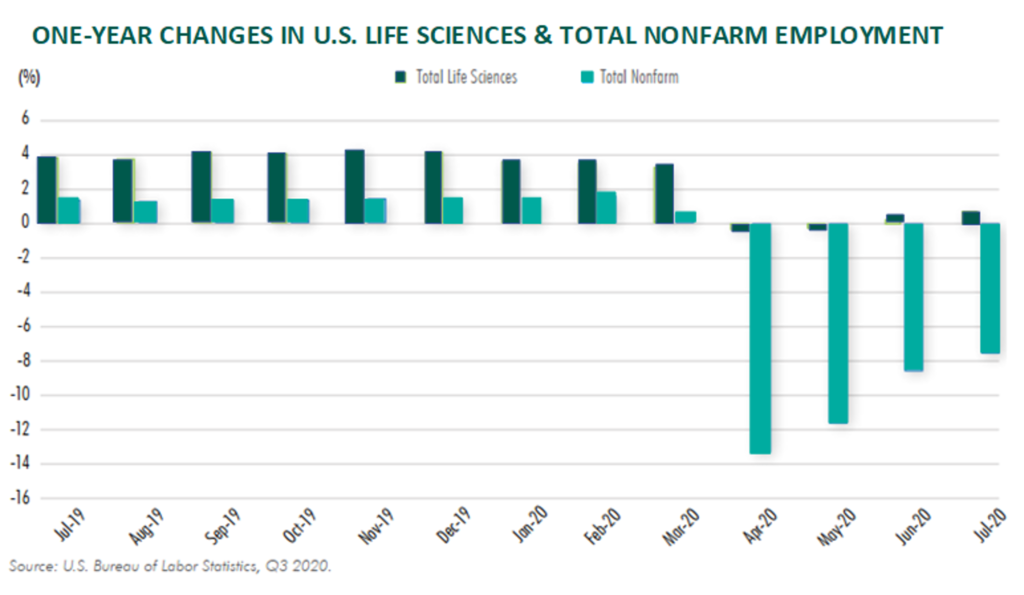
While not entirely unscathed by the events of 2020, life sciences employment was less volatile when compared to total nonfarm jobs during the COVID-19 pandemic.[19]
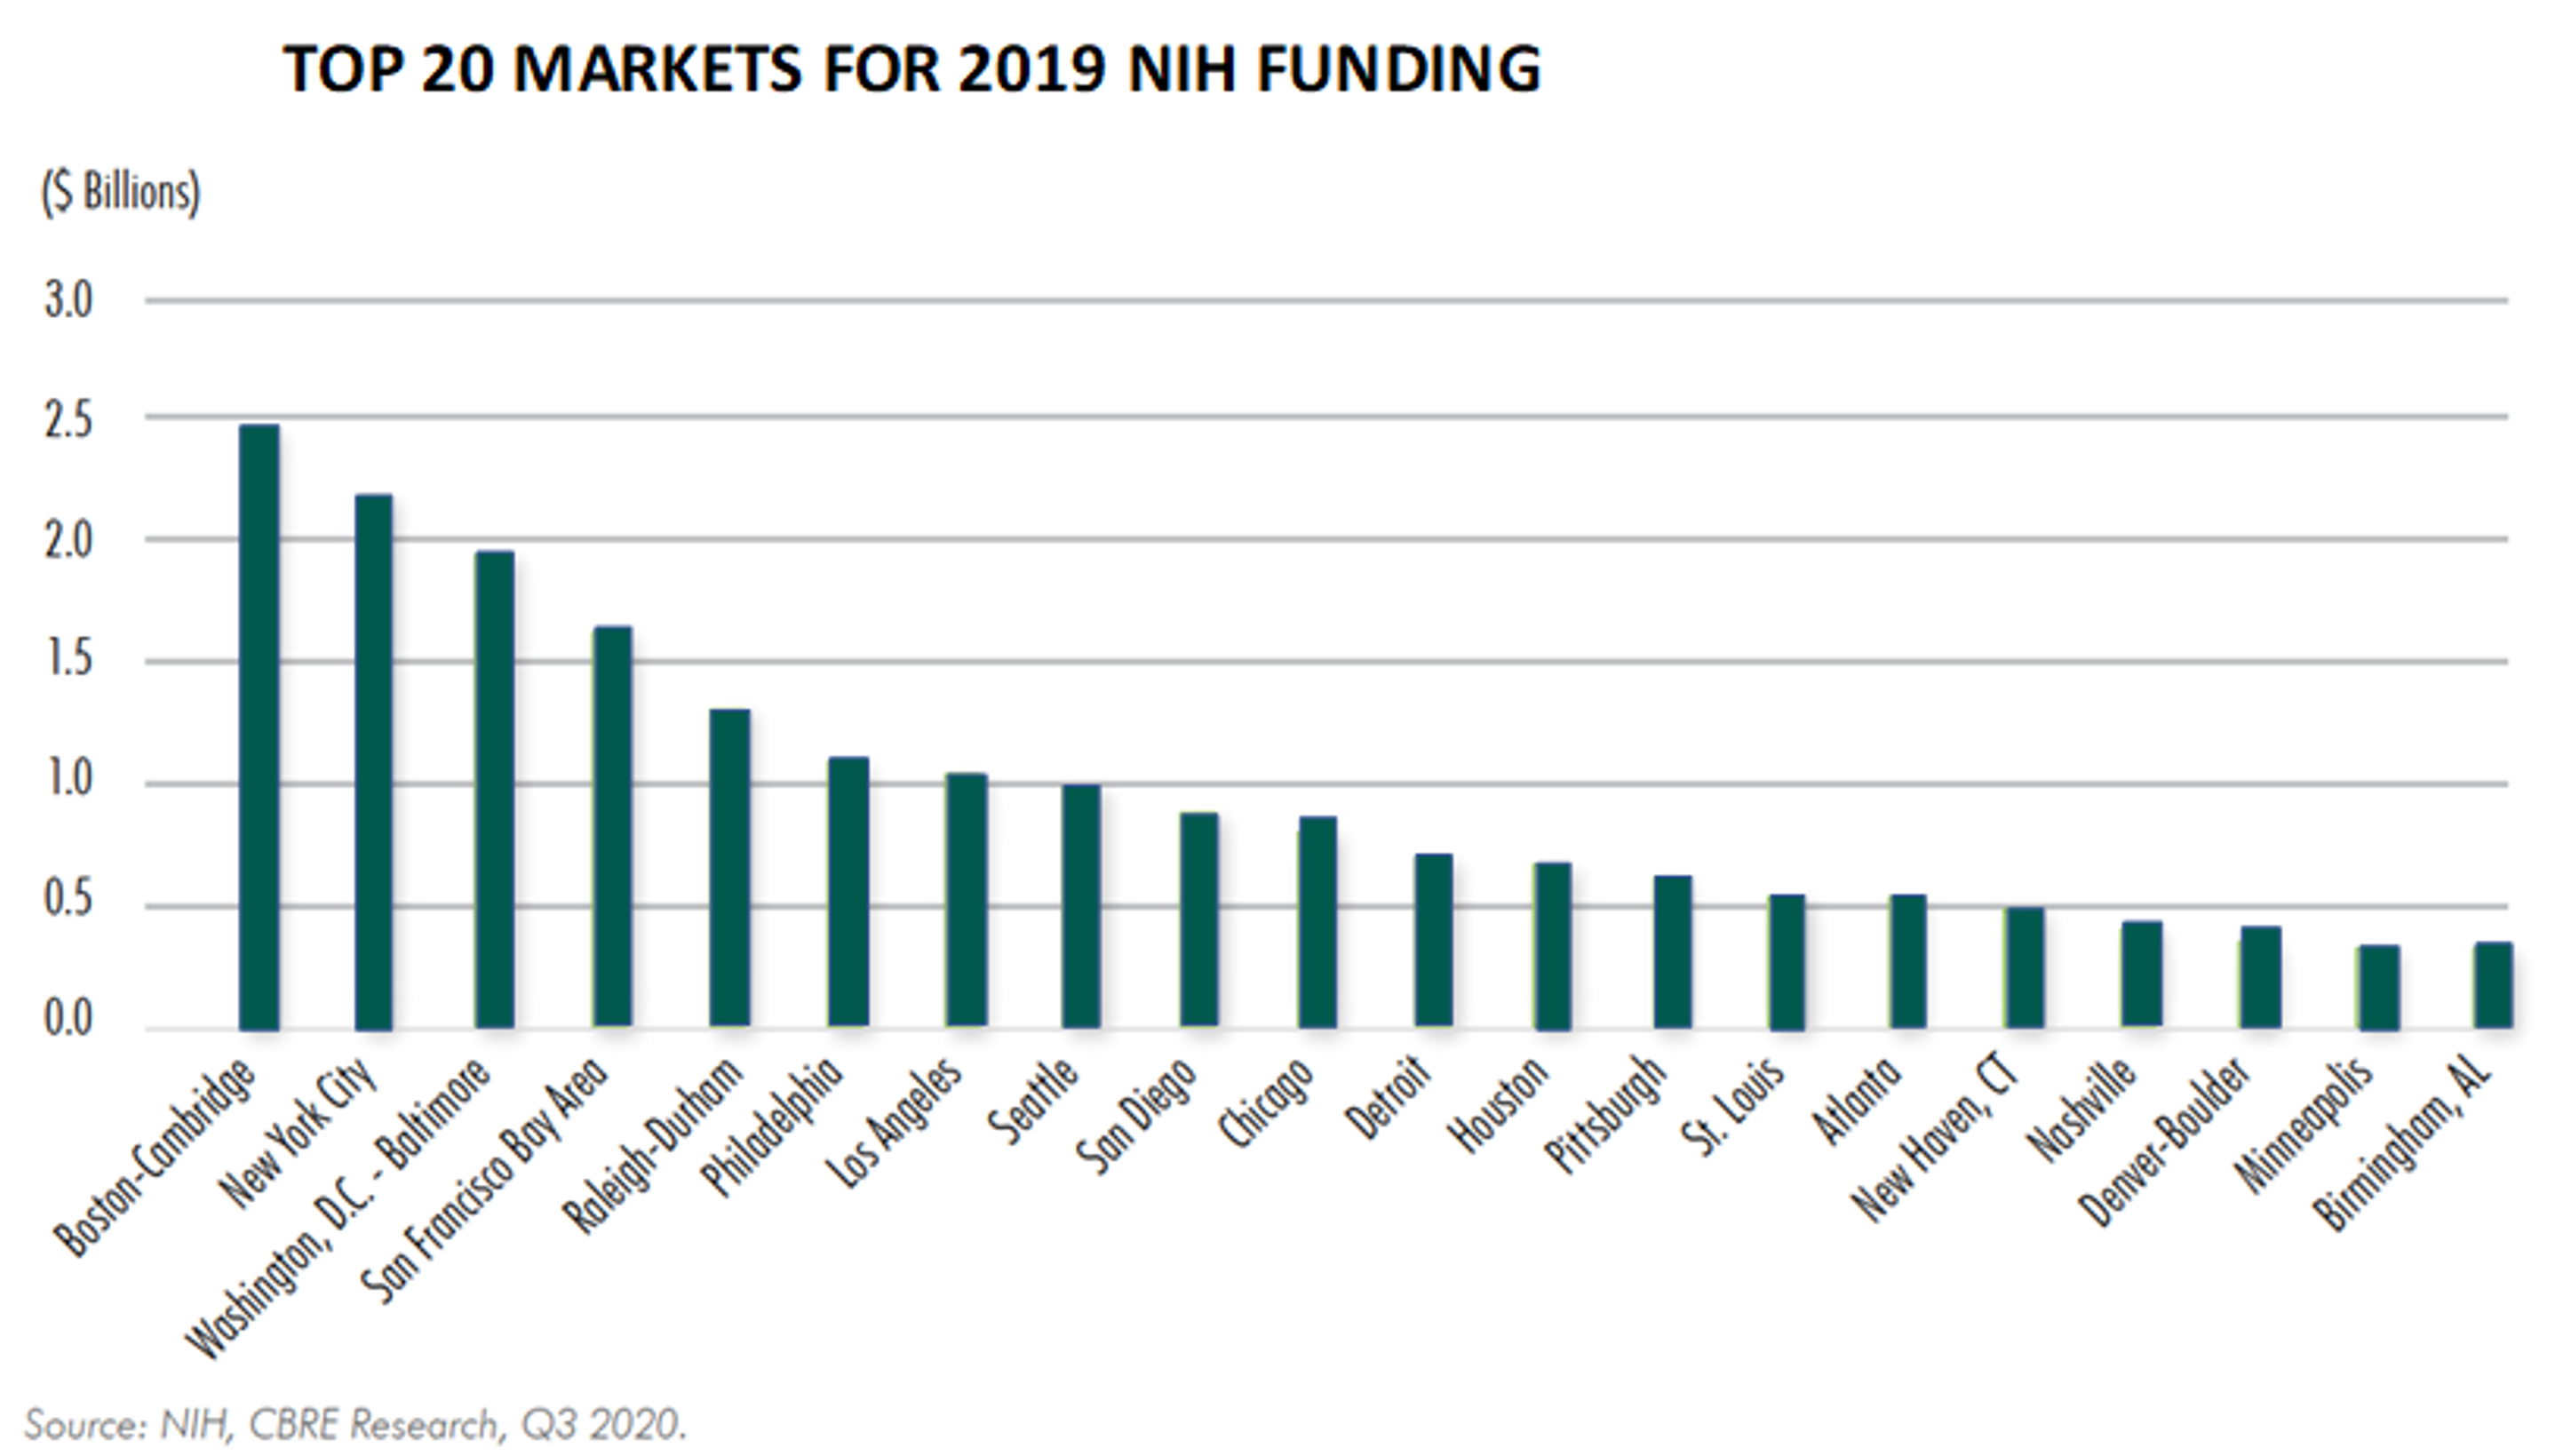
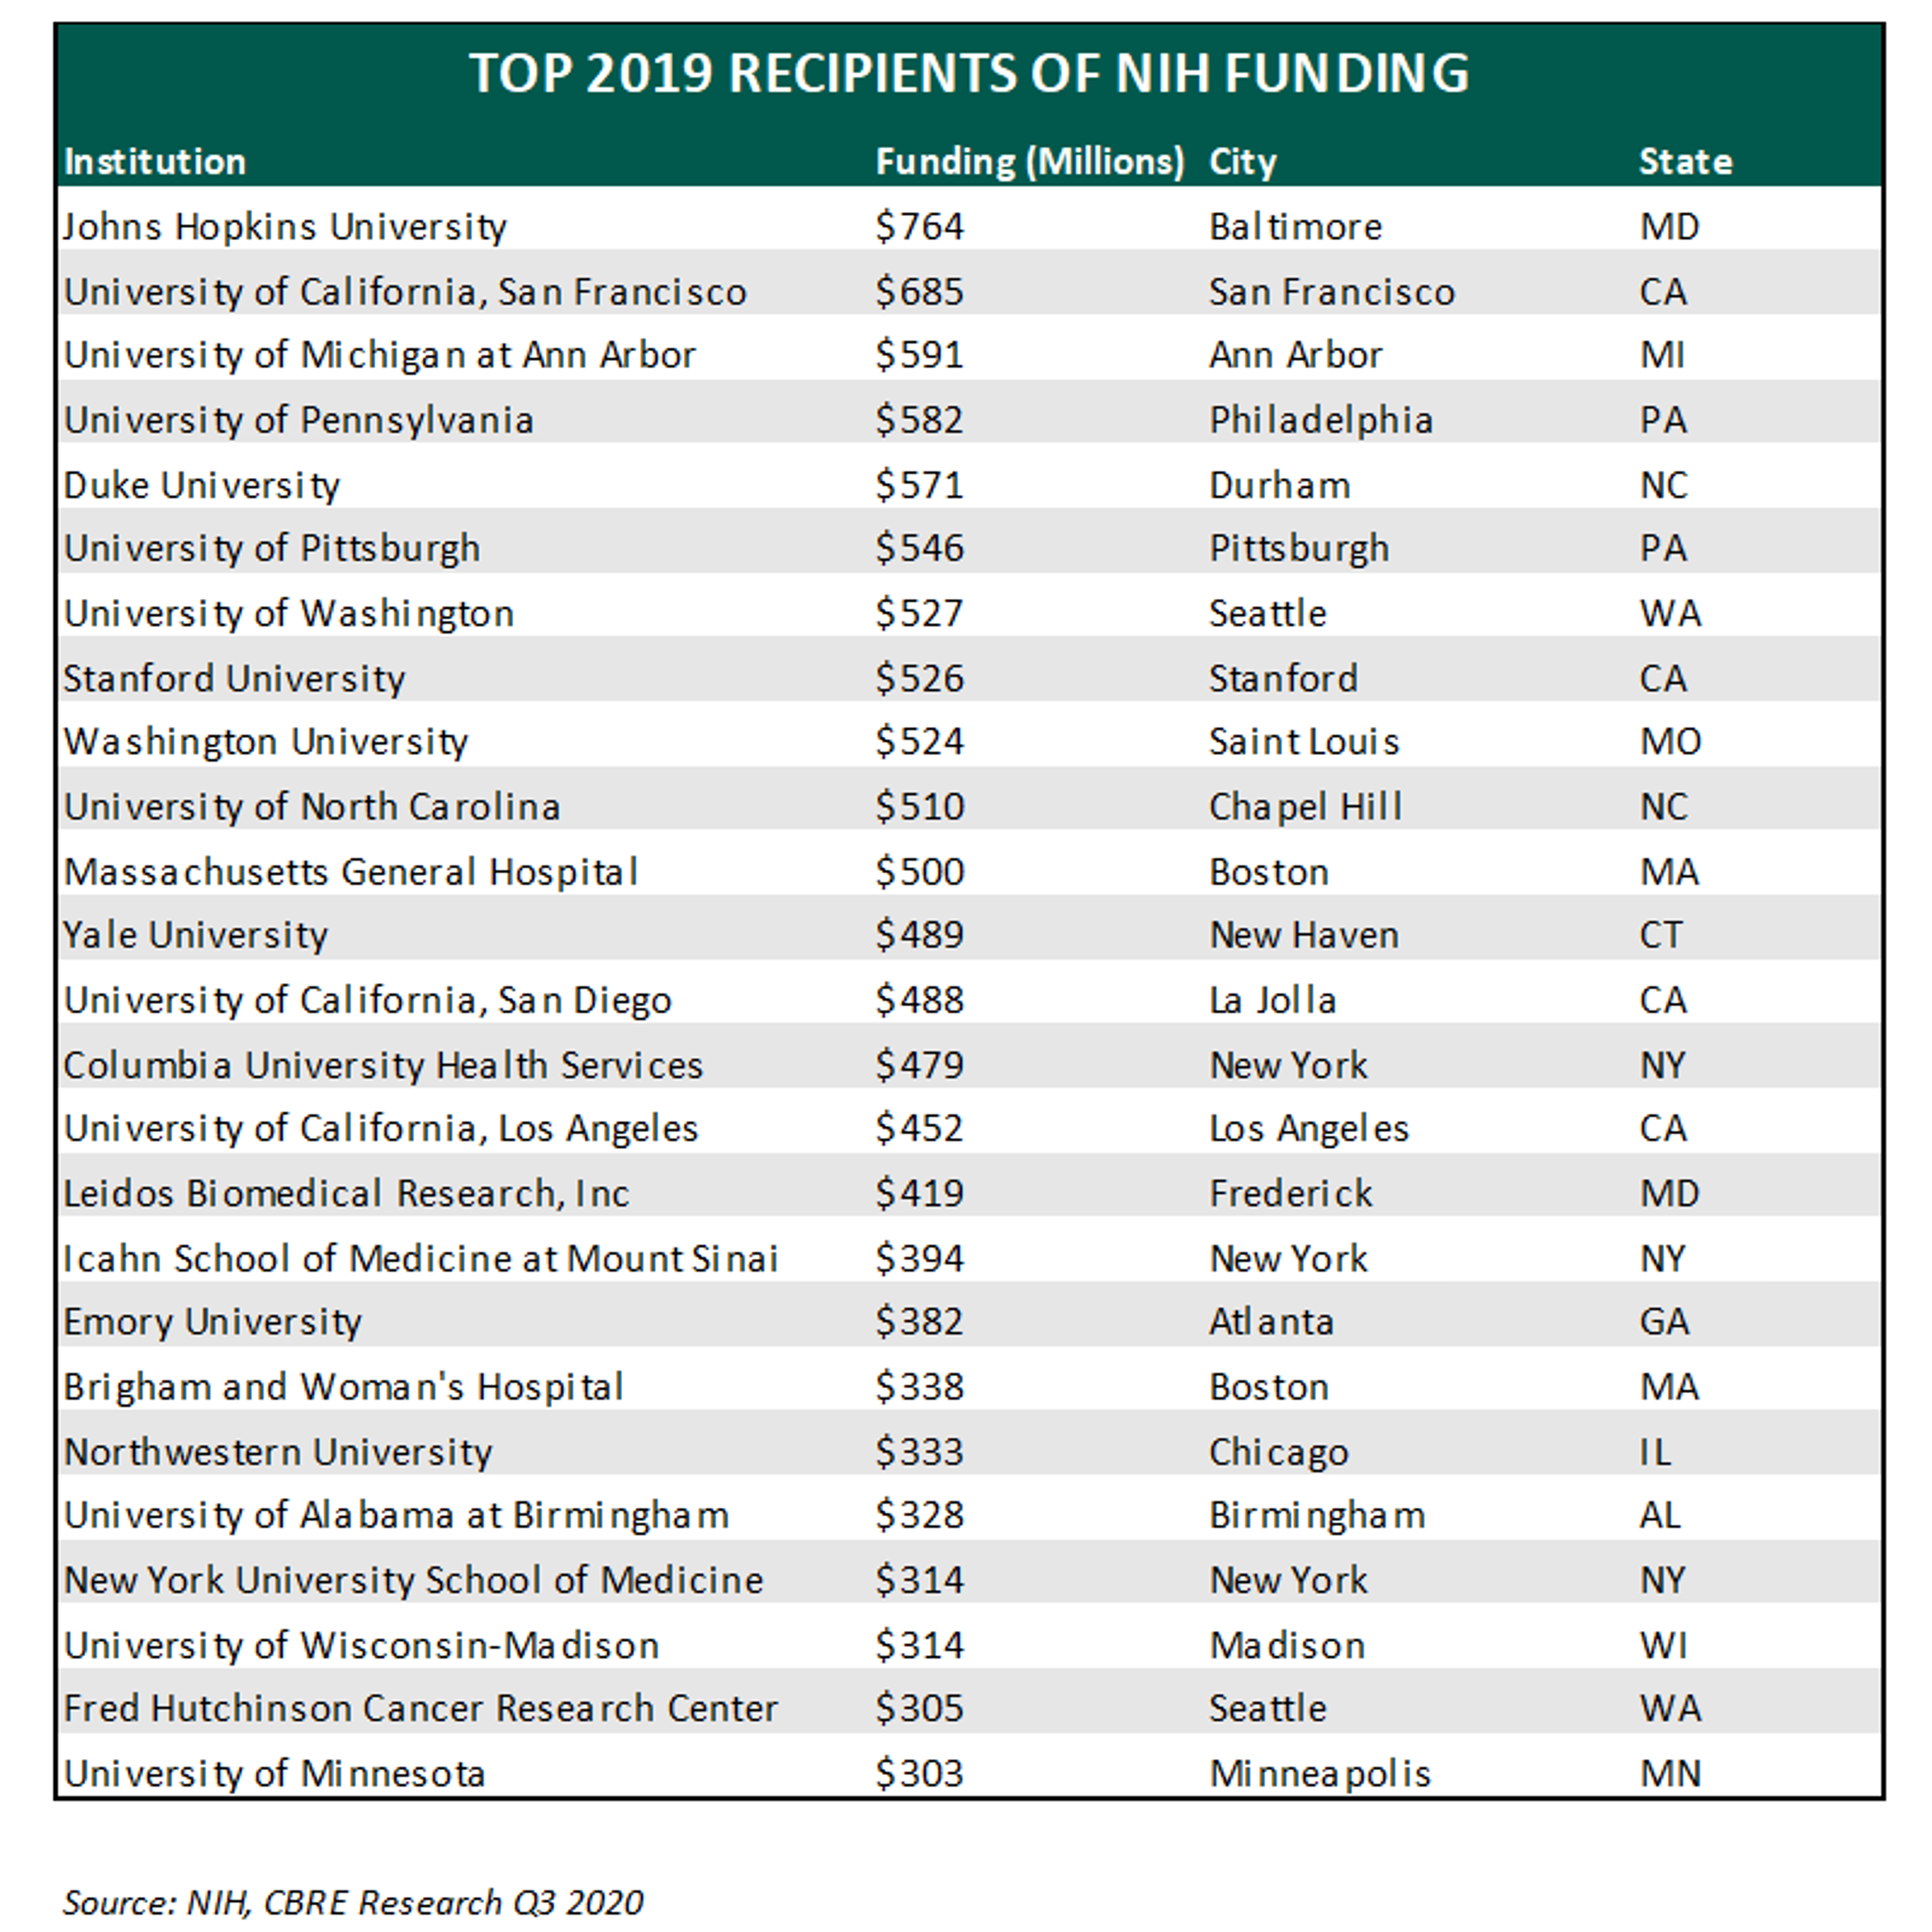
Increased Funding
Outside funding for life science facilities comes from a combination of landlord provided capital (known as a “tenant improvement allowance” for traditional office real estate), National Institutes of Health (NIH) grants, venture capital, IPOs, and SPACS. It is worth nothing that the underwriting process for life sciences is complicated by the fact that some start-up life science tenants have no credit and no revenue in their early stages of development. Therefore, if a landlord is providing capital, it must evaluate the probability of a facility “going dark” along with the potential downside value if vacancy were to occur.[20] Despite these risks, funding is increasing across the board for life science facilities. Specifically, the funding from venture capital and NIH grants for life sciences is growing ~10% a year, according to John Cox of Alexandria Real Estate Equities, the largest owner of life sciences real estate in the nation.[21] The following charts illustrate year-over-year increases in NIH funding as well as the clusters and institutions to which this capital is being funneled.[22]
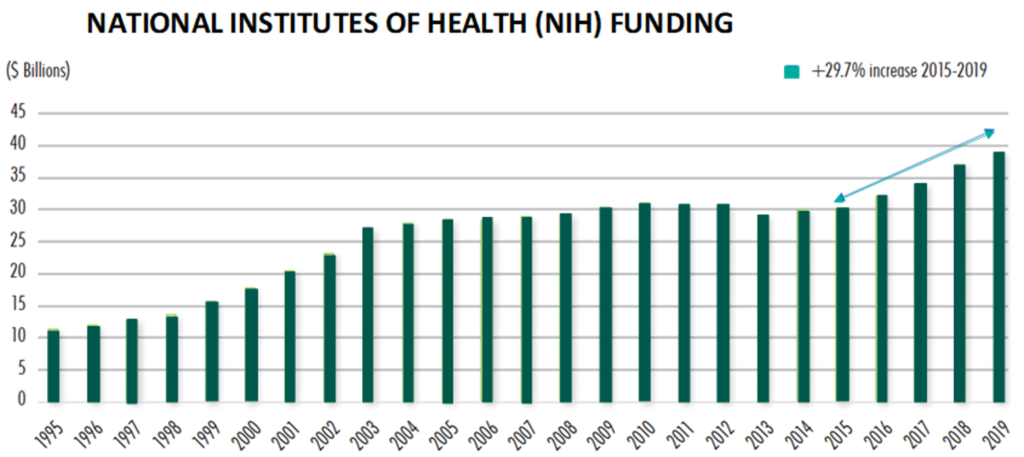


CBRE estimates the NIH funding to major universities and health-care research institutions will grow by 6% in 2020 to $42 billion.[23] One reason NIH funding is rising is that, on average, every NIH grant creates seven high-quality jobs.[24] These grants can stimulate the economy and potentially lead to significant medical breakthroughs. From 2013 to 2018, NIH received a growing number of applications and granted more money to research institutions on a year-by-year basis, according to the following graphic from Deloitte.[25]
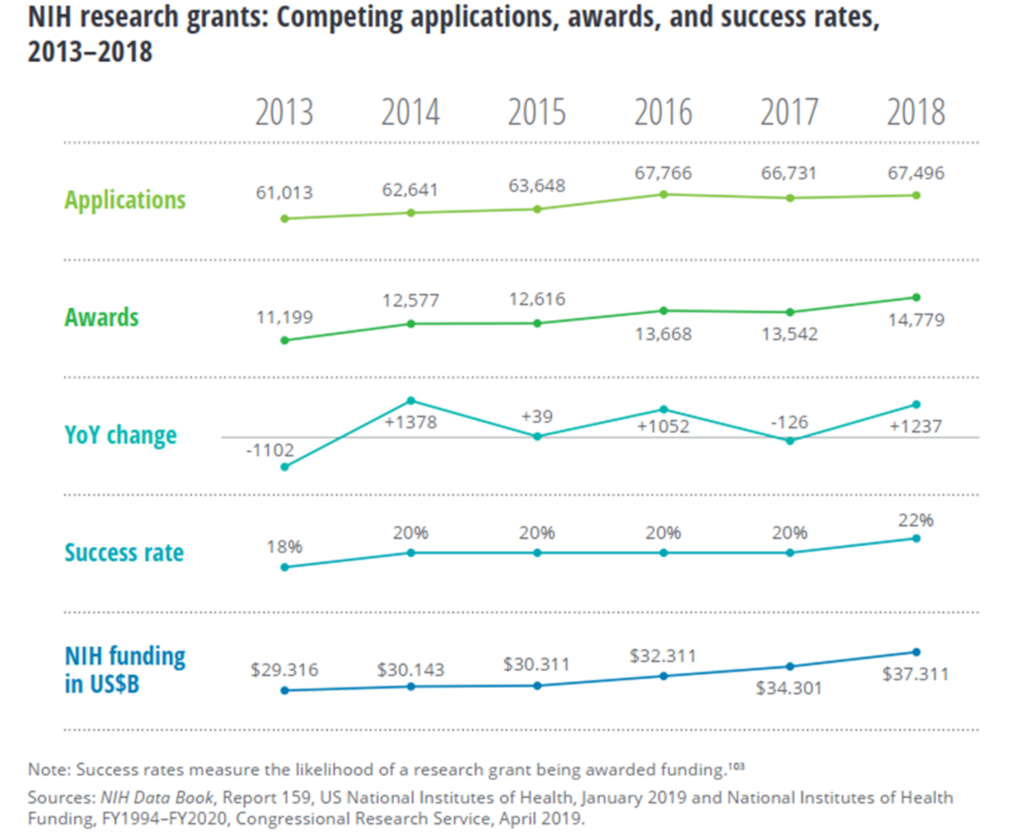
Increased funding and technological breakthroughs that lower costs make it easier for R&D to take on projects deemed too risky in the past. The following graph illustrates the level of risk and cost associated with different clinical development projects.[26]

Venture capital funding for life sciences is also on the rise, signaling an increasingly bullish investor attitude towards the asset class. The following illustrates an upward trend in VC funding for the sector.[27]
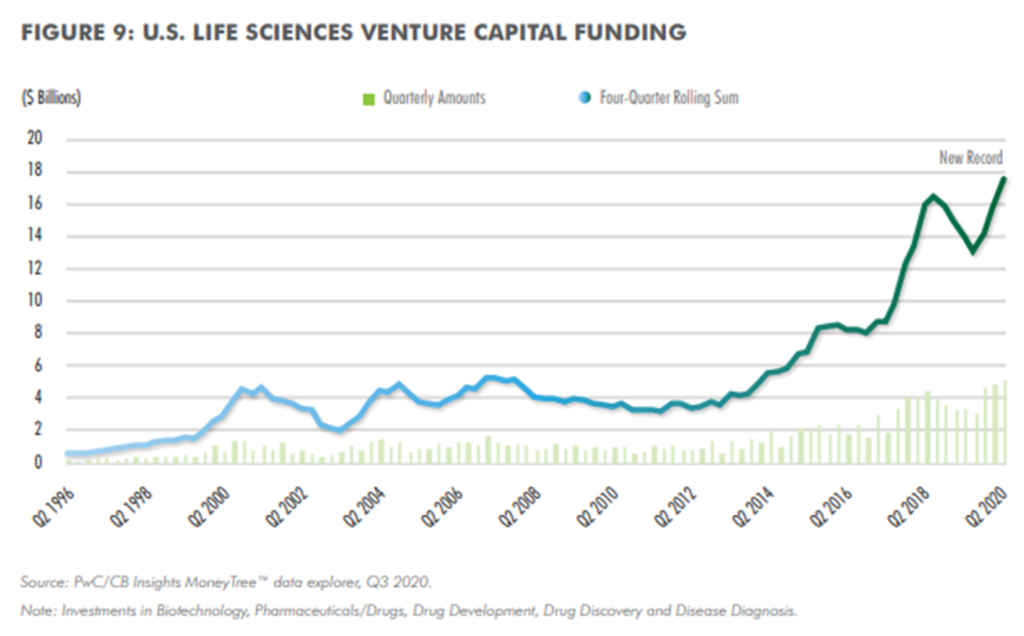
IPOs and SPACS are another source of funding when NIH and VC funding fail to acquire adequate capital for a project. The largest biotech IPOS of 2019 are outlined below.[28]
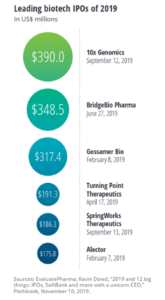
Special purpose acquisition companies (SPAC) are another vehicle for obtaining capital. There were several notable SPACs launched in 2020 to provide capital for life science deals.[29]
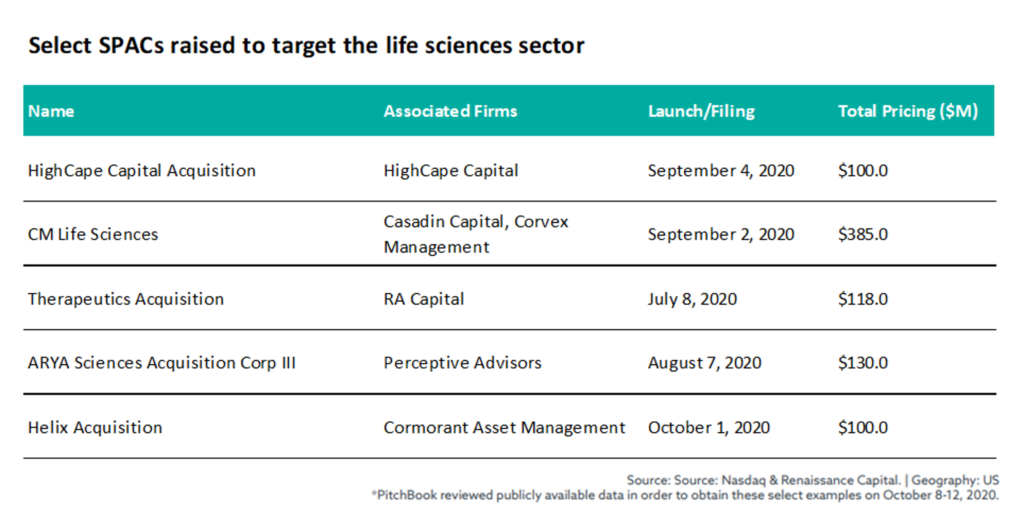
Key Players
The life sciences real estate market is fairly consolidated due to the high cost of development. Newmark Knight Frank compiled a list of the industry’s top ten owners as shown below.[30]
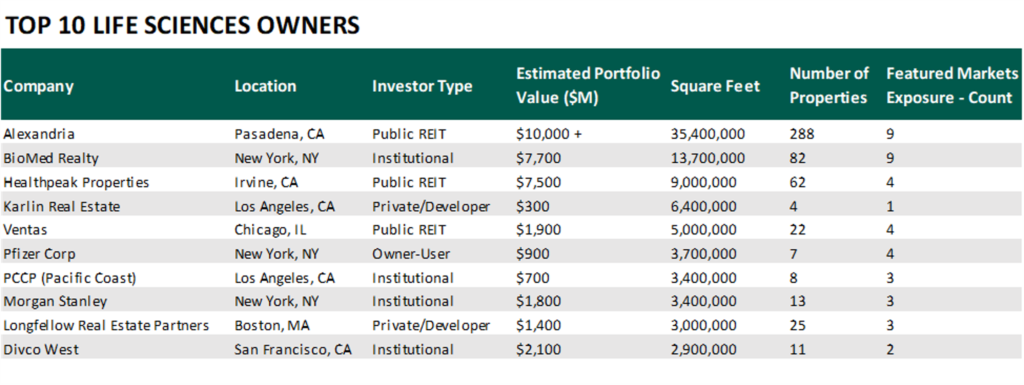
Source: Newmark Knight Frank
Covid-19 Impacts on Market
While COVID-19 has upended most businesses and facets of daily life, it has had less of an impact on the life sciences industry. One reason is that life science tenants are able to operate as “essential” businesses and continue to occupy their spaces, although they must modify operations to maintain social distancing standards with staggered shifts and use personal protective equipment in all spaces.[31] Operations in labs (such as drug trials and development) are difficult to replicate at home, meaning office space for life sciences is not being subleased or renegotiated while tenants work remotely.[32] There has been little disruption to daily operations when compared to that of traditional offices. However, this industry is not immune to the economic headwinds resulting from COVID-19: the risk of VC funding drying up poses a significant threat to smaller, startup firms in the sector.[33]
Despite national economic volatility, the life sciences industry has fared relatively well in the face of the pandemic. Some speculate that the industry could “potentially emerge from this event in an even stronger position, while the shortfall in lab supply across the region will further encourage rapid ground-up development and office-to-lab conversions as rents reach cyclical highs.”[34] JLL expects capital markets interest to increase as life sciences proves to be a resilient investment in the current climate.[35]
Cushman & Wakefield reached a similar conclusion in a recent publication, noting that rapid technological advances and “surging demand from an aging population are creating a positive environment for life sciences growth.”[36] Cushman & Wakefield predicted increased demand for lab space and believed this upward trend in occupancy will “tend to give this sector a degree of recession resistance.”[37]
Regardless, the outbreak of COVID-19 has led to several health, economic, and social changes in the life science industry. The following graphic, sourced from JLL, illustrates short-term and long-term impacts of these changes on demand for the industry. [38]
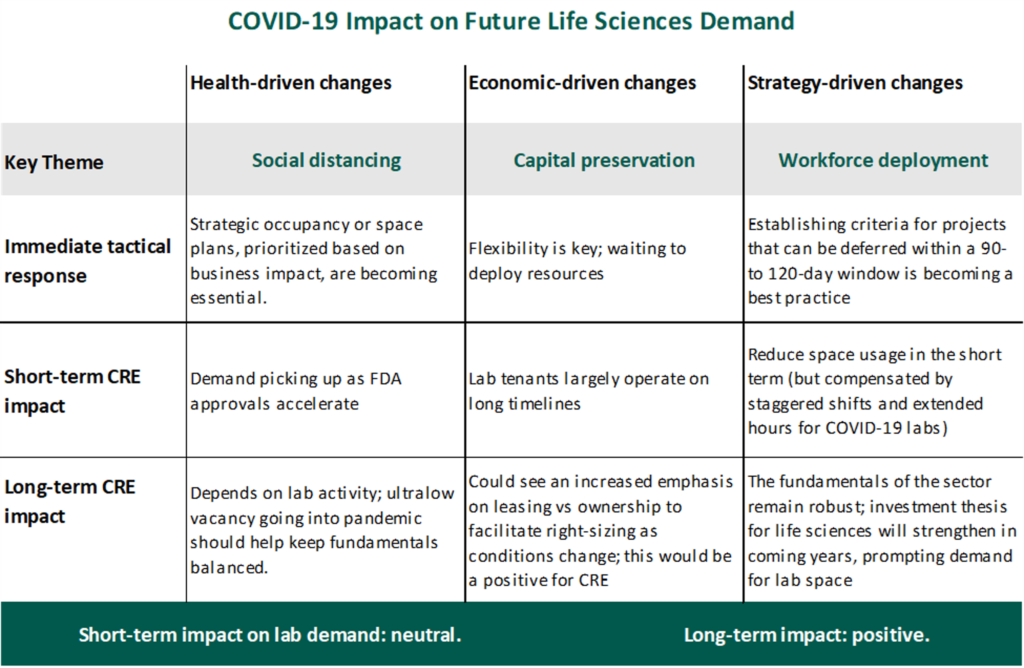
Source: Jones Lang LaSalle
The comments of key players in the industry also suggest stability with growth potential. Alexandria and other biotech real estate holders, such as Biomed Realty and Healthpeak Properties, are not seeing the same challenges as their general-office counterparts when it comes to issues such as vacancy and rent collection during the pandemic. Collections are strong and vacancy remains low in this sector. For example, on July 28, 2020, during their Q2 earnings call transcript, Alexandria Real Estate Equities, the nation’s largest holder of biotech real estate, cited a 16.9% revenue gain. [39] Alexandria’s Co-CEO, Stephen Richardson, said the company collected 99.5% of accounts payable during Q2, and “the company leased more than 1 million square feet during the period, topping its first-quarter total.” [40] Alexandria’s overall portfolio is “94.8% leased up, and its rate of early lease renewals – a sign that companies are expecting to stay in place and not reduce space needs – was 78% during the quarter, well above the 69% it saw in earlier quarters before the pandemic.”[41]
Not only is lab space seeing demand, but government regulations are making manufacturing space more desirable for other tenants who could develop useful products during the pandemic. Manufacturers for masks and other PPE will benefit from the Defense Production Act, leading to an even greater demand for lab space during this time. Despite the pandemic-induced recession, the long-term outlook for the sector remains positive, as concluded by JLL and other industry analysts.
Underlying Market Fundamentals
The industry displays strong market fundamentals: pricing is competitive, demand is strong, the supply is growing, cap rates are compressing, rents are rising, and vacancy is low. Facilities for life sciences are unique in that they require a specialized buildout above and beyond the standard professional office space. Upgraded power and backup systems, added ventilation, lab pod designs, vivariums, the need to operate 24/7 and work in a secured environment, along with other tenant specific needs make these special use facilities. Tenant improvements can add $150 to $200 per square foot (or significantly more) on top of the base building work that the landlord provides. A vivarium alone could potentially cost over $1,000 per square foot due to the specialized systems requirements. Because of these added costs, rental rates are higher than those obtained for professional office or medical office space. Although rents vary with market, buildout, and other factors, they can range from $30 to $100 per square foot per year. Even at these rents, vacancy rates are lower than professional office indicators, with certain life science markets as low as 2%. Sale prices range widely, with lower quality, older facilities selling for under $300 per square foot, whereas highly specialized, new facilities in premium markets can command sales prices over $1,500 per square foot.
CBRE reported life science sales leading up to Q2 of 2020 to be around $9.6 billion, a 9-fold increase from 2001.[42] $9.6 billion is 18% lower than the year before, indicating that the industry may have been negatively impacted by COVID-19’s economic uncertainty, but CBRE notes pricing remains “intensely competitive” within this sector as tenant demands for space translates to a growing supply and rising rents.[43] The majority of sales took place in primary clusters (Boston-Cambridge, San Francisco, San Diego). High quality facilities in strong locations regularly command cap rates in the 4’s.
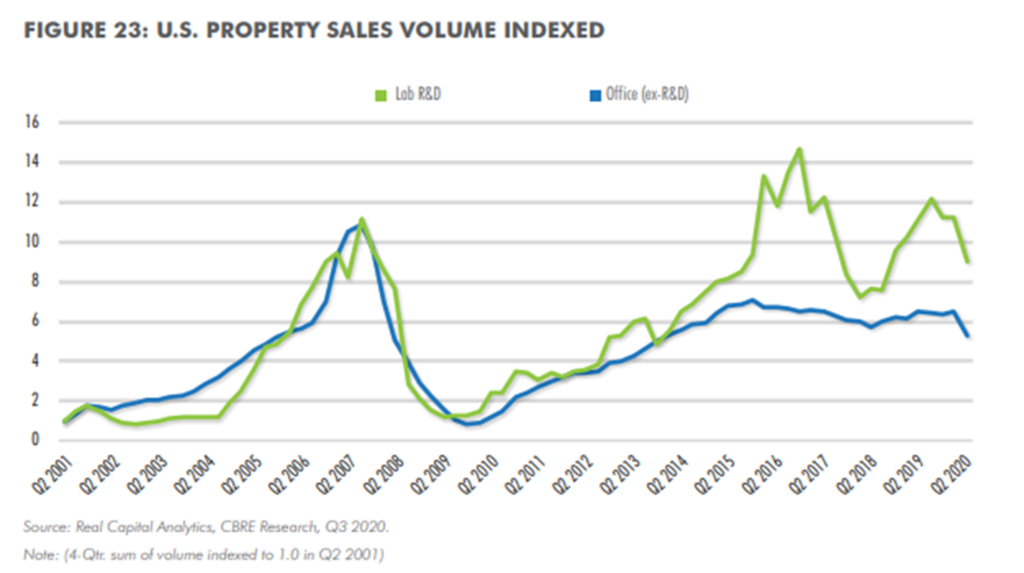
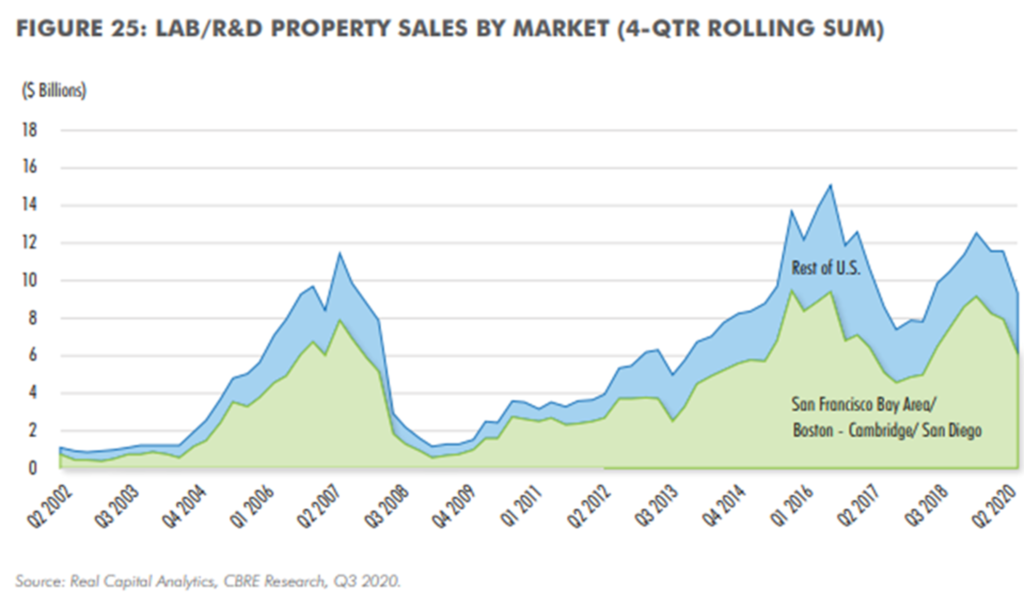
The total supply of commercial lab space in the U.S. grew by 12% in 2020, up to 95 million square feet, with an additional 11 million square feet under construction.[44] Because global supply chains have been negatively impacted by COVID-19, more life science manufacturers are moving onshore, leading to an even greater demand for domestic space.[45] The following graph illustrates the change in inventory for the industry.[46]

There are more tenants looking for lab space than there are lab spaces in the U.S., which is partly why the rents are high and vacancies are low in this sector.[47]
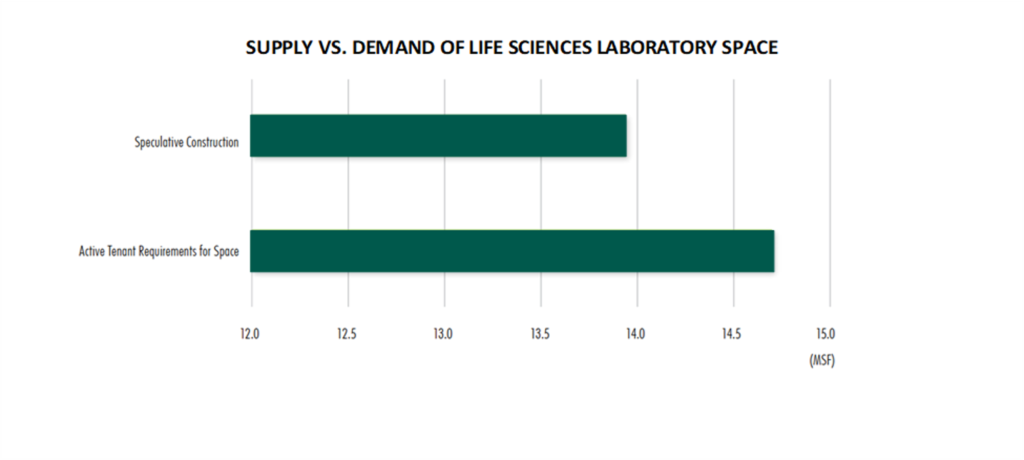
Cap rates for life sciences have been compressing over the last few years. Cap rates for life sciences have remained lower than cap rates for conventional offices since 2015.[48]

Life science labs tend to have low vacancy rates, especially within competitive, primary clusters.[49]
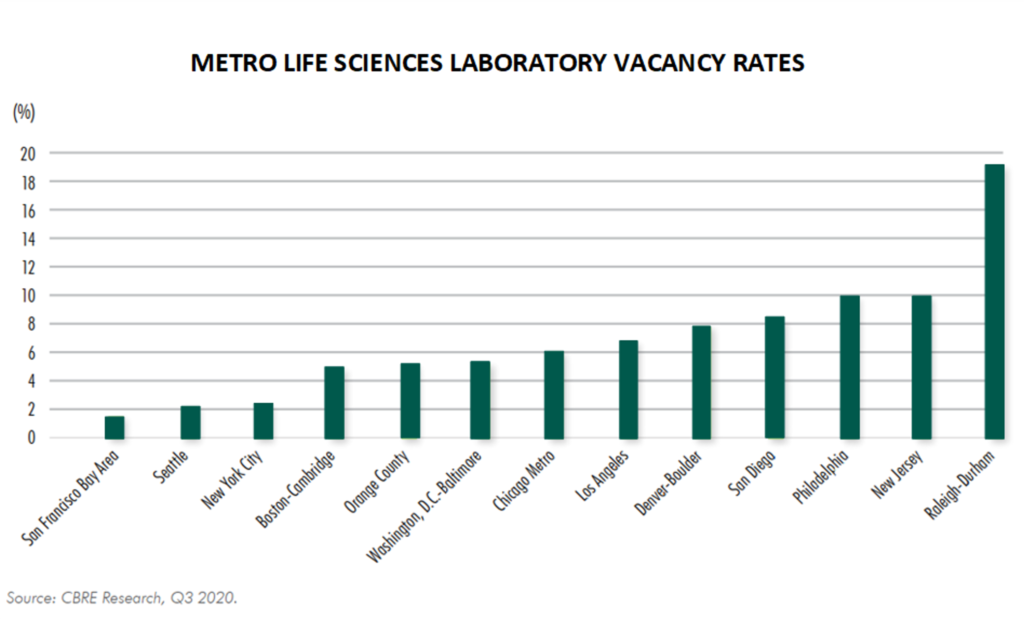
Life sciences labs also tend to have higher rents when compared to their traditional office counterparts.[50]

The following tables outline average asking rental rates (NNN) and vacancy rates for the top three life sciences markets: 1) Boston-Cambridge, 2) San Francisco Bay area, and 3) San Diego. Data was sourced from CBRE, Cushman & Wakefield, and NKF.
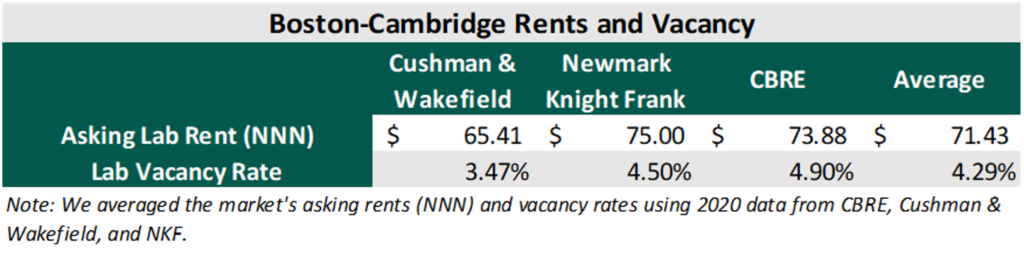
Boston-Cambridge lab market has been characterized with outsized demand, limited supply, and rising rental rates. The average TIs for this market, according to NKF, is $150-190/SF. The number of tenants seeking space in this market has increased 83% since last year. Notable new tenants include Thrive Sciences, Zymergen, Scorpion Therapeutics, and EQRX. The largest tenants in the market include Pfizer Inc, Novartis, TESARO, Sanofi, AbbVie, Thermo Fisher Scientific, and Amgen. Total employment in this market grew 7.7% from 2018 to 2019. This cluster secured $1.9B in VC funding for Q2 2020, the most since 1995. This cluster also secured $2.5B in NIH funding for 2019, the largest of any market. The majority of NIH funding in the market goes to Massachusetts General Hospital, Brigham and Women’s Hospital, and Harvard Medical School. As of Q2 2020, there is 4.3M sq. ft. of new lab space under construction. Core submarkets include Cambridge, Boston, Route 12B, and Route 495. Osborn Triangle sold in 2019 at for $1.1B ($1,625 per square foot) at a 4.3% cap rate – main tenants include Pfizer, Novartis, and Lab Central. 1030 Mass Avenue sold for $128M ($1,707 per square foot) at a 4.5% cap rate – main tenants include Astellas, Mitobridge, Obsidian TX, and Potenza TX. Top owners in the market are Alexandria, BioMed Realty, and Healthpeak Properties.
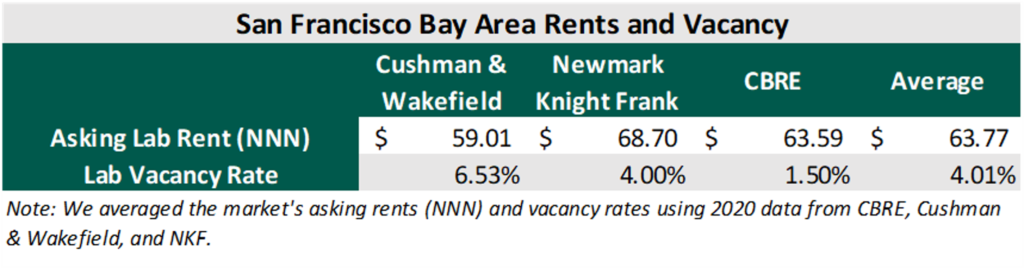
The San Francisco Bay area is a well-established life sciences cluster but has higher barriers to entry for investors because of the market’s uniqueness (significant competition for space and talent with tech companies). According to NKF, the average TIs are $150/SF over a lab ready shell. Submarkets within this cluster include Mission Bay, South San Francisco, Emeryville, San Carlos, Hayward, and Palo Alto. The top institutions in the area include Stanford, UCSF, and UC Berkeley. The largest tenants are AbbVie, Gilead Sciences, Pfizer, and Genentech/Roche. A lack of availability of lab space in San Francisco County has led to robust demand in surrounding markets. The area received $1.6B in NIH funding for 2019. For Q1 2020, the area received attracted $2.1B in VC funding, more than any other market. There is 4.2M sq. ft. of lab space under construction. Bayshore Tech Park (995,757sf) sold in 2019 as part of a portfolio sale for $323.4M at a 5.2% cap rate. 500 Forbes Blvd (155,685sf) sold in 2019 for $155M at a 4.0% cap rate. 7000 Marina Blvd (90,000sf) sold in 2019 for $77M at a 4.4% cap rate.
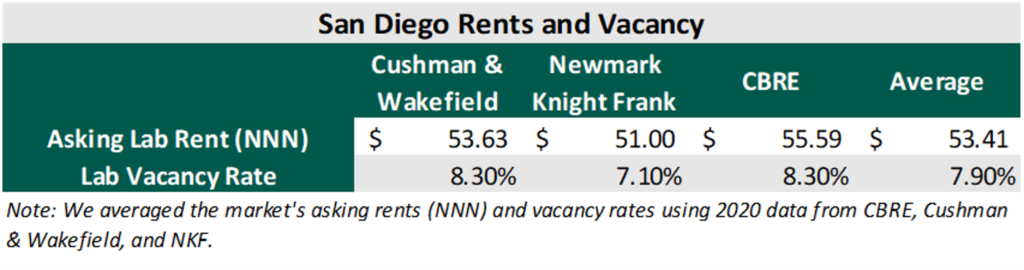
San Diego is a rapidly evolving cluster that is growing in popularity in part because of its access to talent and strong anchors such as Illumina and Scripps Research. Submarkets in San Diego include Torrey Pines, UTC, Sorrento Mesa, and Sorrento Valley. The highest rents are in Torrey Pines. According to NKF, the average TIs for this market are $200/SF on top of base building work delivered by landlord. The region has experienced five consecutive years of positive net absorption. New construction is estimated to be 736,000 sq. ft., which is modest compared to San Francisco and Boston-Cambridge. The area’s employment has increased 5.2% between 2018 and 2019. The market received $887M in NIH funding for 2019. The majority of NIH funding went to U.C. San Diego, Scripps, and Salk Institute for Biological Studies. San Diego attracted $796M in VC funding for Q2 2020 alone.
Conclusions and Takeaways
In conclusion, the life science industry is in a period of expansion and long-term growth prospects remain strong. Prior to the COVID-19 pandemic, life sciences real estate was a highly favorable asset in primary clusters like Boston-Cambridge, San Francisco Bay area and San Diego, achieving some of the lowest vacancy rates in the country, coupled with record high office rents. The growing demand in primary clusters has led to expansion into other areas in the country that exhibit a strong talent pool and mix of research and hospital institutions, such as the Research Triangle in Raleigh, University City in Philadelphia, New Jersey, and New York City. Similarly, Seattle and Los Angeles on the West Coast are emerging as clusters for life sciences due to the presence of tech companies, tech talent, and highly ranked STEM universities.[51] Life science employment, investment, growth, and investor awareness are at all-time highs. Tenant demand for high quality lab space remains robust in most markets nationally. Cap rates for these facilities remain low. Increased investor attention to the sector and the continued flow of capital should combine with the industry’s strong market fundamentals to fuel continued growth, both during and after COVID-19.
As investors, operators, and lenders evaluate acquisitions or new developments within the sector, proper underwriting and benchmarking is critical to evaluate risk and properly structure equity transactions or debt issuances. An FMV opinion that considers the value of the real estate in the context of a going concern, as well as in a potential “as vacant” scenario, is an important component of diligence and risk analysis. VMG’s valuation & advisory team is well-equipped to offer life sciences clients a variety of services, including quality of earnings, appraisals, operational benchmarking, and more. As the industry continues to grow and adapt to the post-pandemic economy, VMG will continue to closely monitor changes within this dynamic market sector.
Sources:
[1] Anderson, Ian et al., CBRE 2020 Life Science Report, CBRE U.S Life Sciences (October 2020).
[2] Assistant Secretary for Public Affairs., “Fact Sheet: Explaining Operation Warp Speed.” U.S. Department of Health & Human Services, November 20, 2020, https://www.hhs.gov/coronavirus/explaining-operation-warp-speed/index.html
[3] Bisconti, Greg et al., Cushman & Wakefield Life Sciences 2020: The Future is Here, Cushman & Wakefield U.S. Research Insights, Retrieved: November 30, 2020, https://www.cushmanwakefield.com/en/united-states/insights/life-science-report
[4] Id.
[5] Id.
[6] Id.
[7] World Bank, Population ages 65 and above for the United States [SPPOP65UPTOZSUSA], retrieved from FRED, Federal Reserve Bank of St. Louis; https://fred.stlouisfed.org/series/SPPOP65UPTOZSUSA, December 7, 2020.
[8] Id.
[9] Anderson, Ian et al., CBRE 2020 Life Science Report, CBRE U.S Life Sciences (October 2020).
[10] Bisconti, Greg et al., Cushman & Wakefield Life Sciences 2020: The Future is Here, Cushman & Wakefield U.S. Research Insights, Retrieved: November 30, 2020, https://www.cushmanwakefield.com/en/united-states/insights/life-science-report
[11] Id.
[12] Id.
[13] Anderson, Ian et al., CBRE 2020 Life Science Report, CBRE U.S Life Sciences (October 2020).
[14] Id.
[15] Richardson, Todd et al., CBRE 2019 Life Sciences Clusters Report, CBRE U.S. Life Sciences (February 2019)
[16] Bisconti, Greg et al., Cushman & Wakefield Life Sciences 2020: The Future is Here, Cushman & Wakefield U.S. Research Insights, Retrieved: November 30, 2020, https://www.cushmanwakefield.com/en/united-states/insights/life-science-report
[17] Id.
[18] Id.
[19] Anderson, Ian et al., CBRE 2020 Life Science Report, CBRE U.S Life Sciences (October 2020).
[20] “Life Sciences: Alan Gold, Executive Chairman of IQHQ.” Leading Voices in Real Estate with Matt Slepin, (November 2020), https://leadingvoicespodcast.com/alan-gold/
[21] Mugford, John., It’s boom time for life science real estate, Healthcare Real Estate Insights (November 2020), http://wolfmediausa.com/2020/11/24/feature-story-its-boom-time-for-life-science-real-estate/
[22] Anderson, Ian et al., CBRE 2020 Life Science Report, CBRE U.S Life Sciences (October 2020).
[23] Anderson, Ian et al., Key Insights: CBRE 2020 Life Science Report, CBRE U.S. Life Sciences (October 2020) https://www.cbre.us/research-and-reports/US-Life-Sciences-Report-2020
[24] Reh, Greg., 2020 Global Life Sciences Outlook, Deloitte Insights 2020, Retrieved: December 2, 2020, https://www2.deloitte.com/global/en/pages/life-sciences-and-healthcare/articles/global-life-sciences-sector-outlook.html
[25] Id.
[26] Id.
[27] Anderson, Ian et al., CBRE 2020 Life Science Report, CBRE U.S Life Sciences (October 2020).
[28] Reh, Greg., 2020 Global Life Sciences Outlook, Deloitte Insights 2020, Retrieved: December 2, 2020, https://www2.deloitte.com/global/en/pages/life-sciences-and-healthcare/articles/global-life-sciences-sector-outlook.html
[29] Griner, Greg et al., Orrick’s Life Sciences Snapshot: A Quarterly Report on Financing Trends in Q3 2020 – Venture Surges and the Rise of SPACS, Orrick Life Sciences Insights (October 2020). https://www.orrick.com/en/Insights/2020/10/Life-Sciences-Snapshot-A-Quarterly-Report-on-Financing-Trends-Q3-2020
[30] Kuhn, James et al., 2020 Life Sciences National Overview and Top Market Clusters, Newmark Knight Frank Research Insights (June 2020). https://www.ngkf.com/insights/thought-leadership/2020-life-sciences-national-overview-and-top-market-clusters
[31] Id.
[32] Id.
[33] Id.
[34] Symes, Audrey, and David Coffman. 2020 U.S. Life Sciences Real Estate Outlook, JLL Research (April 2020). https://www.us.jll.com/en/trends-and-insights/research/life-sciences-real-estate-outlook
[35] Id.
[36] Bisconti, Greg et al., Cushman & Wakefield Life Sciences 2020: The Future is Here, Cushman & Wakefield U.S. Research Insights, Retrieved: November 30, 2020, https://www.cushmanwakefield.com/en/united-states/insights/life-science-report
[37] Id.
[38] Symes, Audrey, and David Coffman. 2020 U.S. Life Sciences Real Estate Outlook, JLL Research (April 2020). https://www.us.jll.com/en/trends-and-insights/research/life-sciences-real-estate-outlook
[39] Alexandria Real Estate Equities Inc (ARE). Q2 2020 Earnings Call Transcript for the period ending June 30, 2020. https://www.fool.com/earnings/call-transcripts/2020/07/28/alexandria-real-estate-equities-inc-are-q2-2020-ea.aspx
[40] Id.
[41] Id.
[42] Anderson, Ian et al., Key Insights: CBRE 2020 Life Science Report, CBRE U.S. Life Sciences (October 2020) https://www.cbre.us/research-and-reports/US-Life-Sciences-Report-2020
[43] Id.
[44] Id.
[45] Anderson, Ian et al., CBRE 2020 Life Science Report, CBRE U.S Life Sciences (October 2020).
[46] Id.
[47] Id.
[48] Id.
[49] Id.
[50] Bisconti, Greg et al., Cushman & Wakefield Life Sciences 2020: The Future is Here, Cushman & Wakefield U.S. Research Insights, Retrieved: November 30, 2020, https://www.cushmanwakefield.com/en/united-states/insights/life-science-report
[51] Kuhn, James et al., 2020 Life Sciences National Overview and Top Market Clusters, Newmark Knight Frank Research Insights (June 2020). https://www.ngkf.com/insights/thought-leadership/2020-life-sciences-national-overview-and-top-market-clusters
3 Major Themes from Public Healthcare Firms during the Third Quarter of 2020 – Part 1: Patient Volume
December 9, 2020
Contributors: Savanna Dinkel, Blake Madden and Keith Ponsler
As the healthcare sector continues to operate affected by the coronavirus (“COVID-19”) pandemic, insights and experiences from the provider sector are particularly interesting.
In a three-part series over the coming weeks, VMG will summarize key observations and common themes from public healthcare firms on the following topics:
- Part 1: COVID-19’s lingering impact on payor and provider volumes;
- Part 2: expense management and cost savings; and
- Part 3: understanding the impact to the mergers and acquisitions market.
Part 1: COVID-19’s Lingering Impact on Volume
Payors: Continued Return of Medical Costs in the second half of 2020
With decreased patient demand for healthcare services in Q1 2020 and historically low medical cost ratios in Q2 2020, payors’ earnings were significantly higher in the first half of the year due to temporary care deferrals. Patients who missed treatments during the first half of the year continued to return to the healthcare system during Q3, and payors, such as UnitedHealthcare, experienced lingering effects from the pandemic due to ongoing disruptive patient patterns:
“Broadly speaking, third-quarter results continued to be impacted by disruptive care pattern, albeit to a much lesser extent than in the second quarter as many regions of the country stabilized nearer to more normalized level. Within the quarter, care deferral impacts were more than offset by the proactive consumer and customer assistance measures we voluntarily undertook earlier this year as well as COVID-19 care and testing costs and broader economic effects. These factors resulted in a 10% year-over-year decline in adjusted earnings per share.”
John F. Rex, Executive VP & CFO, UnitedHealthcare Q3 2020 Earnings Call Transcript
Providers: Volumes Continue to Recover
During Q3, COVID-19 restrictions lifted significantly, and healthcare activity trended toward a return to normalcy. Providers were still faced with an array of challenges as they continued to adjust to shifts in operations and protocols to accommodate a continuously changing COVID-19 world.
In Q3, providers benefited from a return of elective surgeries as backlogs for outpatient surgeries continued to grow. In addition to the steady demand, providers consistently noted the severe initial disruption within the patient referral and admission patterns seen in the second quarter has noticeably dissipated throughout the third quarter.
Finally, as COVID-19 cases appeared to stabilize during Q3, providers are cautiously optimistic about continued volume growth in light of another surge in COVID-19 cases among certain markets.
Hospitals
“On June recovery, by the way, certainly benefited from a great deal of pent-up demand. We were very focused on getting that business in the door. And we did see some shifting or deferrals in July into August. But as the COVID surge subsided and as we expected, we saw more elective cases come back into the hospital … In terms of heading into October, September was a good month. Heading into October, we’re pleased with the further progression of our volume recovery. We are, as we pointed out today, seeing some resurgence of COVID and haven’t necessarily seen any requirements for shutdowns or curtailing elective services that we’re monitoring on a day-by-day basis.”
Tim L. Hingtgen, President, COO & Director, Community Health Systems Q3 2020 Earnings Call Transcript
“Despite the COVID-19 case surge, which was about 60%-plus in late July and August compared to the second quarter across our system, we delivered a solid performance in every part of our business. While we experienced a surge, we safely handled caring for COVID and non-COVID patients.”
“In the hospitals, volumes for the quarter ended close to 90% at pre-COVID levels. This is continuing to be a solid recovery during the time period and remains very positive. Our operators across our markets have responded very well given the nature of the complexities of the pandemic, and we continue to perform tightly aligned to the volumes presented.”
Ronald A. Rittenmeyer, Executive Chairman & CEO, Tenet Healthcare Q3 2020 Earnings Call Transcript
Post-Acute Care
“While total discharges were down 1.5% compared to the third quarter of 2019, this number improved significantly from the 10.7% decrease in volumes we experienced in the second quarter of 2020. The remaining lag to returning to prior year volumes primarily is related to orthopedic and lower extremity joint replacement cases. Many of our markets continue to have limited elective surgeries, particularly with elderly patients with complex medical conditions. These patients are the ones that tend to need inpatient rehabilitative services post-surgery… We also continue to experience COVID-related challenges in certain geographic markets, specifically Florida, where we have 12 inpatient rehabilitation hospitals. We experienced a 12.8% year-over-year decline in patient discharges in Florida in the third quarter of 2020.”
“Factors that have impacted our volumes include the number of COVID-19 cases in a community, the status of operations at acute care hospitals, the number of exposed or positive staff in quarantine, delays in obtaining COVID-19 test results for patients and employees and capacity limitations created by semi-private rooms in some of our hospitals. While COVID patients do not comprise a large percentage of our patients, many of our hospitals, home health agencies and hospice agencies treat patients recovering from the virus. These patients, many of whom have spent time on ventilators, had endured extended stays at an acute care hospital. They are extremely weak and require intense rehabilitation to regain both their strength and cognitive abilities.”
Mark Tarr, Executive VP & CEO, Encompass Health Corporation Q3 2020 Earnings Call Transcript
“In home health admissions, we are close to where we were pre-COVID. And in hospice, we are in line with pre-COVID levels already … sequentially, we are up 13.1% in home health same-store admissions in Q3 from Q2. And in hospice, we’re up 8.3%.”
Joshua L. Proffitt, President, LHC Group Q3 2020 Earnings Call Transcript
Imaging
“First of all, I think it should be understood that [while] volumes even have come back substantially to the pre-COVID levels, I believe that there will be a number of people who still remain reluctant to come out for visitation to access not just health care, and I believe that will stay that way for probably well into 2021.”
“Somewhere in the mix there, I think you put it into the factors like Cigna and other health insurers are continuing to make major strides or efforts to directing people away from hospitals. And people themselves perhaps now look at outpatient ancillary services, particularly imaging in a little bit more of a rational way, given the fact that they were not to have to go into the environment of a hospital. I think all of those factors have weighed in and will continue to improve for us, particularly going to be a better half in the coming months.”
Howard G. Berger, Chairman, President, CEO & Treasurer, RadNet Q3 2020 Earnings Call Transcript
Outpatient Care
“Our same-facility volumes for the quarter averaged 97% of the prior year, and in the month of September, we achieved 99% of prior year volumes, our best results since the beginning of the pandemic. We continue to see higher acuity cases, such as orthopedic and spine surgeries, exceeding prior year levels, while the recovery of lower acuity cases, such as GI, continue to slightly lag, with results in the low 90s percentile of prior year volume for the quarter.”
Eric Evans, CEO & Director, Surgery Partners Q3 2020 Earnings Call Transcript
“With respect to volume, given the unusual volatility we have seen in 2020 with COVID-19 surges, mandatory and voluntary suspension of elective business and intermittent recovery periods, we currently plan to use 2019 volumes as a starting reference point for early 2021 planning purposes.”
Samuel N. Hazen, CEO & Director, HCA Healthcare Q3 2020 Earnings Call Transcript
Behavioral Health
“Overall, in the acute area, we saw a very robust volume, and it’s far exceeding where we were last year, and certainly, pre-COVID…. we’ve continued to see improvement in the census in both the U.S. and the U.K., and I think we actually hit the highest census in the history of Acadia in October.”
“For our specialty service line, we were pleased to see stabilization in our volumes. By shifting our marketing strategies to focus on local and regional markets, we were able to reach those that need the very specialized services that we provide. During the quarter, we also saw a sequential improvement in our out-of-state referrals due to patients being more willing to travel. However, we’ve not yet seen our referrals return to prior year levels.”
Debra K. Osteen, CEO & Director, Acadia Healthcare Company Q3 Earnings Call Transcript
Real Estate
“Our hospitals are all back to essentially normal operations. They range from low 90s to over 100% of where they were in 2019. When COVID first hit, hospital operators across our portfolio did a fantastic job of cutting expenses and streamlining operations. All of our operators have strong liquidity positions and all are looking forward to new opportunities. As predicted, the backlog of nonemergency surgeries has pushed surgical volumes back to pre-COVID-19 levels at many of our hospitals and some even ahead of budgeted and prior year numbers. For instance, our hospitals in Spain have seen an increase in outpatient and surgical volumes as the backlog at the public hospitals has forced them to redirect patients to our private hospitals. This has created a fortuitous opportunity for our Spanish operators as these patients experience firsthand, the top-notch facilities and care provided at these private hospitals.”
Edward K. Aldag, Founder, Chairman, President & CEO, Medical Properties Trust, Inc. Q3 2020 Earnings Call Transcript
The Road Back to Normalcy
Operators saw much improvement in Q3 from a quarter impacted by the month-long shutdown in April. Many executives noted strong volume trends by September and were encouraged by early October results. Providers remain cautiously optimistic about a continued ramp-up in volume as long as COVID-19 diagnoses remain stable. Due to the continued uncertainty, the sector is still not providing fiscal year 2021 guidance, but hopes these positive volume trends will remain intact as healthcare continues to battle the pandemic and move forward on the road back to normalcy.
Categories:
Reimbursement Pressure in Radiation Therapy & Block Lease Arrangements
December 8, 2020
Written by David Lamonte, CFA
The finalized Radiation Oncology payment model and the Final CY 2021 Medicare Physician Fee Schedule (“MPFS”) have now been made public. Many in the industry will continue to face downward pressure on reimbursement during the coming year under the new MPFS payment rates set by Medicare which will drive overall cuts estimated to average 5.0% for all Medicare revenues.
Many in the industry have indicated the effect of these cuts could result in less availability of treatment options to patients as those providers at the margins experience further pressure on profitability. Block Lease Arrangements are one form of loose consolidation among providers which can offer a solution to the contracting reimbursement and rising costs seen by many. A block lease is formed when a provider leases certain services or assets for a defined “block” of time to the lessee who retains exclusive use of these items during the time the block lease is in effect.
Evolution of Reimbursement for Radiation Therapy
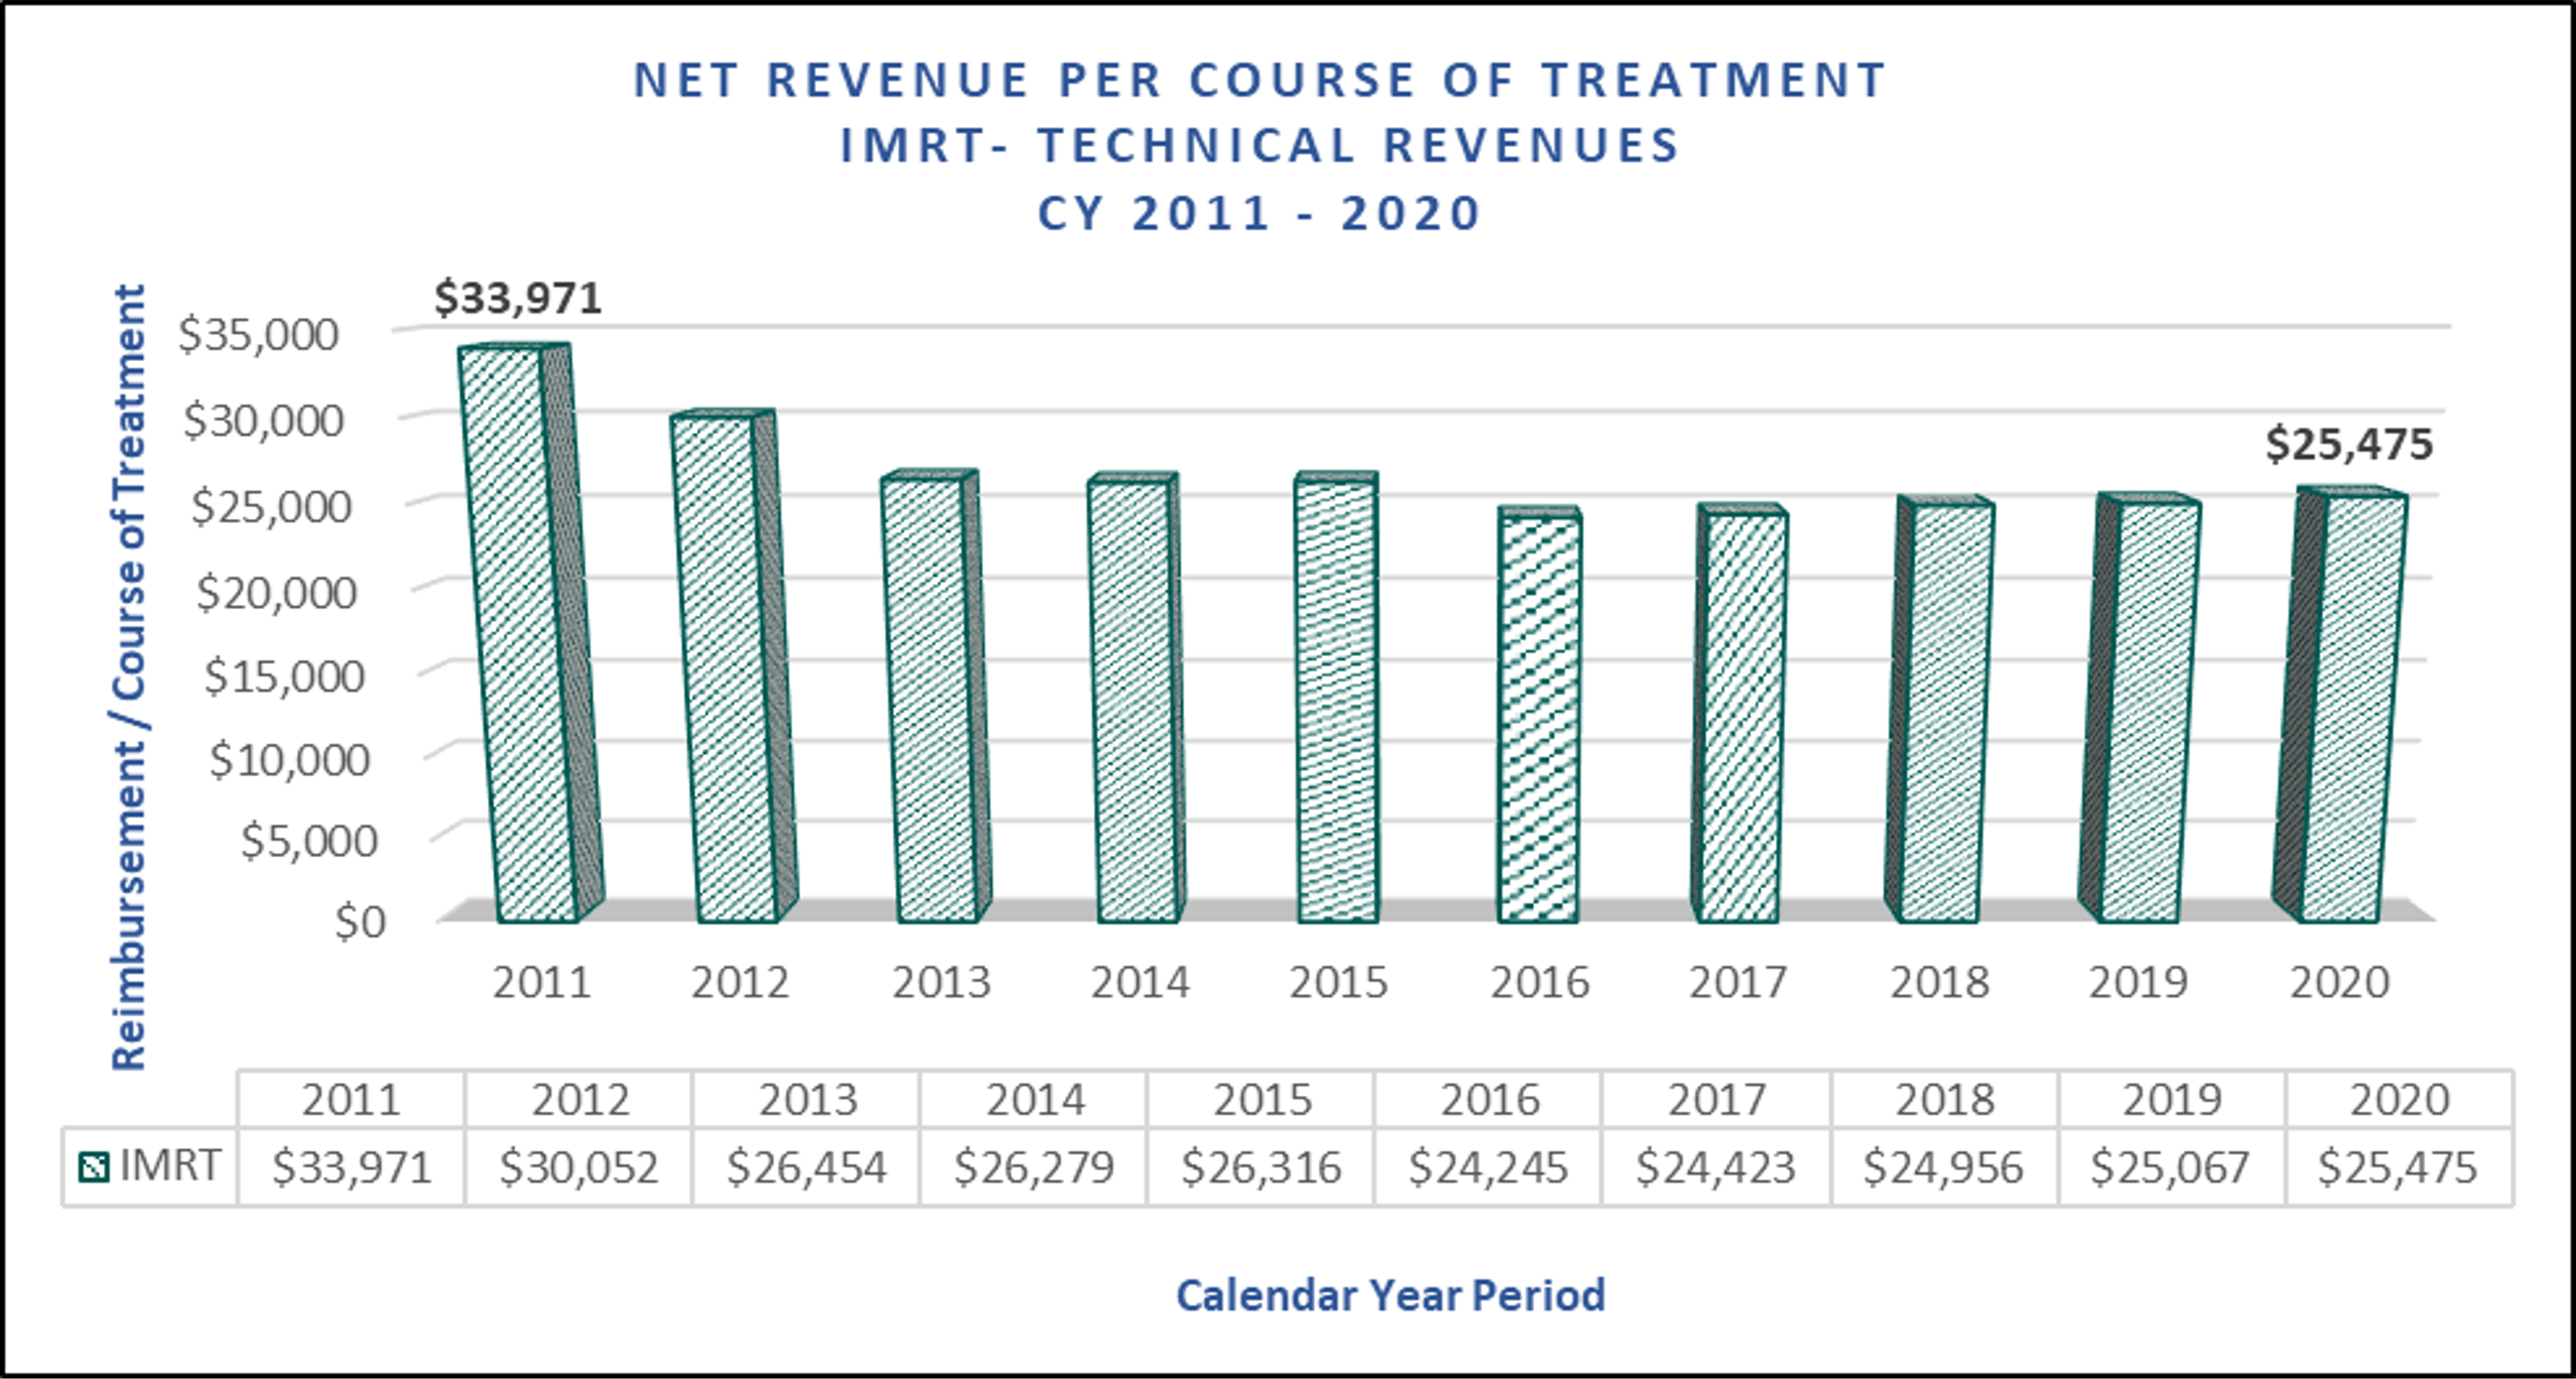
- Based on the product of the number of CPT units billed during a standard course of treatment requiring IMRT treatments multiplied by CMS’ technical reimbursement for these services in each year presented above.
- Does not consider impact of alternative payment models, non-Medicare, non-technical portions, or non-IMRT reimbursement.
It is informative to first understand where many providers stand today, before the CY 2021 reimbursement cuts take effect. The chart above provides a ten-year review of aggregate payment rates for a typical patient’s course of IMRT radiation therapy treatment. As can be seen, the Reimbursement trends during the past decade have not been highly favorable for Radiation Therapy Centers with a heavy reliance on Medicare payments and trends have been even less favorable to those that are primarily providing IMRT-based treatment options. The decade began with consecutive years of reimbursement cuts for IMRT procedures between 2011 – 2015. This would be followed by payment cuts occurring initiated in the CY 2016 MPFS as CMS made a permanent adjustment to the Equipment Utilization Rate (“EUR”) assumed for Linear Accelerators. This EUR is one of the key variables used in a specific formula by CMS to determine the level of payment for all providers using a given type of equipment and it’s increase, which was initially proposed to be shifted from 50% EUR to 75% EUR, would settle at 60% EUR, but still created a downward impact to reimbursement for radiation therapy providers. Since this time, payment rates for many radiation therapy procedures have been stagnant as a result of budget neutrality adjustments.
The overall impact of the reimbursement changes noted above caused the average total payment rates for IMRT-based treatment plans to decline by nearly $10,000 per course of treatment from $33,971 in 2011 to $25,475 in 2020. Providers with a large Medicare patient base which had entered the 2010’s with healthy profit margins have had to continually manage costs in order to navigate the last ten years successfully.
Capital Requirements in Radiation Therapy
Radiation Therapy businesses may be driven towards Block Lease Arrangements out of necessity as Radiation Therapy Centers are among the most capital intensive healthcare businesses and operational/start-up costs to open and begin operating this type of business are significantly outside the affordability of many aspiring owners without a substantial level of debt.
The most significant purchase or up-front cost for a particular radiation therapy facility is often the linear accelerator, as this is the primary equipment around which most free-standing radiation therapy businesses are built. The market for used linear accelerators has proliferated alongside a market for used parts, however, which often can be sources of much lower costs if contemplating a purchase. CMS recently shared their own survey data which would be used in the 2020 work RVU calculations utilized to determine reimbursement for procedures using linear accelerators. Responders indicated that they had spent an average of $2.82 million for a linear accelerator providing IMRT treatments.
There are other costs that must also usually be considered, however, such as CT Scanners used in CT Simulation, which can very quickly bring the price of equipment up as well. Last, and possibly most importantly, is the vault in which the accelerator is operated. The cost vary widely and will depend on what level of construction is necessary, but can easily reach into the hundreds of thousands for space and shielding for a single linear accelerator. This type of structure makes it difficult to move to any alternative location and though it is not necessarily the most costly investment, it can make changing locations more complicated than it would be for other types of businesses.
These initial start-up and equipment costs motivate both parties to move towards an agreement such as a Block Lease Arrangement. The Lessor may need additional sources of income to pay off the original debts incurred during the initial start-up phase. At the same time, the Lessee is driven by a desire to potentially avoid these same costs.
Block Lease Arrangements Explained
The schematic below provides an example of how a typical arrangement may be organized between lessee and lessors.
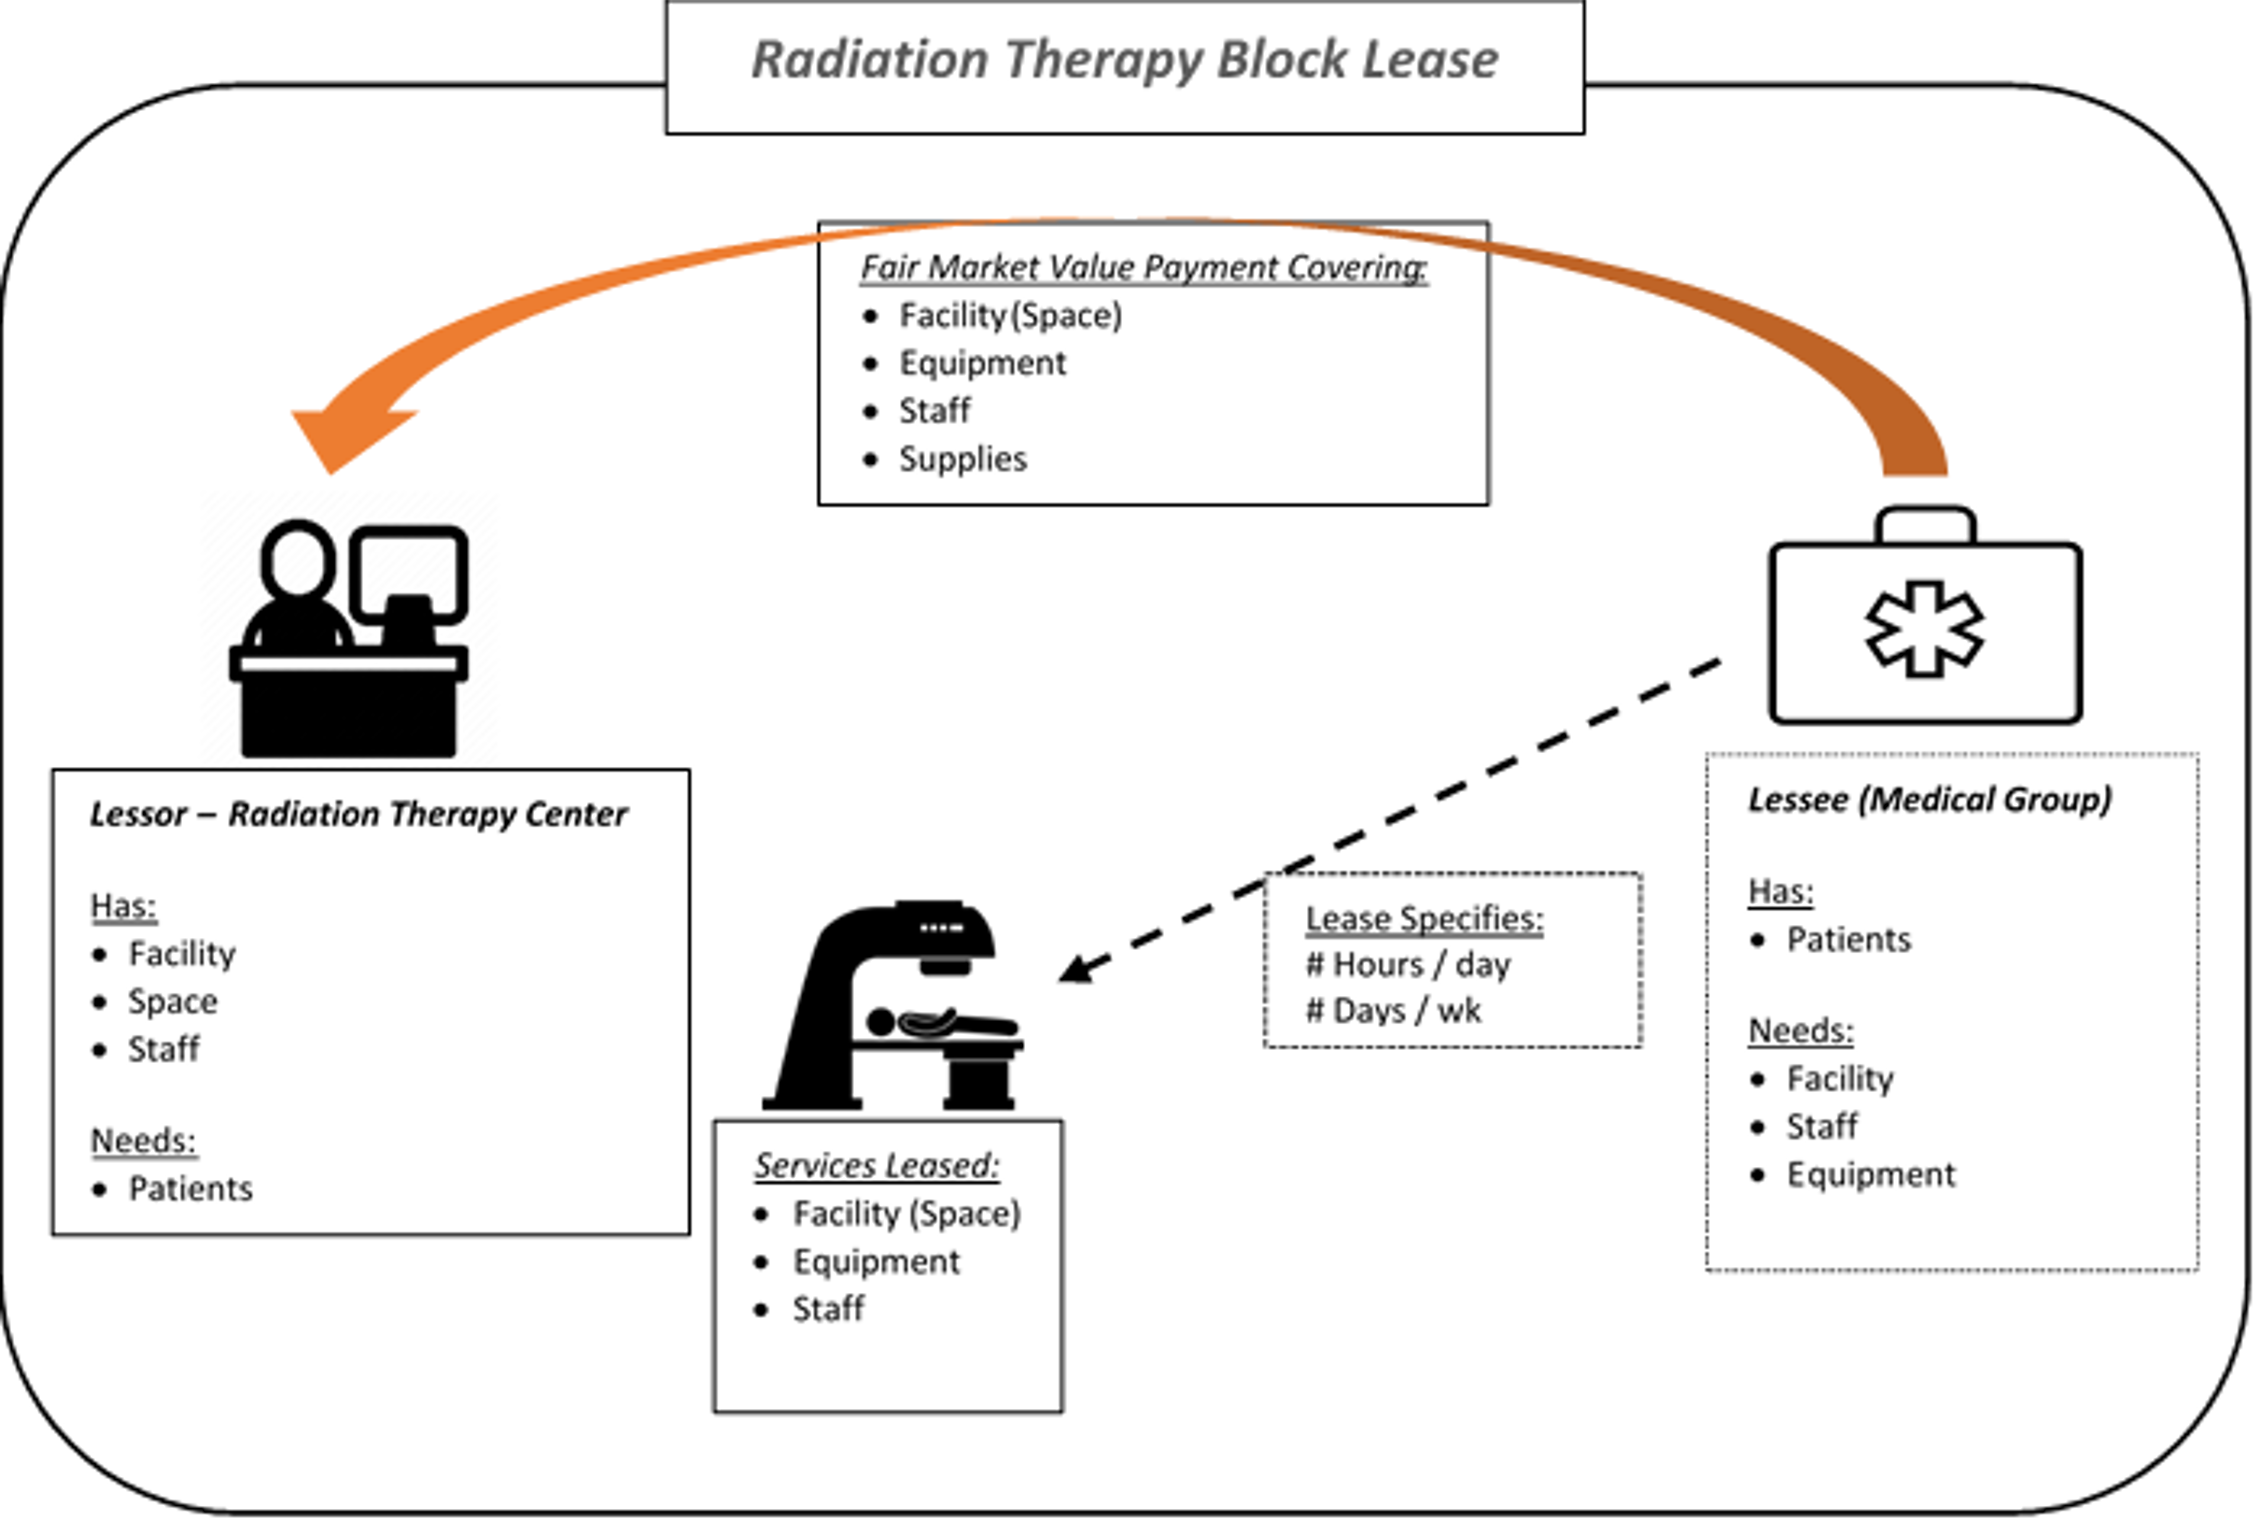
Block Lease arrangements are a less-aligned form of cooperation than an outright Joint Venture or practice acquisition with physician employment, however, they can generally achieve similar objectives for all participants involved. Within Radiation Therapy specifically, Block Leases involve owners of existing Radiation Therapy Centers (in this arrangement the “Lessor”) entering into an arrangement with outside providers such as a medical oncology group or other specialist group (the “Lessee”). Typically the Block Lease provides that facilities, personnel, and equipment are leased, supplies are provided, and the lessor continues to bill and collect on behalf of the lessee.
Depending on the legal / regulatory environment and the reimbursement environment, Block Lease Arrangements may provide a mutually beneficial solution to difficulties faced by each party while continuing to deliver quality and cost-efficient treatment services to the patients receiving care.
Block Lease Arrangements and Fair Market Value
Block leases may not always be referred to as a “Block Lease” and each can often be tailored to a specific situation or need but these agreements will generally involve the sub-lease of an existing radiation therapy operation to a third-party at a pre-determined rate, consistent with Fair Market Value. For regulatory purposes, the rate is always quoted in an official agreement on a per hour, or per unit of time basis and never on a per treatment basis. As noted previously, legal counsel should review structure for compliance with all laws and regulations.
The process of determining the Fair Market Value block lease rate begins with identifying the particular components that will be leased by the owner of the Radiation Therapy business to a third party. Most often, these components include equipment, facility space, non-physician staff, supplies, and other specified administrative and management functions which the lessor provides while the block lease is in effect. For a certain pre-defined time period, the third party will be utilizing each of these components and therefore, the third party must be charged for their use at a Fair Market Value rate.
These cost inputs used to calculate an overall FMV rate are individually built up and typically this is done using the actual cost historically incurred by the lessor. As is shown in the below diagram for staff costs, the build up accounts for the specific FTE wages and benefits to be included in the lease.
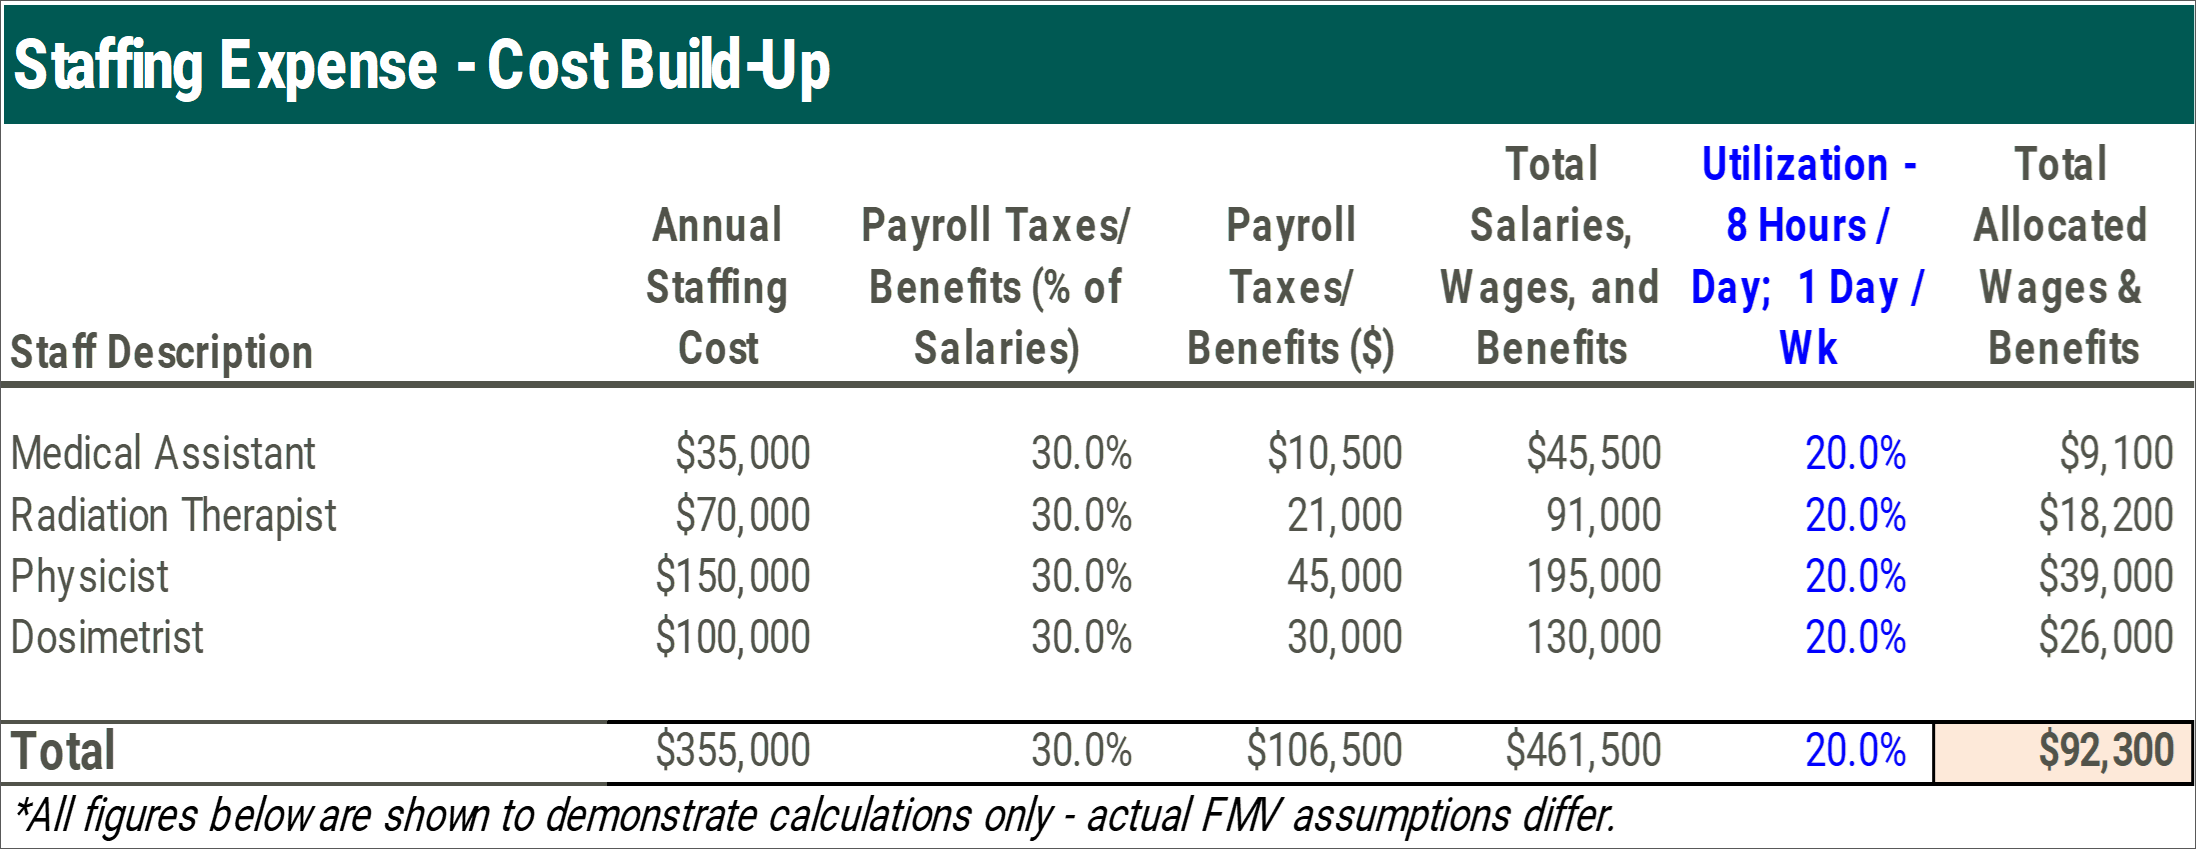
A key adjustment made in each cost build up is the utilization assumption, which takes into account the proportion of time that a particular cost is to be used by the lessee relative to the overall time which the cost is used. The above utilization rate of 20% would be consistent with a block lease in effect once a week for eight hours each day if the staff works a 40 hour, 5 day work week.
One of the primary components central to the block lease rate is the portion associated with the actual Radiation Therapy equipment which will be used in the block lease arrangement. The equipment is typically valued using an applicable fixed asset listing and equipment detail with consideration of equipment age, remaining life, make, and model. Equipment values are then used to estimate an annual lease rate applicable to the leased equipment. This lease rate is then adjusted for the utilization percentage for the Block Lease.
Facility or Space Costs are often estimated using allocation of costs stated in existing lease agreements and all other administrative or management costs applicable can be determined by identifying actual historical costs incurred by the current operator using available financial statements, management estimates, or contractual terms.
The chart below illustrates an overall cost build-up conclusion where each service provided by the lessor in a Block Lease is individually calculated based on the allocation of costs to provide the service. Adjustments are then applied to the base cost where a Mark-Up is appropriate. These mark-ups are not reflective of Fair Market Value and are presented for calculation purposes only. The sum of all costs with mark-ups is then used as a basis for the Cost Approach to determining Fair Market Value of a particular arrangement, which is then quoted in a range.
One important item not calculated or utilized to build up the costs below is the volume under the arrangement. These agreements should never be valued using a formula driven by expected patient treatment volumes or revenue for compliance purposes.
As the number of cancer patients continues to rise in the United States and Radiation Therapy continues to grow as a form of treatment, and further, as the regulatory and CMS reimbursement structure continues to evolve into the 2020’s, there will continue to be new types of arrangements that creatively address the issues faced by operators.
Sources:
- REPORT TO CONGRESS: Episodic Alternative Payment Model for Radiation Therapy Services (https://innovation.cms.gov/files/reports/radiationtherapy-apm-rtc.pdf)
- Linear Accelerator (LINAC) Price Guide & Costs(https://www.oncologysystems.com/resources/linear-accSelerator-guides/used-linac-price).
- ONCOLOGISTHOSPITALALIGNMENT (http://www.ccbdgroup.com/alignment2014.pdf)
- Finalized Policy, Payment, and Quality Provisions Changes to the Medicare Physician Fee Schedule for Calendar Year 2020 (https://www.cms.gov/newsroom/fact-sheets/final-policy-payment-and-quality-provisions-changes-medicare-physician-fee-schedule-calendar-year-1).
- CMS & Revenue Cycle Inc.
- org – 2021 MPFS final rule, E/M webinar today, PRO reviewer apprenticeships (https://www.astro.org/News-and-Publications/ASTROgram/2020/December-2020/ASTROgram_120220#:~:text=Yesterday%2C%20the%20Centers%20for%20Medicare,payments%20effective%20January %201%2C%202021.&text=For%20more%20information%20from%20CMS%2C%20see%20their%20final%20rule%20fact%20sheet)
- STARK AND MEDICARE’S PHYSICIAN REIMBURSEMENT RULES: UNRAVELING THE KNOTS https://www.gosfield.com/images/PDF/AGG.Stark_and_Reimb.PrePub_Draft.v2.011615.pdf