When it comes to compensating physicians for clinical-based services, hospitals have several choices. For the past several years, the work relative value unit (RVU) model has stood out as the model of choice. The basic premise of the model is to align physician effort (as measured by work RVU productivity) with compensation levels through use of independent compensation surveys. As an example, if a physician’s work RVUs are approximately the median of published survey data, then the physician’s compensation would be set at the median.
Physicians may prefer this model as it allows a physician to be compensated for services rendered regardless of a patient’s ability to pay. In a collections-based model, physicians are not incentivized to treat uninsured or underinsured patients. Hospitals may prefer the work RVU compensation model as it allows a hospital to compensate an employed or contracted physician for services rendered to unassigned patients which may further the hospital’s ability to serve the local community.
As with any compensation model, it is important for the builder to understand the nuances of the model to avoid possible misapplication. The following paragraphs outline issues that are common when constructing and assessing the fair market value (FMV) of a physician work RVU compensation model.
Understand the Difference between Work RVUs and Total RVUs
Work RVUs measure the specific time and effort of a physician for providing a specific service. In contrast, the total RVU measures not only a physician’s work effort, but also the cost of a physician’s malpractice insurance and practice overhead. Logically, a total RVU is larger than a work RVU. Compensation surveys will report both RVU types. As an example, the 2013 MGMA Physician Compensation and Production Survey reports median total RVUs for an internal medicine physician at 9,104 and median work RVUs at 4,705. Obviously, benchmarking work RVUs to total RVU survey data (or vice versa) would lead to inaccurate results. Therefore, it is imperative that the designer of the compensation model understand the difference and rely on one or the other. As a final note to this section, although total RVUs can be used in a physician compensation model, the predominant metric observed by VMG is the physician work RVU.
Adjust Work RVUs for Modifiers
In general, modifiers indicate that the typical services assumed f or a particular CPT code have been modified. For example, a modifier of “80″ attached to a surgical code would indicate that the surgeon assisted another surgeon with the procedure. In this case, the assisting surgeon generally will receive 16% of typical reimbursement for the assist. The compensation surveys request that respondents adjust work RVUs to account for modifiers. Going back to the example, the associated work RVUs would be adjusted to reflect 16% of the work RVU value for the CPT code. If a compensation model does not adjust the physician’s work RVUs for the impact of modifiers, the resulting compensation levels could be overstated.
Understand the Reported Compensation per Work RVU Data
Many of the published physician compensation surveys report the effective compensation rate per work RVU of the respondents. Logically, one would think that a physician with a high level of work RVUs should be compensated at a rate per work RVU reported at the upper percentiles. However, this approach can lead to results that could fall outside of a FMV range. Consider the following information from the 2013 MGMA Physician Compensation and Production Survey for interventional cardiology:
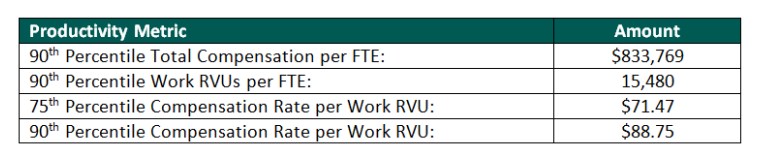
It is important to note again that the basic premise of the work RVU model aligns productivity with total compensation. If a cardiologist producing at the 90th percentile of work RVUs (or 15,480) is paid at the 75th percentile reported compensation rate per work RVU ($71.47), total compensation paid would equal $1,106,356. This compensation amount is 32.7% greater than the 90th percentile of reported compensation. If the same physician is instead paid a compensation rate per work RVU at the 90th percentile, total compensation paid would equal $1,373,850 which is 64.8% greater than the 90th percentile of reported compensation. Clearly, paying a highly productive physician a compensation rate per work RVU at the upper percentiles of reported survey data results in compensation that is not aligned with simple work RVU productivity.
Additionally, a closer look at the survey data illustrates that although a physician may be more productive, the earned compensation rate per work RVU at the upper percentiles does not necessarily increase substantially (if at all) above the reported median compensation rate per work RVU. Consider the following information for interventional cardiology from the 2013 MGMA Physician Compensation and Production Survey:
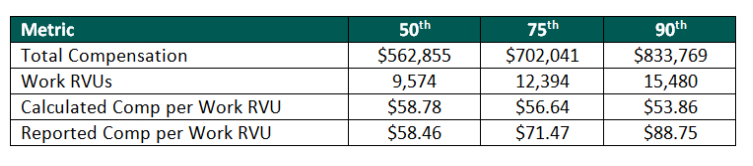
To further understand the reported compensation per work RVU percentiles, it is important to understand how the data is reported. Specifically, the total compensation f or each physician respondent is divided by his/her work RVUs. Therefore, a new physician with a small but growing practice may be paid a guaranteed salary at the 75th percentile but only have work RVUs at the 25th percentile. The resulting compensation rate per work RVU in this example would f all significantly above the rate calculated for similar physicians with mature practices.Additionally, this elevated rate is not indicative of a highly productive physician. This is only one example of several that likely contribute to the upper percentiles of reported compensation per work RVU rates.
Test the Model Based on Projected Productivity Levels
The work RVU model can take on many forms and structures. For example, some work RVU models pay only for each work RVU performed, some allow for a base salary with a work RVU incentive above a certain threshold, and some pay based on a tiered work RVU structure. The structure of the model is far less important than the compensation results when applied to a specific physician. Therefore, testing the proposed compensation model against probable scenarios of productivity levels for the specific physician is imperative. Regardless of the structure (i.e., the model may have five work RVU tiers or just one), the model should generally produce a compensation total that is correlated to the reasonably expected productivity levels of the physician.
Conclusion on RVU Compensation Models
Work RVU compensation models continue to be the model of choice for many hospitals and physicians across the market. With careful planning, analysis, and the assistance of an outside physician compensation valuation expert, developing a competitive and compliant model can be a straight forward process.