- About Us
- Our Clients
- Services
- Insights
- Healthcare Sectors
- Ambulatory Surgery Centers
- Behavioral Health
- Dialysis
- Hospital-Based Medicine
- Hospitals
- Imaging & Radiology
- Laboratories
- Medical Device & Life Sciences
- Medical Transport
- Oncology
- Pharmacy
- Physician Practices
- Post-Acute Care
- Risk-Bearing Organizations & Health Plans
- Telehealth & Healthcare IT
- Urgent Care & Free Standing EDs
- Careers
- Contact Us
Built-to-Suit: Constructing a New Building? Transaction Structuring, FMV, and Compliance Considerations – Part 3: Build-to-Suits and Capital Markets
June 28, 2021
By: Victor McConnell, MAI, ASA, CRE, Frank Fehribach, MAI, MRICS, and Grace McWatters
*This is Part 3 in VMG’s series on transaction structuring considerations for new developments. The other parts in this series can be found here: Part 1, Part 2, Part 4.
Are you constructing a new building, on or off of a hospital campus? If so, there are unique considerations that investors, JV partners, developers, hospitals, physicians, and other parties to a new development should evaluate. For instance, if a hospital and/or a physician partner are developing a building and then leasing it to a JV entity, the associated lease rate and overall development terms will likely need to be documented as being commercially reasonable [1] and within fair market value (“FMV”) parameters. For investors constructing build-to-suits, primary concerns may revolve around analyzing the risk associated with a particular tenant. For hospitals and physician partners who are joint venturing on a development, the key analyses may involve appropriate allocation of risk, responsibility, and capital vs. non-capital contributions that each party is making to the development. If parties are sharing in development responsibility and risk, then a careful analysis should be undertaken to ensure that parties receive appropriate return given their risk, as well as their various capital and non-capital contributions.
This article will provide an overview of key issues to be considered prior to, during, and subsequent to construction of a new building. For assistance with transaction advisory, cost benchmarking, FMV analysis, commercial reasonableness opinions, or other consulting services, please contact VMG Health.
In Part 1, we covered the economics of build-to-suit projects, the rates and returns associated with their development, as well as the types of costs and fees that can be expected during various stages of these projects. In Part 2, we covered variance in credit ratings, lease quality, and tenant risk, and how these factors can influence the profitability of a project. Part 3, which is presented below, will cover the relationship between capital markets and BTS rates, as well as rent factors and amortization rates, and how these factors impact development terms.
Build-to-Suit Rates and Capital Markets
As previously discussed, build-to-suit rates are significantly affected by cap rate trends, among other factors. Prevailing terms for debt also have a significant impact. For instance, in some CTL structures or loan instruments, a landlord may set a rate based upon a fixed number of basis points above an agreed upon index (such as the U.S. Prime Rate or 10-Year Treasury).
An investor may underwrite a real estate investment assuming a certain “spread” between the rate at which they can borrow money as compared to the rate of return that the property will generate. The cost of debt, the length of the loan, and the loan-to-value (“LTV”) are all significant factors for a real estate investor to evaluate relative to the cap rate at which they will acquire a property or the terms they will offer in a build-to-suit or for a tenant improvement allowance. In some cases, a tenant and landlord may negotiate a predetermined rate for TI amortizations, building additions, purchase options, or put options. In these instances, both landlord and tenant will evaluate the terms relative to alternatives (i.e. alternative investment options and alternative borrowing options).
In the last decade, VMG’s valuation & advisory team has worked extensively within the healthcare real estate sector, including on behalf of lenders, REITs, private equity, as well as health systems and physicians. In a recent consulting project, VMG reviewed information from more than 50 prior projects involving specialty healthcare construction. The goal of this internal data review was to generally evaluate prevailing build-to-suit market trends, as well as to analyze specific agreements where a tenant and landlord agreed on a predetermined price for significant capital expenditures on specialty real estate assets. Furthermore, VMG has analyzed select public REIT filings, historical capital market trends, and pertinent publications and surveys from brokerage firms and academic researchers.
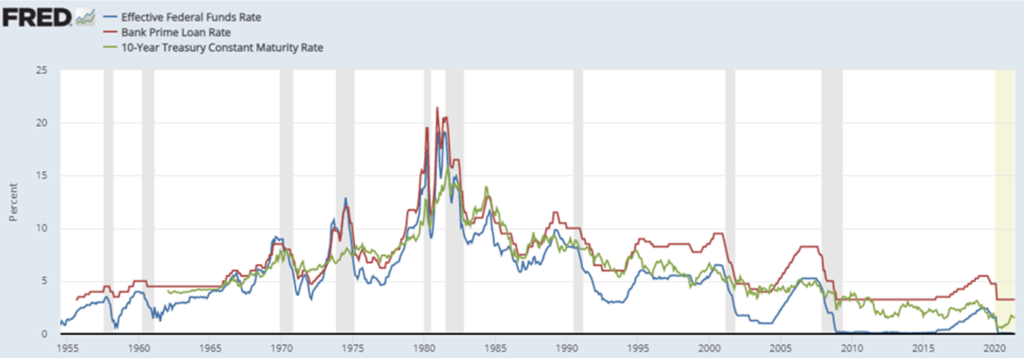
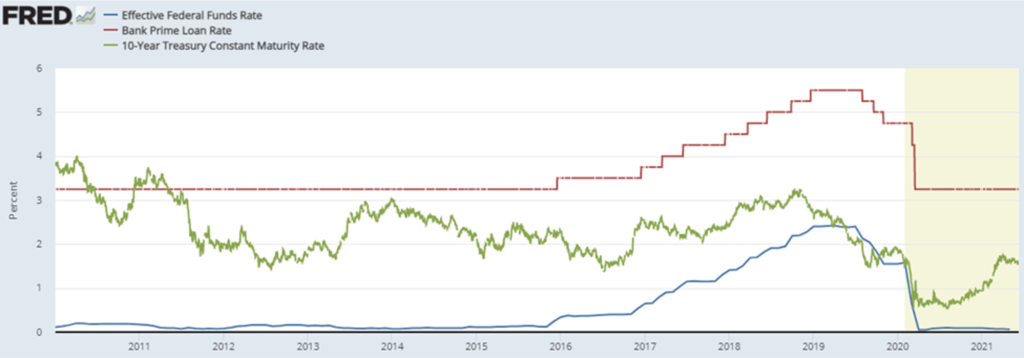
Throughout the commercial real estate sector, prevailing market rates are affected by capital markets conditions, including U.S. Prime Rates (“Prime Rates”). The Prime Rate is generally the lowest rate at which money can be borrowed from commercial banks by non-banks; the Wall Street Journal defines the Prime Rate as “The base rate on corporate loans posted by at least 70% of the 10 largest U.S. banks.” This rate is highly correlated with the Federal Funds Rate. Long-term fixed rates are generally correlated to the 10-Year U.S. Treasury Note (the “10-Year Treasury”). An investor could choose between “locking in” a return on a U.S. Treasury bond (such as the 10-Year Treasury) or investing in the commercial real estate market, where cap rates serve as an indication for an investor’s unlevered return. Unlike a bond with fixed payments, growth in cash flows is anticipated in a real estate investment. Thus, future growth rate assumptions also affect an investor’s overall anticipated return. Examining the spread between the 10-Year Treasury as compared to various commercial real estate (“CRE”) cap rate metrics can reveal changes in investor sentiment, as well as growth expectations. In order to illustrate long-term trends in the capital markets, the following two charts depict the Federal Funds Rate, the 10-Year Treasury Rate, and the U.S. Prime Rate in two periods: since 1950 and since 2010.


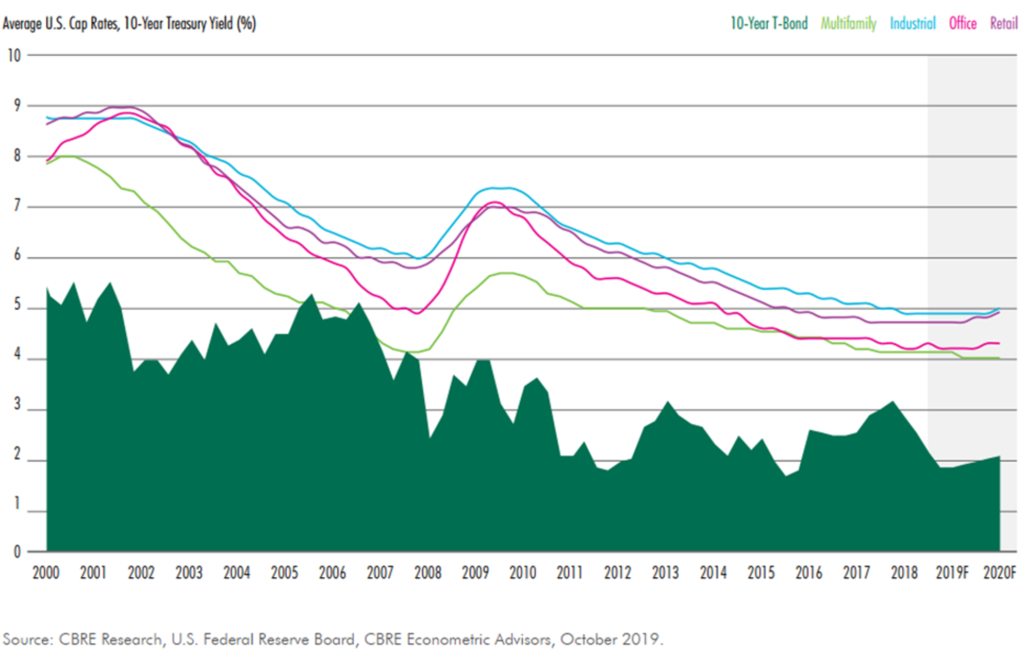
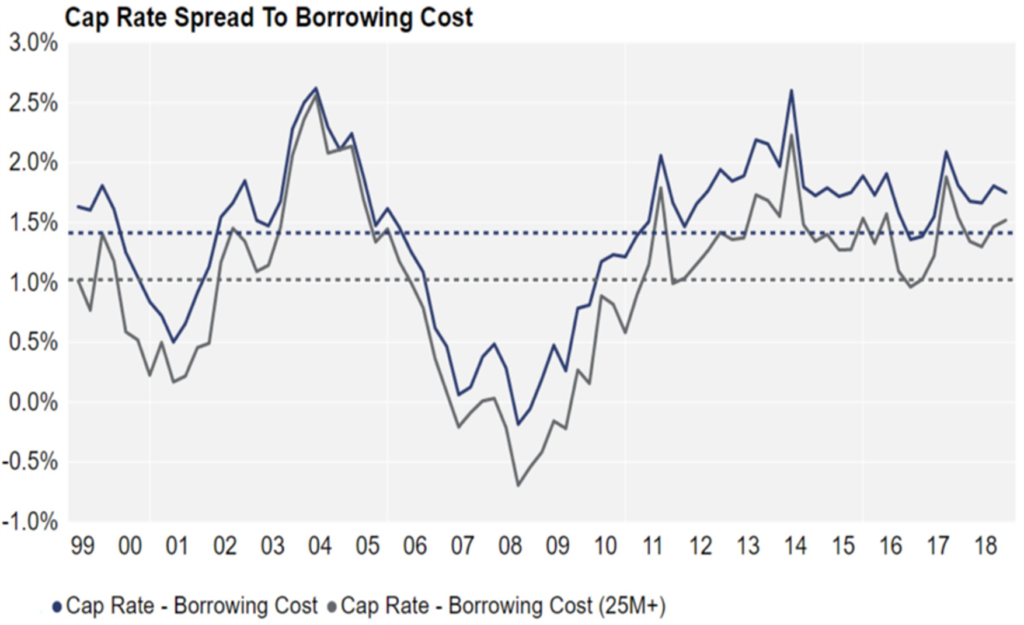
As is evident in the above charts, the three rates are highly correlated, though not perfectly so. These rates also impact the real estate markets, and a variety of research has been performed examining commercial property cap rate trends relative to these rates. The following two charts compare a) core commercial property sectors to the 10-year U.S. Treasury and then b) cap rates as compared to borrowing costs.


Though significant fluctuations are evident, the preceding charts also illustrate general long-term trends related to the spread between the Prime Rate and 10-Year Treasury.
- Between 1990 and 2020, the median spread between the Prime Rate and the 10-Year Treasury was 137 basis points, whereas the 25th and 75th percentile during that period was 42 basis points and 228 basis points.
- Between 1990 and 2020, the median spread between the 10-Year Treasury and the Federal Funds rate was 160 basis points, with a 25th and 75th percentile of 56 and 264 basis points, respectively. Thus, the spread between Prime Rate and Federal Funds rate during this period would be 297 basis points on a median basis.
Prior to the onset of COVID-19 and its impact on the real estate markets, CBRE’s “U.S. Real Estate Market Outlook 2020” noted that “the minimal increase in the 10-Year Treasury yield anticipated for 2020 will help limit cap rate increases and keep the spread about 200 to 300 bps above the risk-free rate next year.” This statement illustrates how institutional real estate investors place real estate returns into context relative to other rate benchmarks, such as the 10-Year Treasury. A study published by Ted. C. Jones, PhD (former chief economist of Texas A&M University’s Real Estate Center) benchmarked commercial real estate cap rates (sourced from Real Capital Analytics) as compared to the 10-Year Treasury on a trailing 12-month (TTM) basis, under the thesis that commercial real estate transactions can take roughly 12 months to close. This study focused on the period from Q1 2001 through Q3 2016. The median spread was 404 basis points, whereas the minimum and maximum were 193 and 509 basis points, respectively. Another study published by Quantum Real Estate Advisors in February 2019 (utilizing slightly different sources and methodology) revealed a general range (between the 10-Year Treasury and CRE cap rates) of 100 to 450 basis points with an average spread of around 300 basis points.
In evaluating a RoC rate for a new development, it should be noted that there is a difference between a rent factor and an amortization rate. By way of illustration, suppose $5,000,000 was provided by a landlord to a tenant for a 10,000-square-foot expansion project ($500/SF). If the landlord and tenant agreed to an 8% rent factor, the rent would be $400,000 per year ($40/SF), e.g. the multiplication of the cost ($5M) by the factor (0.08). However, if landlord and tenant amortized the cost over a 15-year term at 8% (compounded monthly), the annual rent would be $573,391 ($57.34/SF). The same amount amortized over a 25-year term would result in an annual rent of $463,090 ($46.31/SF).
Typically, if a landlord is offering funding based on a rent factor rather than an amortization rate, they are also anticipating residual value at the end of the lease term, or the lease term is long enough that the difference between a rent factor and an amortization rate is minimal. Assuming a 25-year lease term, an amortization rate of 6.75% would result in a similar rent indication as an 8.0% rent constant.
Ultimately, any analysis of a build-to-suit project (or funding of a new addition to an existing hospital campus) should involve careful consideration of and distinction between appropriate amortization rates or rent factors.
Within VMG’s analysis of hundreds of FMV lease rate assessments across the United States, VMG has inquired as to prevailing TI amortization rates for medical office building finish out. The range of TI rates offered by landlords to tenants is affected by capital markets conditions, just as cap rates and other return rates are correlated with various rate benchmarks (such as the 10-Year Treasury). Examples of landlords and tenants agreeing to a formula which predetermines a rate in the future for a lease adjustment or a purchase option are less common, though they do exist. For further discussion of a structure whereby a lease adjustment or purchase option is based on a fixed formula, please contact VMG Health’s real estate division.
Though not always associated with build-to-suits and new construction, the sale/leaseback market also contains pertinent indicators, as well as scenarios which can be somewhat analogous to a build-to-suit. For instance, VMG has reviewed leases executed in sale/leaseback agreements with a REIT whereby the REIT would execute the sale/leaseback at a certain rate and would simultaneously offer to fund certain capital additions at a similar or identical return rate (with this reflected in the lease agreement). Essentially, the REIT was evaluating the risk associated with the tenant/operator as equivalent in two separate scenarios: 1) providing funds in exchange for receipt of the operator’s underlying real estate as collateral (the sale/leaseback) and 2) providing funds for a capital addition to the existing collateral in exchange for the operator’s commitment to lease the capital addition at the same return rate. However, in both cases, in selecting its return rate (whether an amortization rate or rent factor), the REIT is also assessing the likelihood of renewal and the residual value that may exist at the end of the lease term.
A variety of survey data pertaining to lending rates for permanent and interim financing also exists. RealtyRates.com publishes an investor survey quarterly with rates specific to a variety of commercial real estate industries, including healthcare / senior housing. The 2nd Quarter 2021 version of this survey featured the following for the Health Care / Senior Housing sector:
- Permanent Financing: Rates were quoted on a spread over base basis, with “base” defined as the 10-year Treasury. These ranged from 134 basis points (bps) to 670 bps, with an average of 364 bps. Overall interest rates ranged from 2.60% to 7.96%, with an average of 4.90%. DCRs ranged from 1.10x to 2.25x, with an average of 1.50x, while LTVs ranged from 0.50 to 0.90, with an average of 0.71. Amortization periods ranged from 15 to 40 years, with an average of 25 years, while loan terms ranged from 3 to 25 years, with an average of 14 years.
- Interim Financing (Construction): On a spread over base basis, rates ranged from 95 bps to 685 bps, with an average of 394 bps. Overall interest rates ranged from 4.20% to 10.10%, with an average of 7.19%, with loan fees of 1.50% to 5.50% (average of 3.36%). LTVs ranged from 0.50 to 1.0, with an average of 0.78. Loan terms were 12 to 24 months, with an average of 18 months. Amortization was interest only.
The preceding summary of the various indices reveals the range of terms that exist in the capital markets. In a build-to-suit scenario, the overall market trends, as well as the specifics associated with a particular site or tenant, will affect the appropriate overall development terms. If a JV entity between two healthcare providers (health system and outpatient platform company or physician group, for instance) involves providing debt to the project, then the terms should be consistent with FMV and commercially reasonable given the overall transaction profile.
If a “rent constant” is being fixed in advance, then a prudent tenant and landlord will both evaluate capital market trends (and likely projections) to determine where cap rates (or the debt markets) are likely to be at the time that either the debt is secured, or the project is sold (or both). If the funding is tied to a certain capital markets indicator, then tenant and landlord should evaluate long term trends in the selected index.
Regardless of structure (negotiated rent per square foot vs. predetermined rent factor vs. rent tied to a capital markets index), the appropriate spread (and overall development profit) should be considered in the context of the various risks and responsibilities that landlord/developer versus tenant are undertaking.
This concludes Part 3 of VMG Health’s four-part series.
Footnotes:
[1] In the December 2, 2020 Final Rule, CMS provided updated and detailed guidance on commercial reasonableness (“CR”). CR is a complex topic and a detailed CR discussion is beyond the scope of this article. For questions regarding commercial reasonableness in the context of a new real estate development, please contact VMG Health.
Categories: Uncategorized
Subscribe
to our blog
