
Is There Value in Your Inpatient Rehabilitation Facility?
Rachel Linch
June 27, 2022

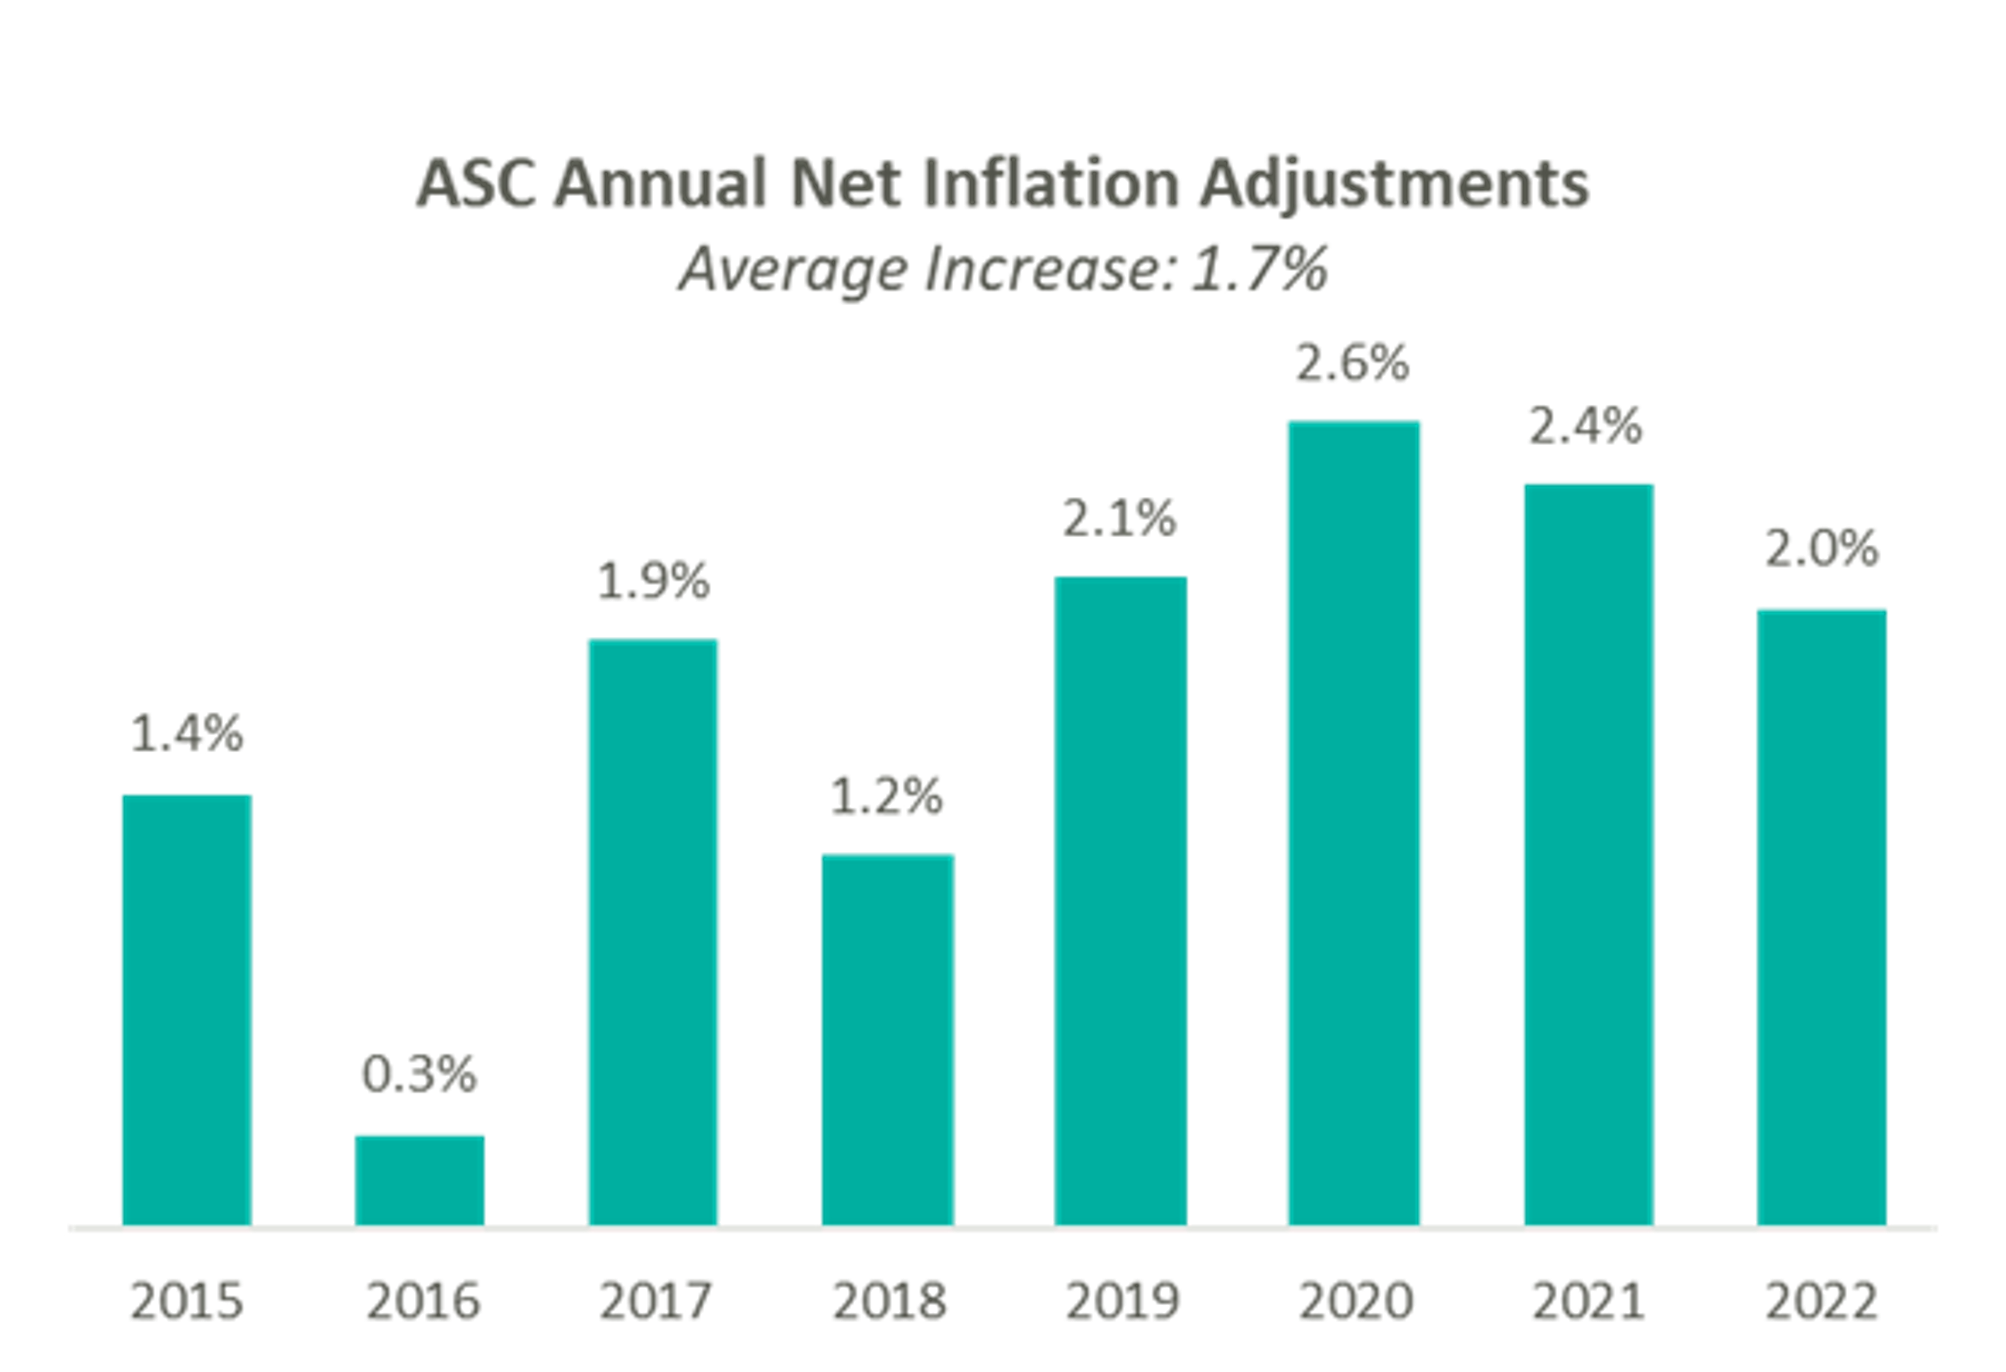
On November 2, 2021, Centers for Medicare & Medicaid Services (“CMS”) released the CY 2022 Hospital Outpatient Prospective Payment System (“OPPS”) and Ambulatory Surgery Center (“ASC”) payment system policy changes and payment rates final rule. Based on the final ruling, CMS will continue to update the ASC payment system using the hospital market basket update, rather than the Consumer Price Index for All Urban Consumers (“CPI-U”) for CYs 2019 through 2023. The final rule resulted in overall expected growth in payments equal to 2.0% in CY 2022. This increase is determined based on a projected inflation rate of 2.7% less the multifactor productivity (“MFP”) reduction of 0.7% mandated by the ACA.
Presented in the chart below is a summary of the historical net inflation adjustments for CY 2015 through CY 2022. The annual inflation adjustments are presented net of additional adjustments, such as the MFP reduction, outlined in the final rule for the respective CY. The CY 2022 inflation adjustment continues the trend of relative stability of annual adjustments since CMS implemented the use of the hospital market basket update to finalize payment rates in CY 2019.
Alongside finalization of payment rates, CMS finalized its proposal to halt policy changes from the previous administration that added a significant number of codes to the ASC Covered Procedures List (“ASC-CPL”) and began the process of eliminating the inpatient-only (“IPO”) list. Procedures that were removed in 2021, except for CPT codes 22630 (Lumbar spine fusion), 23472 (Reconstruct ankle joint), and their corresponding anesthesia codes, have been added back to the IPO list.
“We are pleased that CMS recognized the unique role that hospital outpatient departments play in caring for patients by rolling back two problematic policies it put forth last year. Reinstating the list of services that Medicare will pay for only when performed in an inpatient setting due to their medical complexity, and reinstating long-standing safety criteria for allowing procedures to take place in ambulatory surgical centers, is a win for patients’ safety, health and quality of care.”
Stacey Hughes, Executive Vice President, AHA
“This final rule contains some modest improvements since the proposed rule, but we are disappointed that the agency finalized a decision to reduce beneficiary access to ASCs for a number of important procedures that were added just a year ago, despite CMS having little to no clinical data to use as a basis for removing them from our payable list. To that end, however, we were particularly pleased to see that our longstanding recommendation for a transparent process to add procedures to our payable list is included.”
ASCA Chief Executive Officer Bill Prentice
On December 2, 2020, CMS released the 2020 OPPS and ASC Payment System final rulings, which finalized the addition of 11 procedures to the ASC-CPL, most notably including total hip arthroplasty (hip replacement surgery). Additionally, CMS revised the criteria used to add covered surgical procedures to the ASC CPL. Under the revised criteria, CMS added an additional 267 surgical procedures to the ASC-CPL beginning in CY 2021.
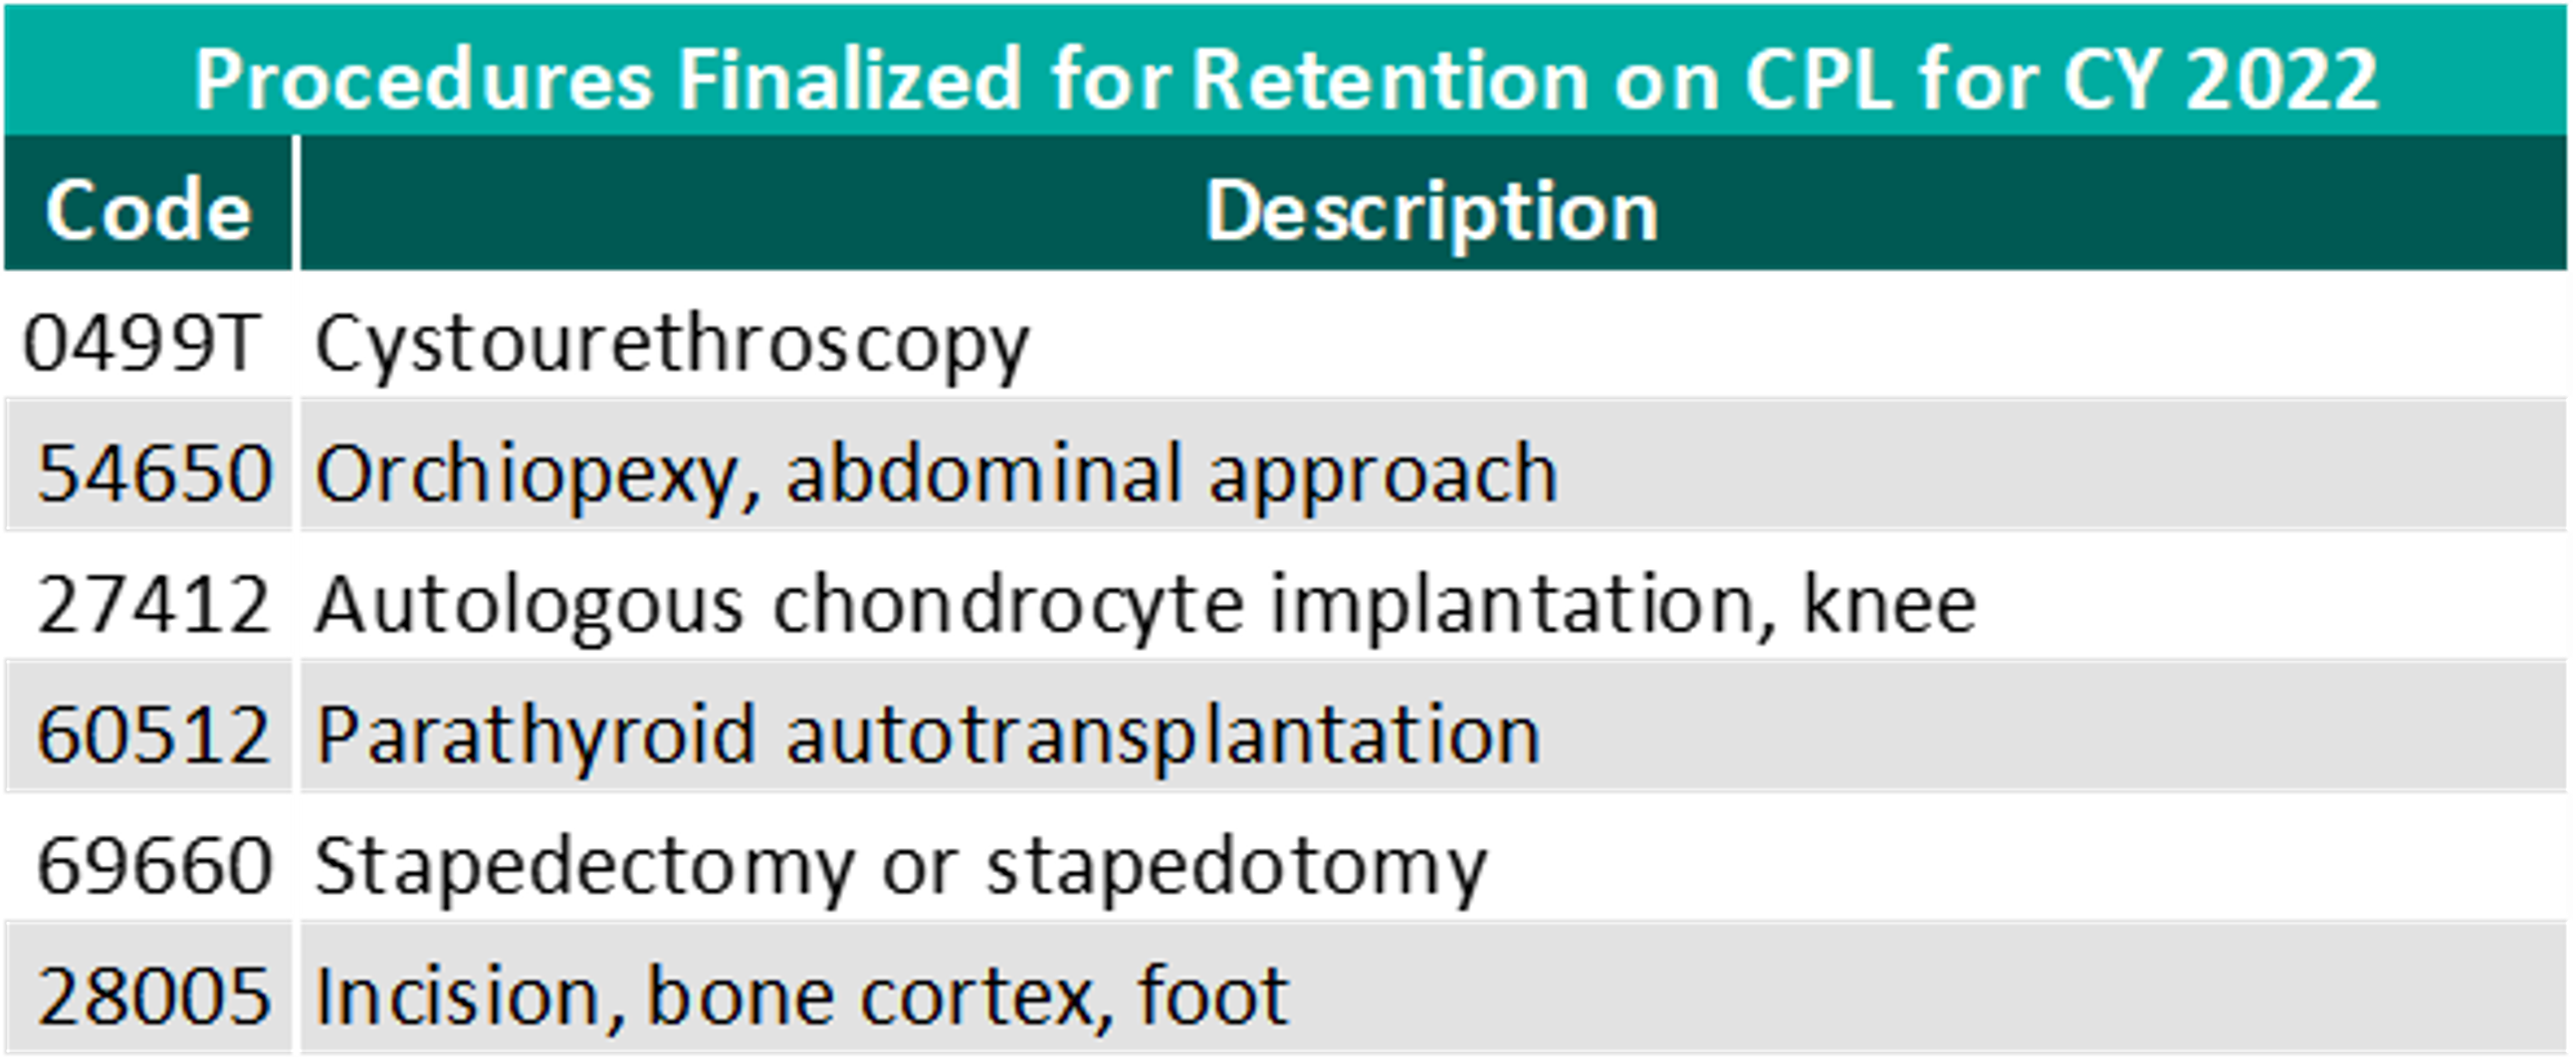
For CY 2022, CMS is reinstating the criteria for adding procedures to the ASC CPL that were originally in place in 2020. After reviewing commentary on the 258 procedures proposed for removal, CMS is retaining six procedures, three already on the ASC CPL and three proposed for removal, and removing 255 of the procedures proposed for removal.
Though the final ruling for increases to ASC payments by CMS and the recovery from Covid-19 would both indicate an expected increase in total payments, this increase is slightly offset by the removal of the 255 CPT codes added with the CY 2021 final rule. Ultimately, CMS has projected total ASC payments in 2022 to increase approximately $40 million from 2021 payments, to be approximately $5.41 billion. The source of the increase in payments is a combination of enrollment, case-mix, and utilization changes.
In conclusion, we continue to see themes from 2020 play out through 2021 and continue into the finalization of the CY 2022 payment system. CMS continues to show stability on the annual inflation adjustment utilizing the hospital market basket to update rates. However, there remains uncertainty on the future of the CPL and IPO lists, with continued discussion around adjustments being made to the program and the impacts of regulatory changes surrounding outpatient care.
Last year, the Centers for Medicare & Medicaid Services (“CMS”) revised the relative value units (“RVUs”) for many outpatient codes, specifically those related to evaluation & management (“E&M”). The Impact of the 2021 Medicare Physician Fee Schedule on Physician Practice Revenue and Provider Compensation provides an in-depth overview of the reimbursement methodology under the Medicare Physician Fee Schedule (“MPFS”) and the estimated impact on work RVUs (“WRVUs”) and Medicare reimbursement under the CY 2021 MPFS Final Rule. The 2022 CMS Physician Fee Schedule Final Rule (“CY 2022 Final Rule”) will implement less volatile, but important reimbursement changes beginning in January 2022.
Under the CY 2022 Final Rule, CMS finalized a reduction in the physician fee schedule conversion factor of 3.75% by decreasing the conversion factor from $34.89 to $33.59. The conversion factor reduction primarily reflects the expiration of the Consolidated Appropriations Act (“CAA”). The CAA was enacted by Congress in CY 2021 in response to the COVID-19 emergency, which temporarily provided a 3.75% increase in payments under the physician fee schedule for 2021, or about $3 billion in increased payments for physician services. With the CAA provisions expiring beginning CY 2022, CMS has finalized the reduction in the CY 2022 Final Rule, leaving many considering the material implications related to provider operations.
Understanding these changes is critical to proper financial planning and to appropriately assessing physician compensation. As healthcare leaders know, properly compensating physicians is key to alignment, care coordination and compliance. The following sections briefly describe the key changes outlined in the CY 2022 Final Rule and how to tackle existing and prospective physician compensation agreements under the new reimbursement environment.
In isolation, the theoretical effect to provider reimbursement due to the conversion factor adjustment will result in a 3.75% decrease in revenue for multi-specialty groups. In combination with other looming factors, providers are potentially facing up to a 10% cut to Medicare reimbursement beginning CY 2022. According to the American Medical Group Association (“AMGA”), providers are also facing a 2% Medicare sequester and a 4% Medicare cut due to Pay-As-You-Go (“PAYGO”) offsets required by the 2021 COVID-19 relief package.[1] Barring significant policy intervention, healthcare systems are facing drastic changes in reimbursement, which may, in turn, exacerbate provider shortages in an already overwhelmed space.
VMG has analyzed the expected changes detailed in the CY 2022 Final Rule. The table below summarizes VMG’s analysis on the estimated impact of the 2022 finalized changes to overall WRVUs and reimbursement for key medical and surgical specialties from 2020 levels.
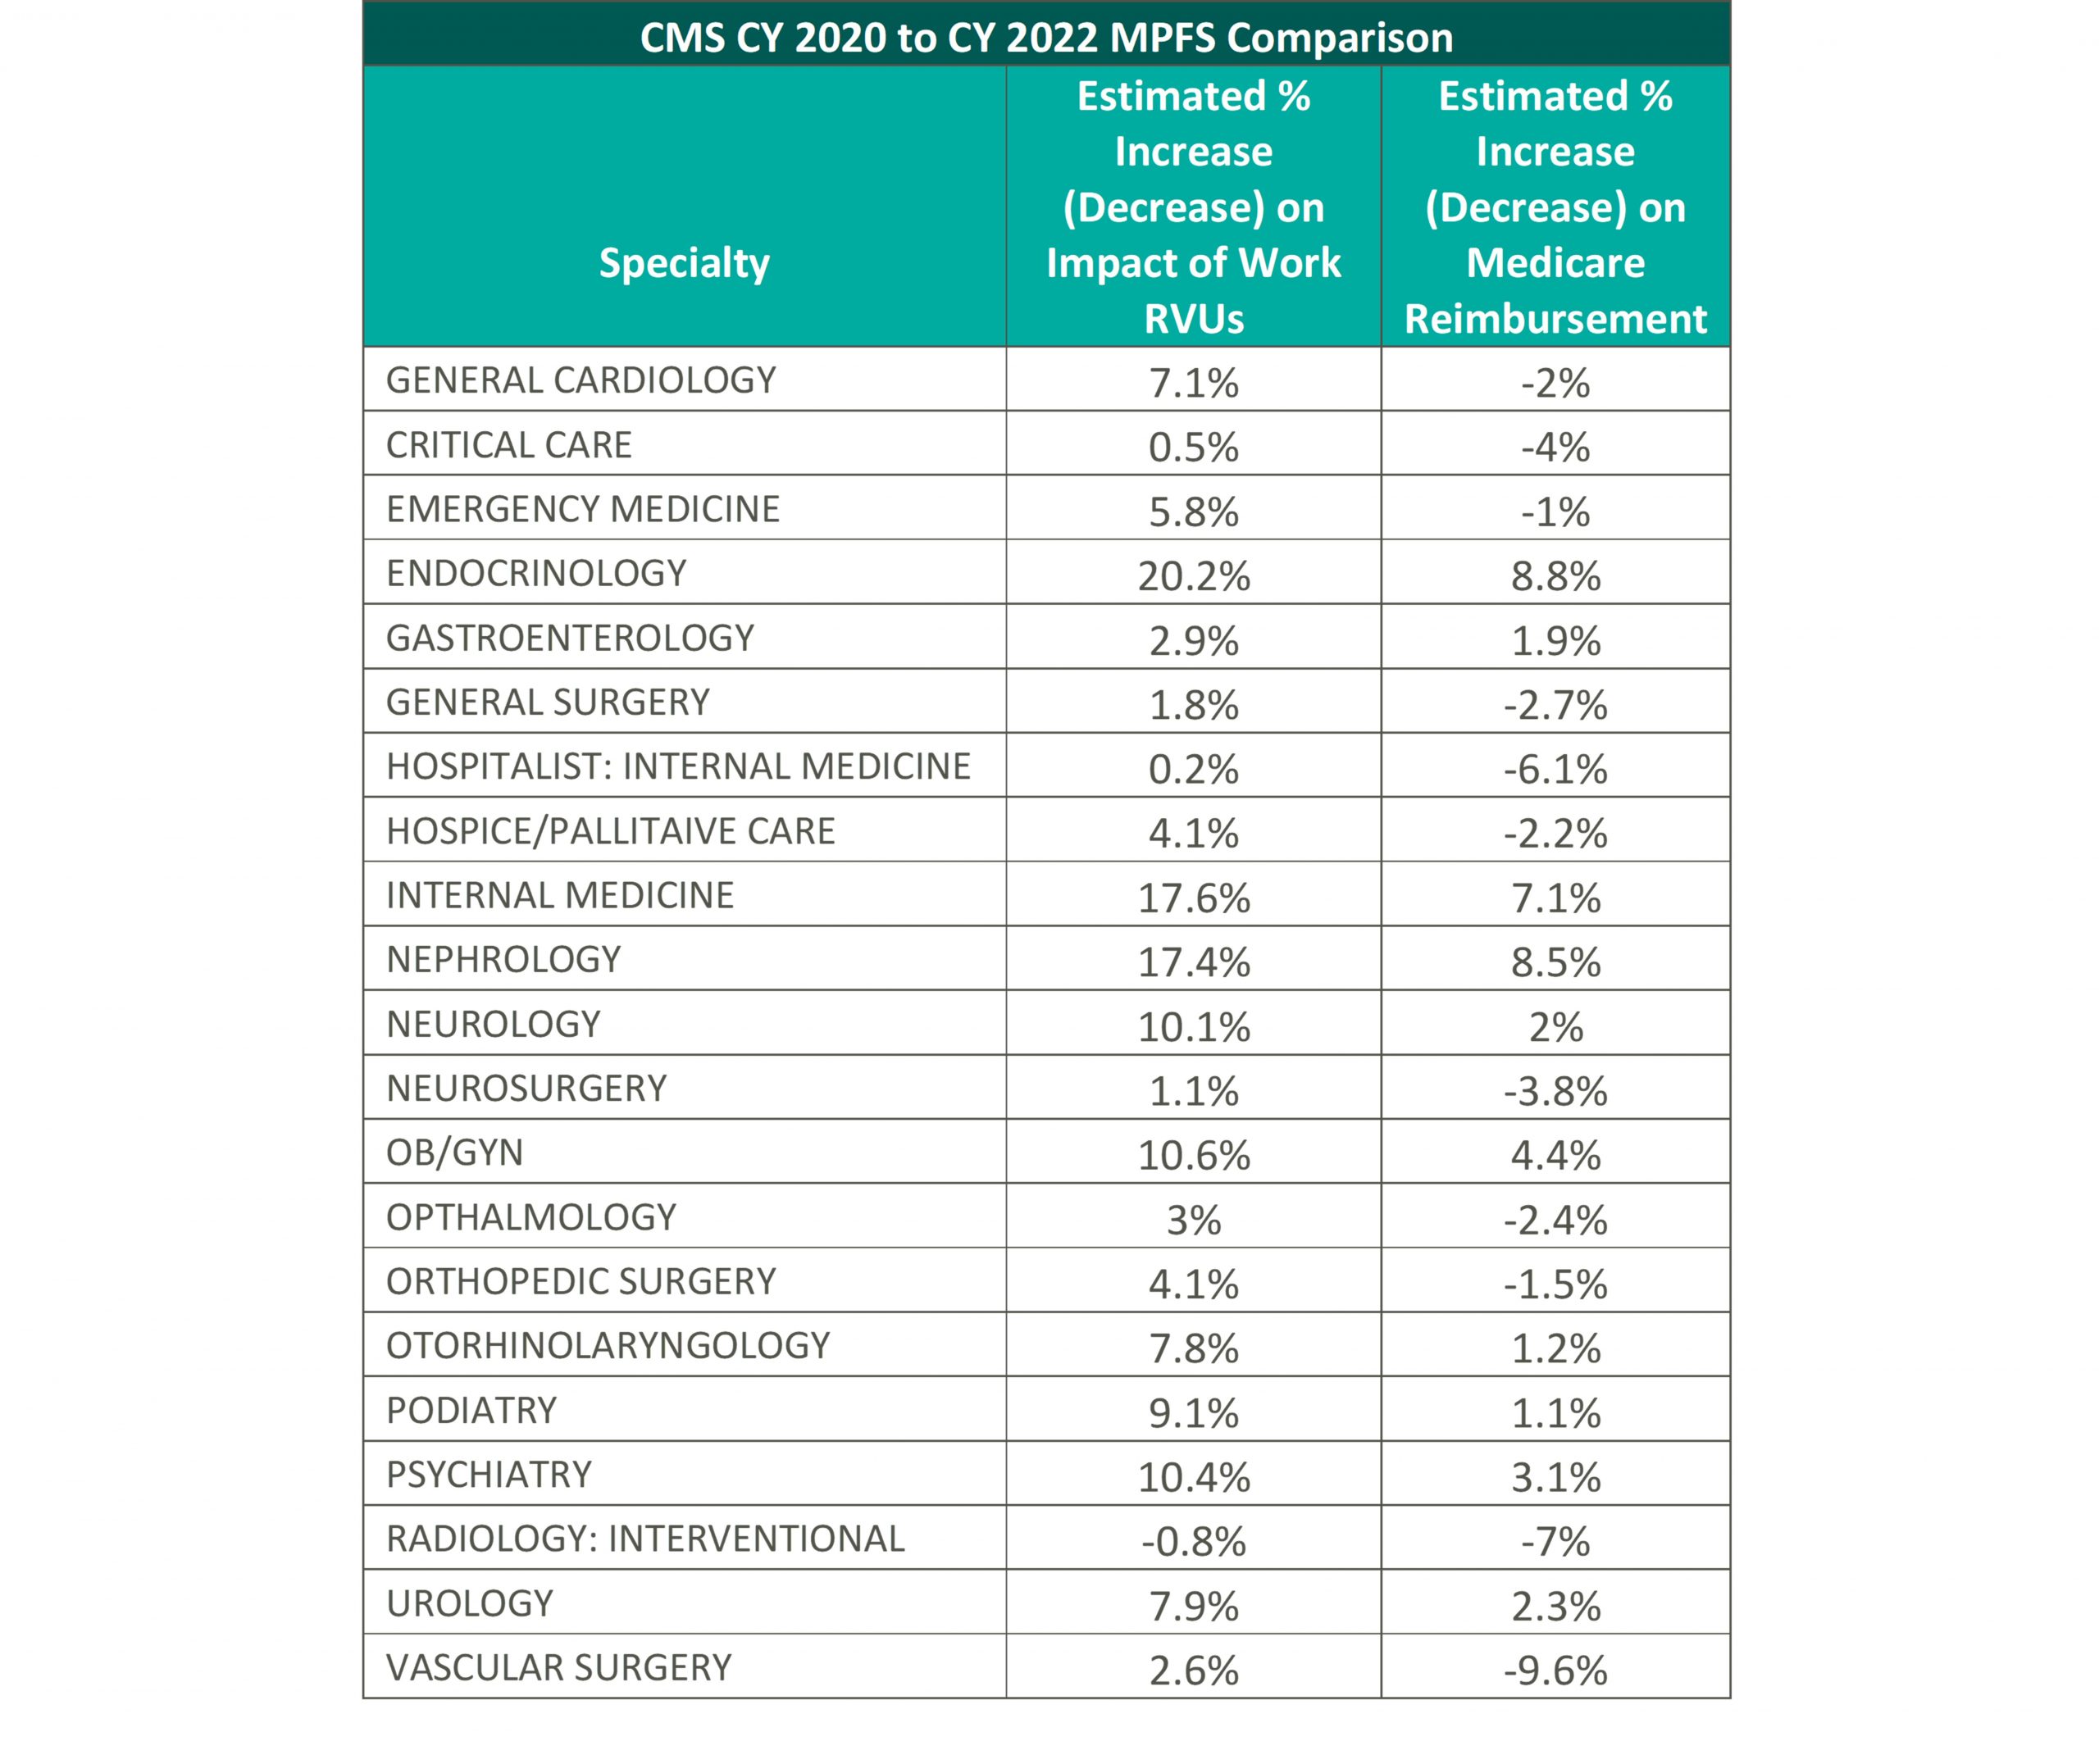
VMG has conducted an internal analysis for each specialty using 2022 RVUs and the 2022 conversion factor compared to the 2020 MPFS RVU factors (please see the above table for more detail) to determine the anticipated effects of the implementation of the CY 2022 Final Rule. Please note, VMG recognizes that the impact to individual practices and medical groups is heavily dependent on a provider’s service mix and the values reported in the physician fee schedule.
In consideration of the aforementioned changes, VMG believes it is crucial that healthcare systems who are currently utilizing the 2020 physician fee schedule consider the material impact in their operations that the CY 2021 and CY 2022 Final Rule may create. These considerations will be discussed in later sections.
The impact of the CY 2022 Final Rule has been heavily criticized thus far, as CMS received many comments of concern from healthcare associations to specialty physicians that are requesting CMS and other regulatory bodies to step in to prevent the decrease to the conversion factor. However, CMS has cited that because the initial increase was provided through a time-limited amendment to the statute (the CAA), CMS does not have legal authority to alter and, therefore, CMS cannot implement any long-term changes without guidance from regulatory bodies.[2] Below are a small sample of reactions from various physician organizations related to the CY 2022 Final Rule:
“Now that the decrease in the conversion factor is official, AMGA members need Congress to recognize the gravity of the situation. The decrease in the Medicare conversion factor, along with the looming sequester and PAYGO cuts, will undermine the ability of AMGA members to care for their patients. Failing to prevent these cuts could result in significant challenges. Our members will need to make hard choices, and will need to consider hiring freezes and layoffs, as well as service line eliminations. It’s a critical situation, and Congress needs to treat it as such.”[3] [American Medical Group Association]
“Surgeons and their patients have already been significantly impacted by the pandemic. These Medicare cuts will further exacerbate our pandemic-strained health care system and cause further delay in care to the patients who need it most.”[4] [American College of Surgeons]
“We are once again facing a potential drastic cut in physician payments at the end of the year. It is imperative that Congress step in to prevent the cuts and ensure stability while our health care system is still in the midst of the COVID-19 pandemic. The impact to physician practices will be even greater when you couple these cuts with the huge impact that the pandemic has had on internal medicine specialists and other frontline physicians. We need to ensure that practices across the country are able to continue to operate and provide frontline care that improves health equity and patient access in their communities.”[5] [American College of Physicians]
It is important to note that, as part of the COVID-19 public health emergency (“PHE”), CMS reviewed and identified additional telehealth services to be included on the Medicare telehealth services list. Many of these services, which were set to expire at the end of the calendar year in which the PHE ends, have been extended and expanded in the CY 2022 Final Rule. These changes were praised by commentators as affording practitioners the ability to provide very necessary services to patients while also protecting the health and safety of healthcare providers.
Throughout CY 2021, VMG has observed approximately 50-75% of healthcare organizations delaying in some manner the use of the 2021 WRVU factors in production-based physician compensation models. As healthcare organizations plan their transition to the new WRVU factors, VMG would emphasize an adjustment to the compensation plan that is consistent with the organization’s budget and projected changes to the organization’s reimbursement. It is particularly important to consider the potential long-term impacts on reimbursement as compensation models tend to be fixed for more than one year. Additionally, given the impact of the COVID-19 pandemic on provider compensation and productivity levels, healthcare organizations need to consider the implications of utilizing compensation surveys compiled in 2021, 2022, and potentially beyond. The actual rates per WRVU an organization uses should account for a) the increased WRVU values in the 2022 physician fee schedule, b) the organization’s projected changes in revenue in their 2022 payor contracts and c) market movement in compensation and compensation per WRVU rates.
If an organization uses the 2022 fee schedule without considering any adjustments to the rates it pays employed physicians, the organization risks over-compensating its physicians relative to market. Various factors will impact whether physicians are compensated above levels that might be considered fair market value, so organizations must fully assess the impact of doing nothing and the effect such a move might have on the fair market value and commercial reasonableness of resulting compensation.
Another area of provider compensation that will certainly be impacted by the reimbursement changes is in hospital-based coverage agreements. In many of these agreements, provider groups are already subsidized by hospitals and will likely be requesting additional financial support under the new fee schedule.
The two primary compensation methodologies for hospital-based coverage agreements are collections or revenue guarantees and fixed subsidy models. Under the collections guarantee structure, the contracted provider would bill and collect for professional services rendered and provide periodical reports to the hospital documenting actual professional revenues for reconciliation purposes. Based on the reconciliation methodology and depending on the hospital’s payor mix and service provider’s payor contracts, the changes to the 2022 physician fee schedule could result in significantly lower professional collections for the service provider and, therefore, a larger financial obligation for the hospital.
Alternatively, a fixed subsidy sets the contractual payment in advance by calculating the difference between estimated professional collections and estimated operating expenses. Under this arrangement structure, the provider group bears more risk than under a collections guarantee model because it receives a fixed amount, and hence has to assert more control over containing costs. Under the 2022 physician fee schedule, provider groups that do not receive an adjustment to their existing subsidy contracts could become insolvent if their physicians are unwilling to accept lower compensation for their services.
[1] https://www.amga.org/about-amga/amga-newsroom/press-releases/110321/
[2] Final Rule, Federal Register, November 2021, available at: https://www.federalregister.gov/public-inspection/2021-23972/medicare-program-cy-2022-payment-policies-under-the-physician-fee-schedule-and-other-changes-to-part
[3] https://www.amga.org/about-amga/amga-newsroom/press-releases/110321/
[4] https://www.facs.org/media/press-releases/2021/medicare-cuts-110221
[5] https://www.acponline.org/acp-newsroom/internists-say-2022-medicare-fee-schedule-includes-positive-changes-for-physicians
As the value-based care reimbursement environment grows, there is an increasing interest in linking additional physician compensation to the achievement of quality outcomes as measured by certain quality metrics. These quality metrics are now commonly found in employment agreements, independent contractor agreements, service line co-management agreements, and other models that aim to align physician performance with quality indicators. Recent regulatory guidance supporting payments for quality metrics that are tied to measurable outcomes and credible medical evidence has further sparked interest in these sorts of arrangements. That said, many health care leaders may find it difficult to determine which quality metrics should be included in their arrangements. Although specific quality metric considerations vary by specialty, there are several fundamental ground rules to apply when considering the overall compliance and value of quality metrics.
General Rule: Quality metrics should be tied to clinical outcomes while time-based activities should be tied to an hourly rate.
Time-based metrics come in many forms, such as implementation-based goals, meeting attendance regarding quality metric development, or program development. Although these tasks help get a quality program up and running, they should not be linked to quality metric payments due to the risk that these types of goals may already be paid for under an hourly rate. Additionally, quality metrics should not overlap with protocols/procedures that are already required per medical staff bylaws, as this could indicate a payment for a service that has already been accounted for in another agreement.
General Rule: Physicians should be primarily responsible for impacting each quality metric’s underlying performance.
Any metric in which a physician does not drive the outcome should not be included in your quality metric set. Some examples of metrics to avoid include billing/coding measures, metrics that measure outcomes generally addressed by other personnel such as nurses (ex: number of patient falls) and administrative staff (ex: pre-op documentation / logistics), or metrics related to service line or hospital financial performance (ex: improving margins). Additional considerations should also be made for arrangements that include multiple service lines or campuses to ensure each participating physician materially impacts what is being measured.
General Rule: Payment should be tied to significant improvement in historical performance and/or nationally benchmarked data.
Each quality metric’s payment should be linked to an improvement in historical performance and/or be difficult to achieve compared to nationally benchmarked data (ex: performance at the 90th percentile of national performance data). Paying for maintaining historical performance should be avoided unless historical performance is already at a superior level and the parties agree the underlying quality metric is important.
Similarly, avoid linking a large payout to a small, incremental increase in historical performance. In cases when historical performance is not available, such as new quality programs, national data should be utilized as a benchmark for appropriate performance rather than coming up with an arbitrary number.
For each potential metric you should ask yourself the following questions:
If the answer to any of these questions is “no”, then that metric should be reconsidered in order to maintain compliance with what is being paid for in the market.
Further, there are additional fair market value considerations if the compensation for quality outcomes is being stacked on top of an existing employment model for a physician. Specifically, that underlying compensation model should be fully understood before determining if stacking is appropriate. More information can be found on this topic in VMG Health’s piece, “Stacked Compensation Arrangements: What to Consider.”
Whether you are building a new arrangement from scratch or revisiting an existing one, VMG has extensive experience valuing fair market value payments for the achievement of quality metrics across every specialty in addition to offering consulting services that help clients align their metrics and quality programs with the market and service line needs.
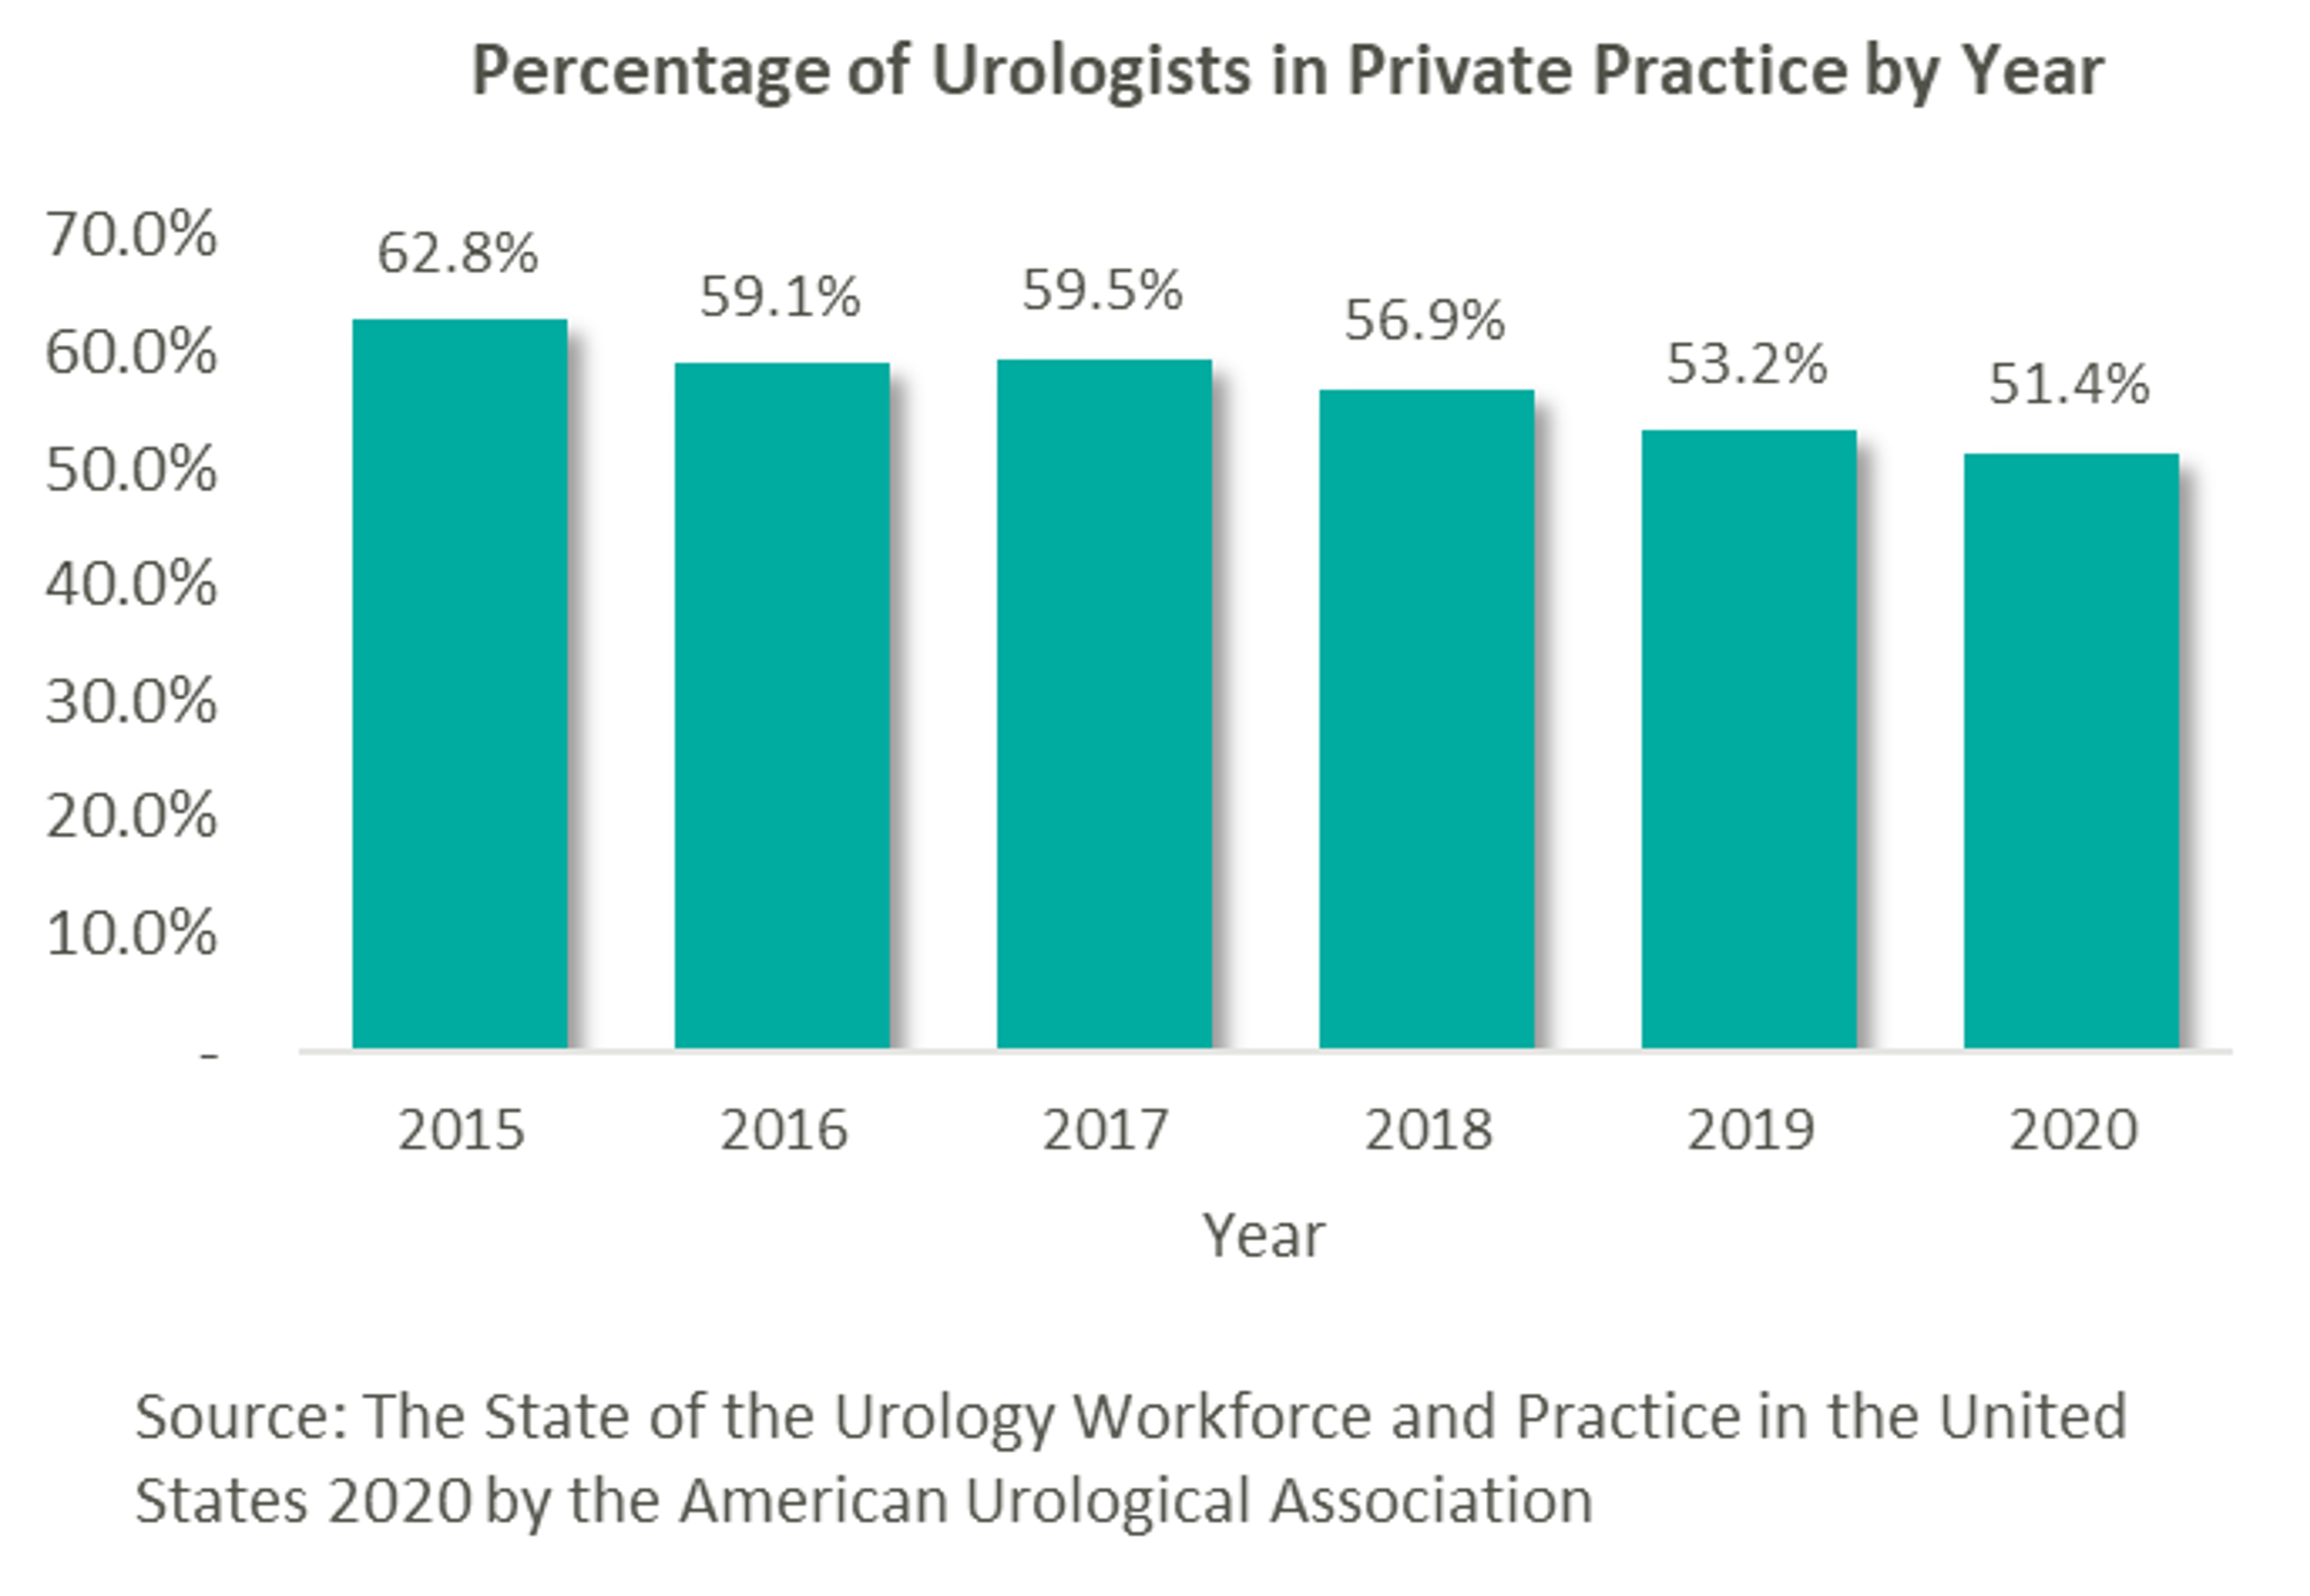
As many physician specialties begin to mature (e.g., gastroenterology, dermatology and ophthalmology), funds have started to flow into the urology space from private equity (“PE”) firms still eyeing platform acquisitions. “Competition for quality assets in this segment is still pretty light. There are a number of independent urology groups of scale with good management teams and back-office infrastructure,” stated Jeanne Proia of Cross Keys Capital in an interview with Mergermarket. [1] Growth prospects for urology practices are also particularly strong due to increases in life expectancy that have led to increases in demand for urologic services. Additionally, an expected shortage of urologists estimated to exceed 3,600 by 2025 will only further amplify the situation. [2] Urology’s several sources of ancillary revenue such as lab & pathology services, lithotripsy, radiation oncology, and ambulatory surgery make the specialty particularly attractive to platforms seeking to execute a roll-up strategy. With over 13,000 urology providers, 51.4% of whom work in private practice, this fragmented market offers PE firms the opportunity to facilitate consolidation. [3]
This prospect, paired with the strong demand for urologic services, has led to significant investment interest in the space, which can trace its roots back to August 2016 with Audax Private Equity’s partnership with Chesapeake Urology and the resulting formation of United Urology Group (“UUG”).
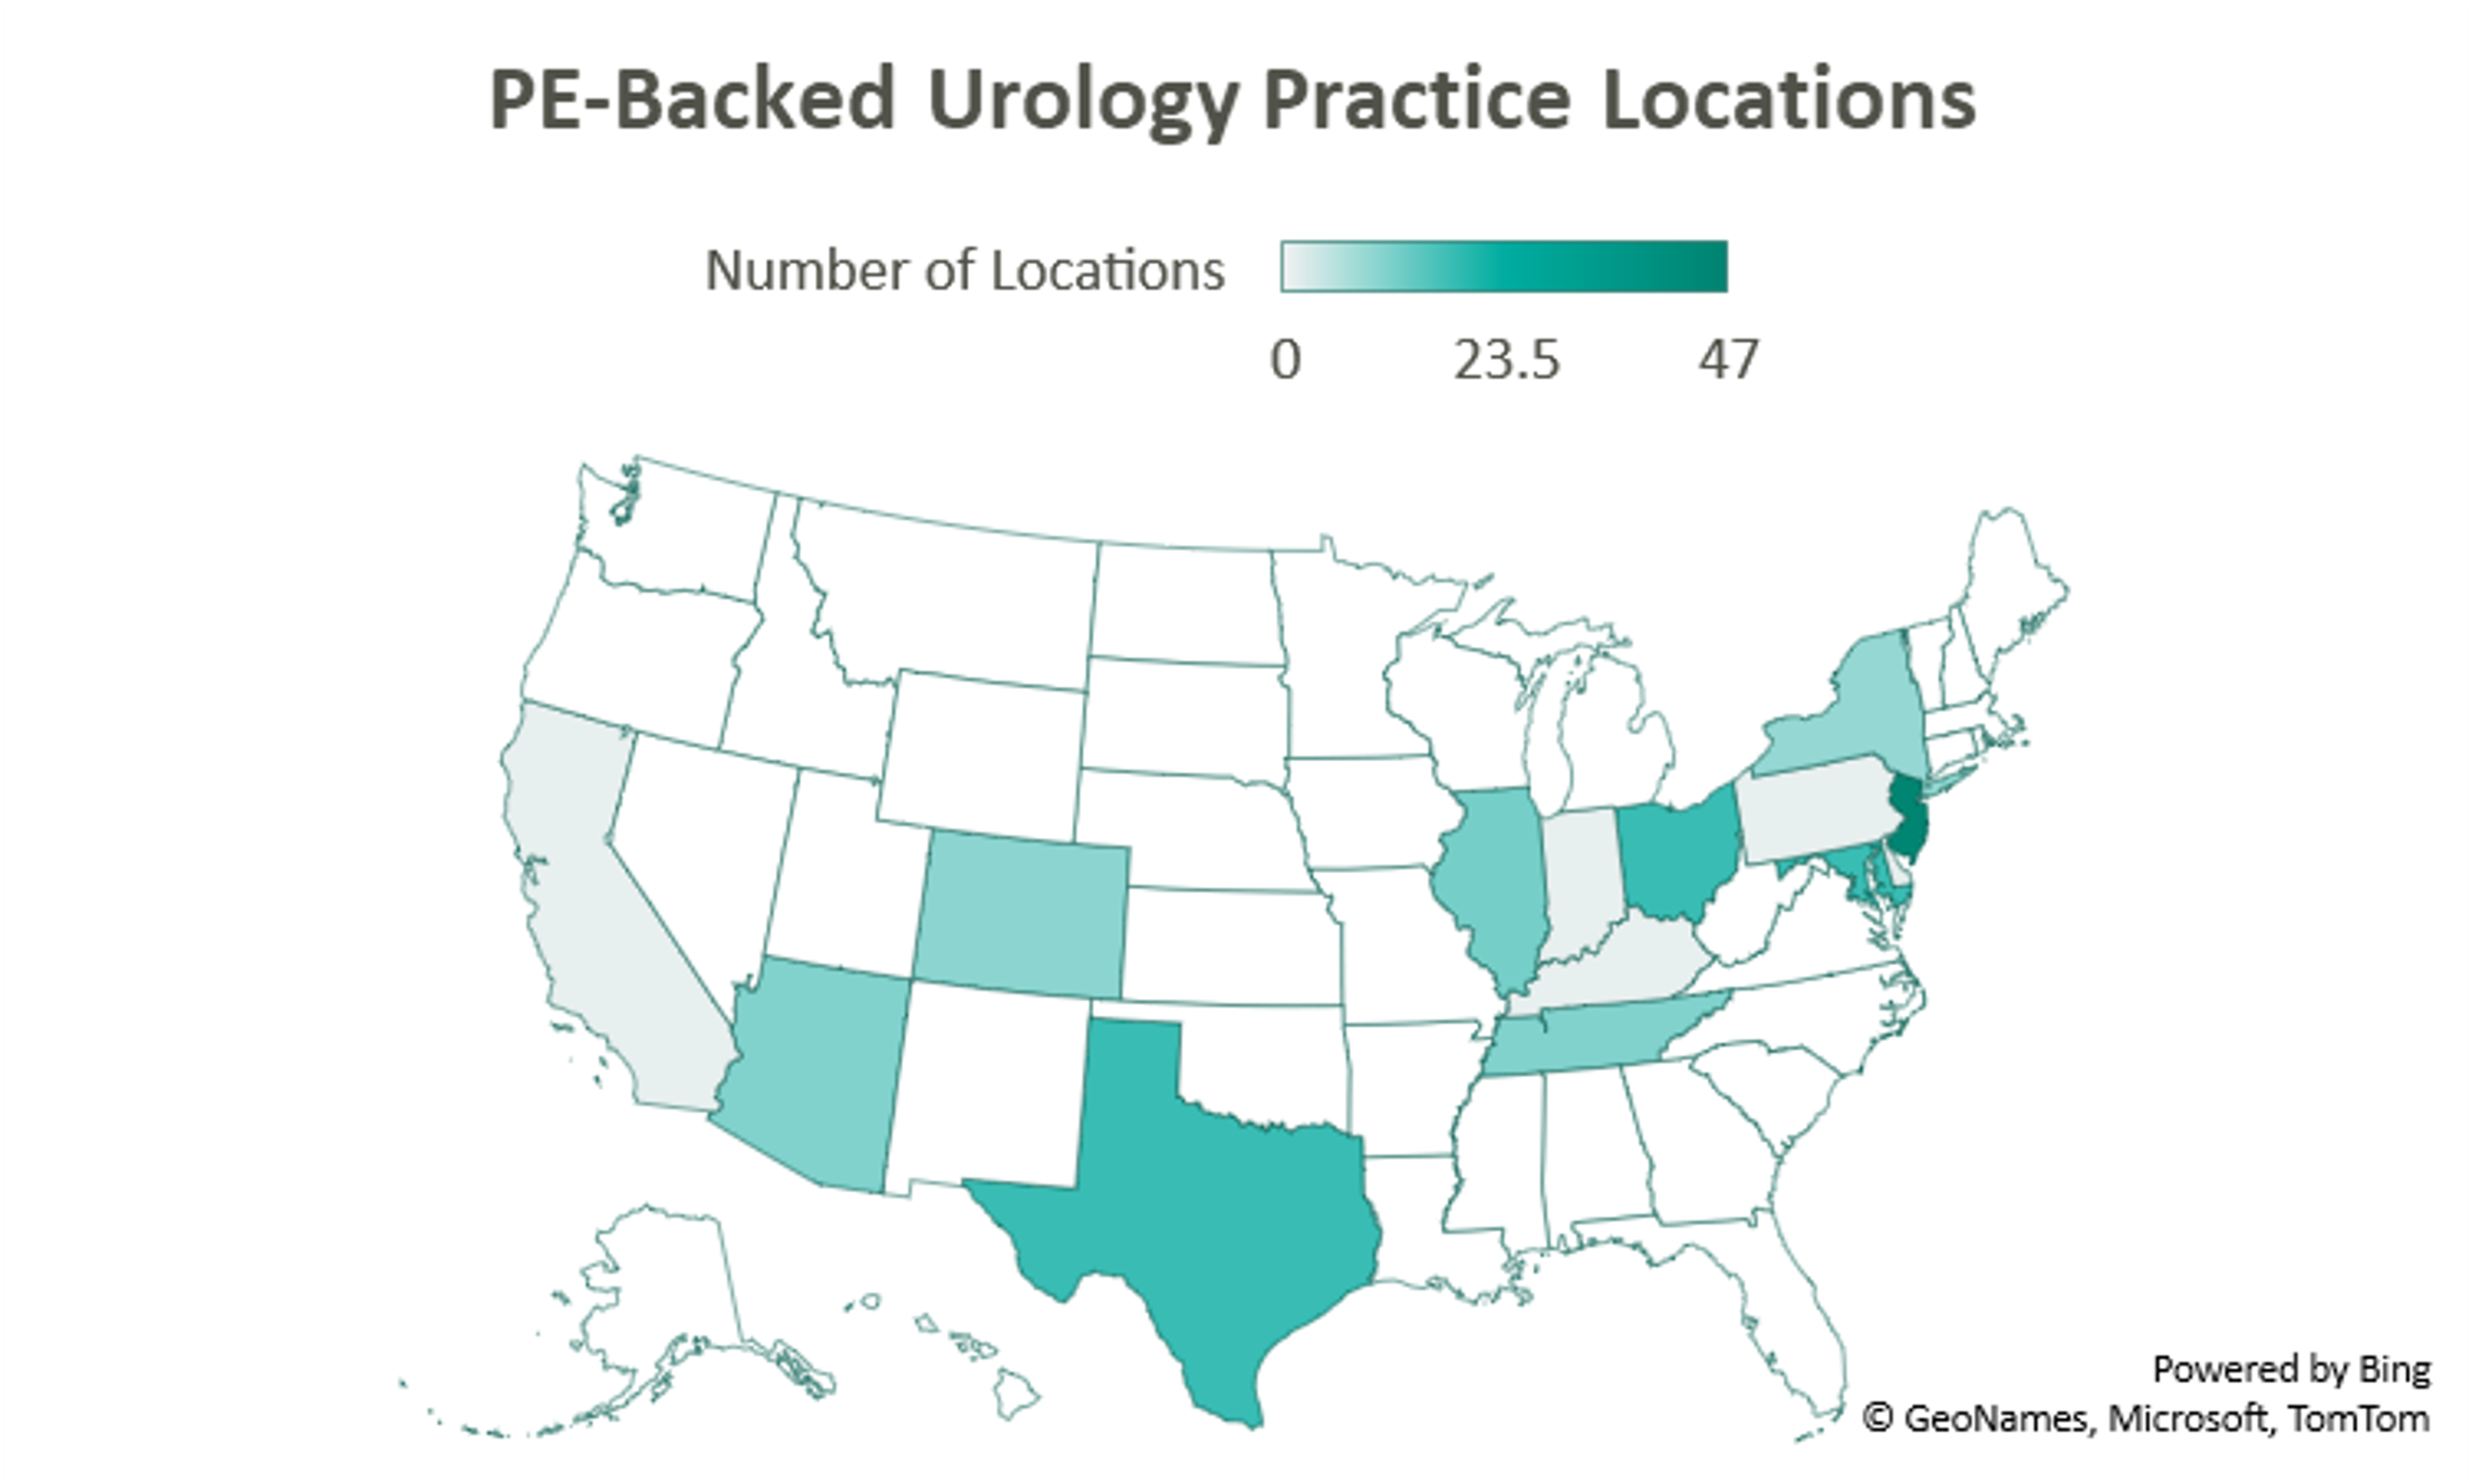

Since acquiring Maryland’s Chesapeake Urology, Audax Private Equity’s UUG has further expanded its footprint both locally in Maryland, as well as nationally. Most recently, UUG has entered Arizona markets through its partnership with Arizona Urology Specialists in late 2019 and additional affiliations with Arizona Institute of Urology and Urological Associates of Southern Arizona in January of this year. Through this most recent partnership, UUG now operates out of 25 offices in Delaware and Maryland, 11 facilities in Tennessee, 10 offices in Colorado, and 23 locations in Arizona. With these locations and over 220 physicians, UUG remains committed to providing accessible care. [4]

Prospect Hill Growth Partners (formerly known as J.W. Childs Associates) partnered with New Jersey Urology (“NJU”), a practice comprised of 96 providers in 46 New Jersey locations, to form Urology Management Associates (“UMA”) in September 2018. [5] NJU, having previously merged with Delaware Valley Urology in April 2018, represented the largest group of urologists in the United States at the time. Since then, UMA has expanded through a partnership with Premier Urology Group in September 2019 and Urology Care Alliance in December 2019. This latest affiliation expanded the platform’s presence in New Jersey and established its stake in Pennsylvania. UMA currently has over 150 providers and operates out of 64 locations, including 6 cancer treatment centers. [6]

A 2018 strategic investment by NMS Capital in Central Ohio Urology Group launched US Urology Partners as an employment alternative for practices wanting to maintain their independence. As of August 2019, the hope of the organization’s CEO Mark Cherney was to grow US Urology Partners’ roughly $50M in revenue 10x in the next 3-5 years. Cherney also indicated that urology may be the next physician specialty to see significant consolidation, stating that “while the other physician specialties such as dermatology, dental and ophthalmology have seen heavy M&A activity in recent years, urology has remained relatively untapped for sponsor investment.” [7] Cherney cites shrinking rates of reimbursement, growing administrative costs, a complex regulatory environment, and a lack of independence as deterrents to hospital employment, while a national platform partnership on the other hand can provide “greater management support and financial strength.” [8] The group most recently partnered with Associated Medical Professionals of New York, a nearly 30-physician practice operating out of 9 locations throughout the Central New York region. Ancillary services offered by the practice include radiation oncology, pathology, imaging, lithotripsy services, as well as clinical research. [9]

Another big presence in the space is Lee Equity Partners, who in June 2020 acquired and merged Integrated Medical Professionals and The Urology Group to form Solaris Health. The goal of Solaris “is to build a national platform that attracts leading independent urological partners who are committed to providing quality and value in healthcare.” [10] The platform has since expanded from its origins in New York, Ohio, Kentucky, and Indiana into Pennsylvania through a partnership with MidLantic Urology and, most recently, into Illinois through an affiliation with Chicago’s Associated Urological Specialists in March of this year. With more than 262 providers, Solaris now operates out of more than 11 sites in six states. [11]

With its formal acquisition of Texas-based Urology Austin in October 2020, Gauge Capital established Urology America, a fully integrated urology network providing comprehensive urologic care. The largest urology practice in the metro Austin area, Urology Austin brought 18 locations and over 50 providers to the platform. Also included in the transaction were Urology Austin’s clinical research department, patient navigation programs, pelvic floor physical therapy, the Austin Center for Radiation Oncology, as well as a nationally accredited in-house pharmacy and pathology laboratory. Urology America is currently seeking to partner with urology practices nationally recognized as innovators and leaders in the field. [12]

New to the space is Triton Pacific Capital Partners. This May, the Los Angeles private equity firm partnered with Genesis Healthcare Partners (“GHP”), a Southern California urology group with 48 providers and 15 locations, to establish Urology Partners of America (“UPA”). At the time of the transaction, GHP represented the largest independent urology group on the West Coast. With a current focus on further expansion across the Western States, the platform has a long-term goal, according to UPA CEO, Marshal Salomon, of building “the business to 200+ physicians within the next few years.” [13]
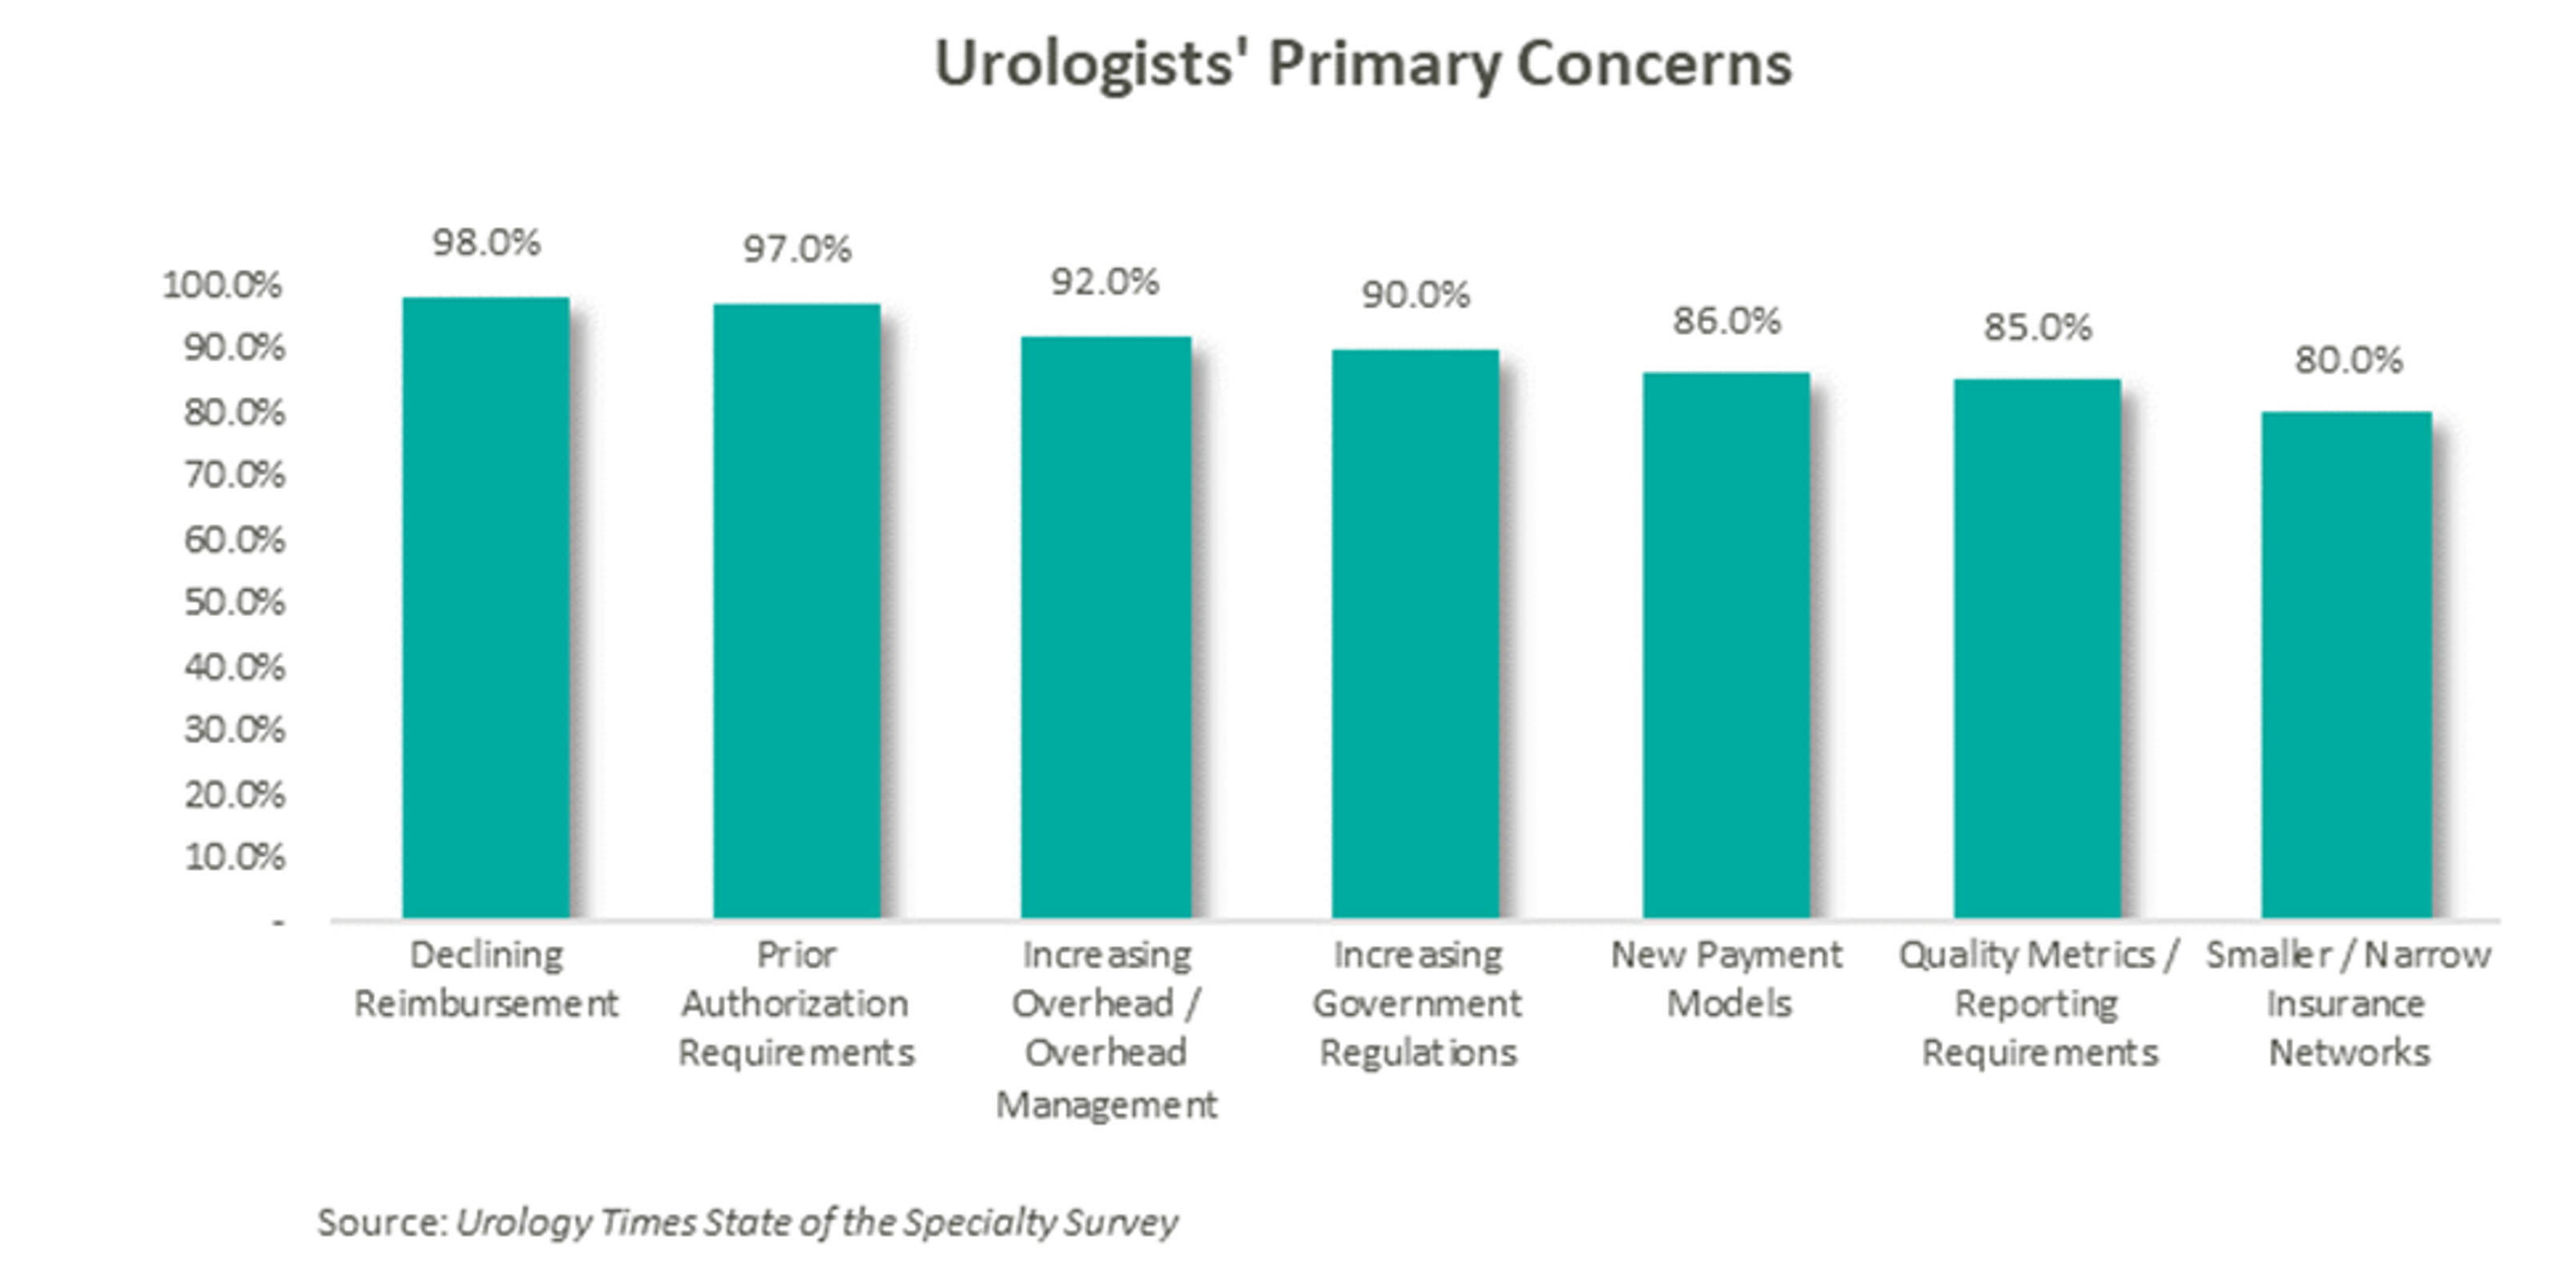
According to data compiled by Urology Times, over 90% of urologists surveyed are concerned about declining reimbursement trends, growing regulation, and increasing overhead costs. [14] Furthermore, a study published in the July 2021 Issue of The Journal of Urology revealed that the average rate of reimbursement per urologic procedure decreased by an average of 0.4% per year from 2000 to 2020 before adjusting for inflation. [15]
As a result of these pressures, independent physicians are seeking alternative employment structures to private practice. PE firms are an attractive option due to their ability to alleviate some of the administrative burden, strengthen payor negotiations though scale, provide access to additional capital and allow the providers to focus on their clinical services. With this model, physicians receive upfront compensation from the acquisition and may retain an equity position in the new entity. They often agree to a reduction in their historical compensation as a trade-off for the promise of future equity returns and current liquidity. The success of the model depends on the ability of the PE firm to provide both operational and financial value to the practice and deliver on earnings repair. Otherwise, shareholder physicians may not continue to perform at historical levels, and non-shareholder physicians may begin to reconsider private practice.
Since the formation of United Urology Group, there has been a trend of PE-backed urology practice consolidation over the past 5 years. Given that most urology visits are with patients over the age of 65 and that nearly 20% of the population is expected to be 65 or older by 2030, demand for urologic services is only expected to increase. [16] With increasing demand, fragmentation, and a complex regulatory environment, continued consolidation should be expected in the urology space. The ability to deliver on earnings recapture through the successful implementation of economies of scale will ultimately determine the outcome of these platforms, as the value of the model hinges on the loyalty of the urologists.
[1] https://us-uro.com/wp-content/uploads/2019/09/mergermarket-urology-private-equity.pdf
[2] https://solarishealthpartners.com/wp-content/uploads/2021/04/Private_Equity_and_Urology_-Urol_Clin_N_Am_48_2021_233%E2%80%93244.pdf
[3] https://www.auanet.org/research/research-resources/aua-census/census-results
[4] https://www.unitedurology.com/news/
[5] https://njurology.com/j-w-childs-associates-forms-urology-management-associates-with-new-jersey-urology/
[6] https://njurology.com/about-us/news/
[7] https://us-uro.com/wp-content/uploads/2019/08/us-urology-in-mergermarket.pdf
[8] https://us-uro.com/2019/08/27/u-s-urology-partners-supports-growth-of-independent-practices/
[9] https://us-uro.com/2020/11/23/u-s-urology-partners-announces-partnership-with-associated-medical-professionals-of-new-york/
[10] https://solarishealthpartners.com/wp-content/uploads/2020/09/LEE-EQUITY-INTEGRATED-MEDICAL-PROFESSIONALS-AND-THE-UROLOGY-GROUP-FORM-SOLARIS-HEALTH.pdf
[11] https://solarishealthpartners.com/news/
[12] https://www.urologyamerica.com/october-2020-2/
[13] https://www.mygenesishealth.com/about-genesis/news/2021/05/triton-pacific-announces-partnership-with-genesis-healthcare-partners.html
[14] https://www.urologytimes.com/view/state-specialty-survey-top-pain-points-are-revenue-drop-prior-auth?page=2
[15] https://www.auajournals.org/doi/pdf/10.1097/JU.0000000000001655
[16] https://www.merritthawkins.com/uploadedFiles/Merritt-Hawkins-urology-trends-white-paper-2021.pdf
Contributors: Blake Madden, Chris Madden, Alex Malin, Eric Noyer, and Olivia Wilson
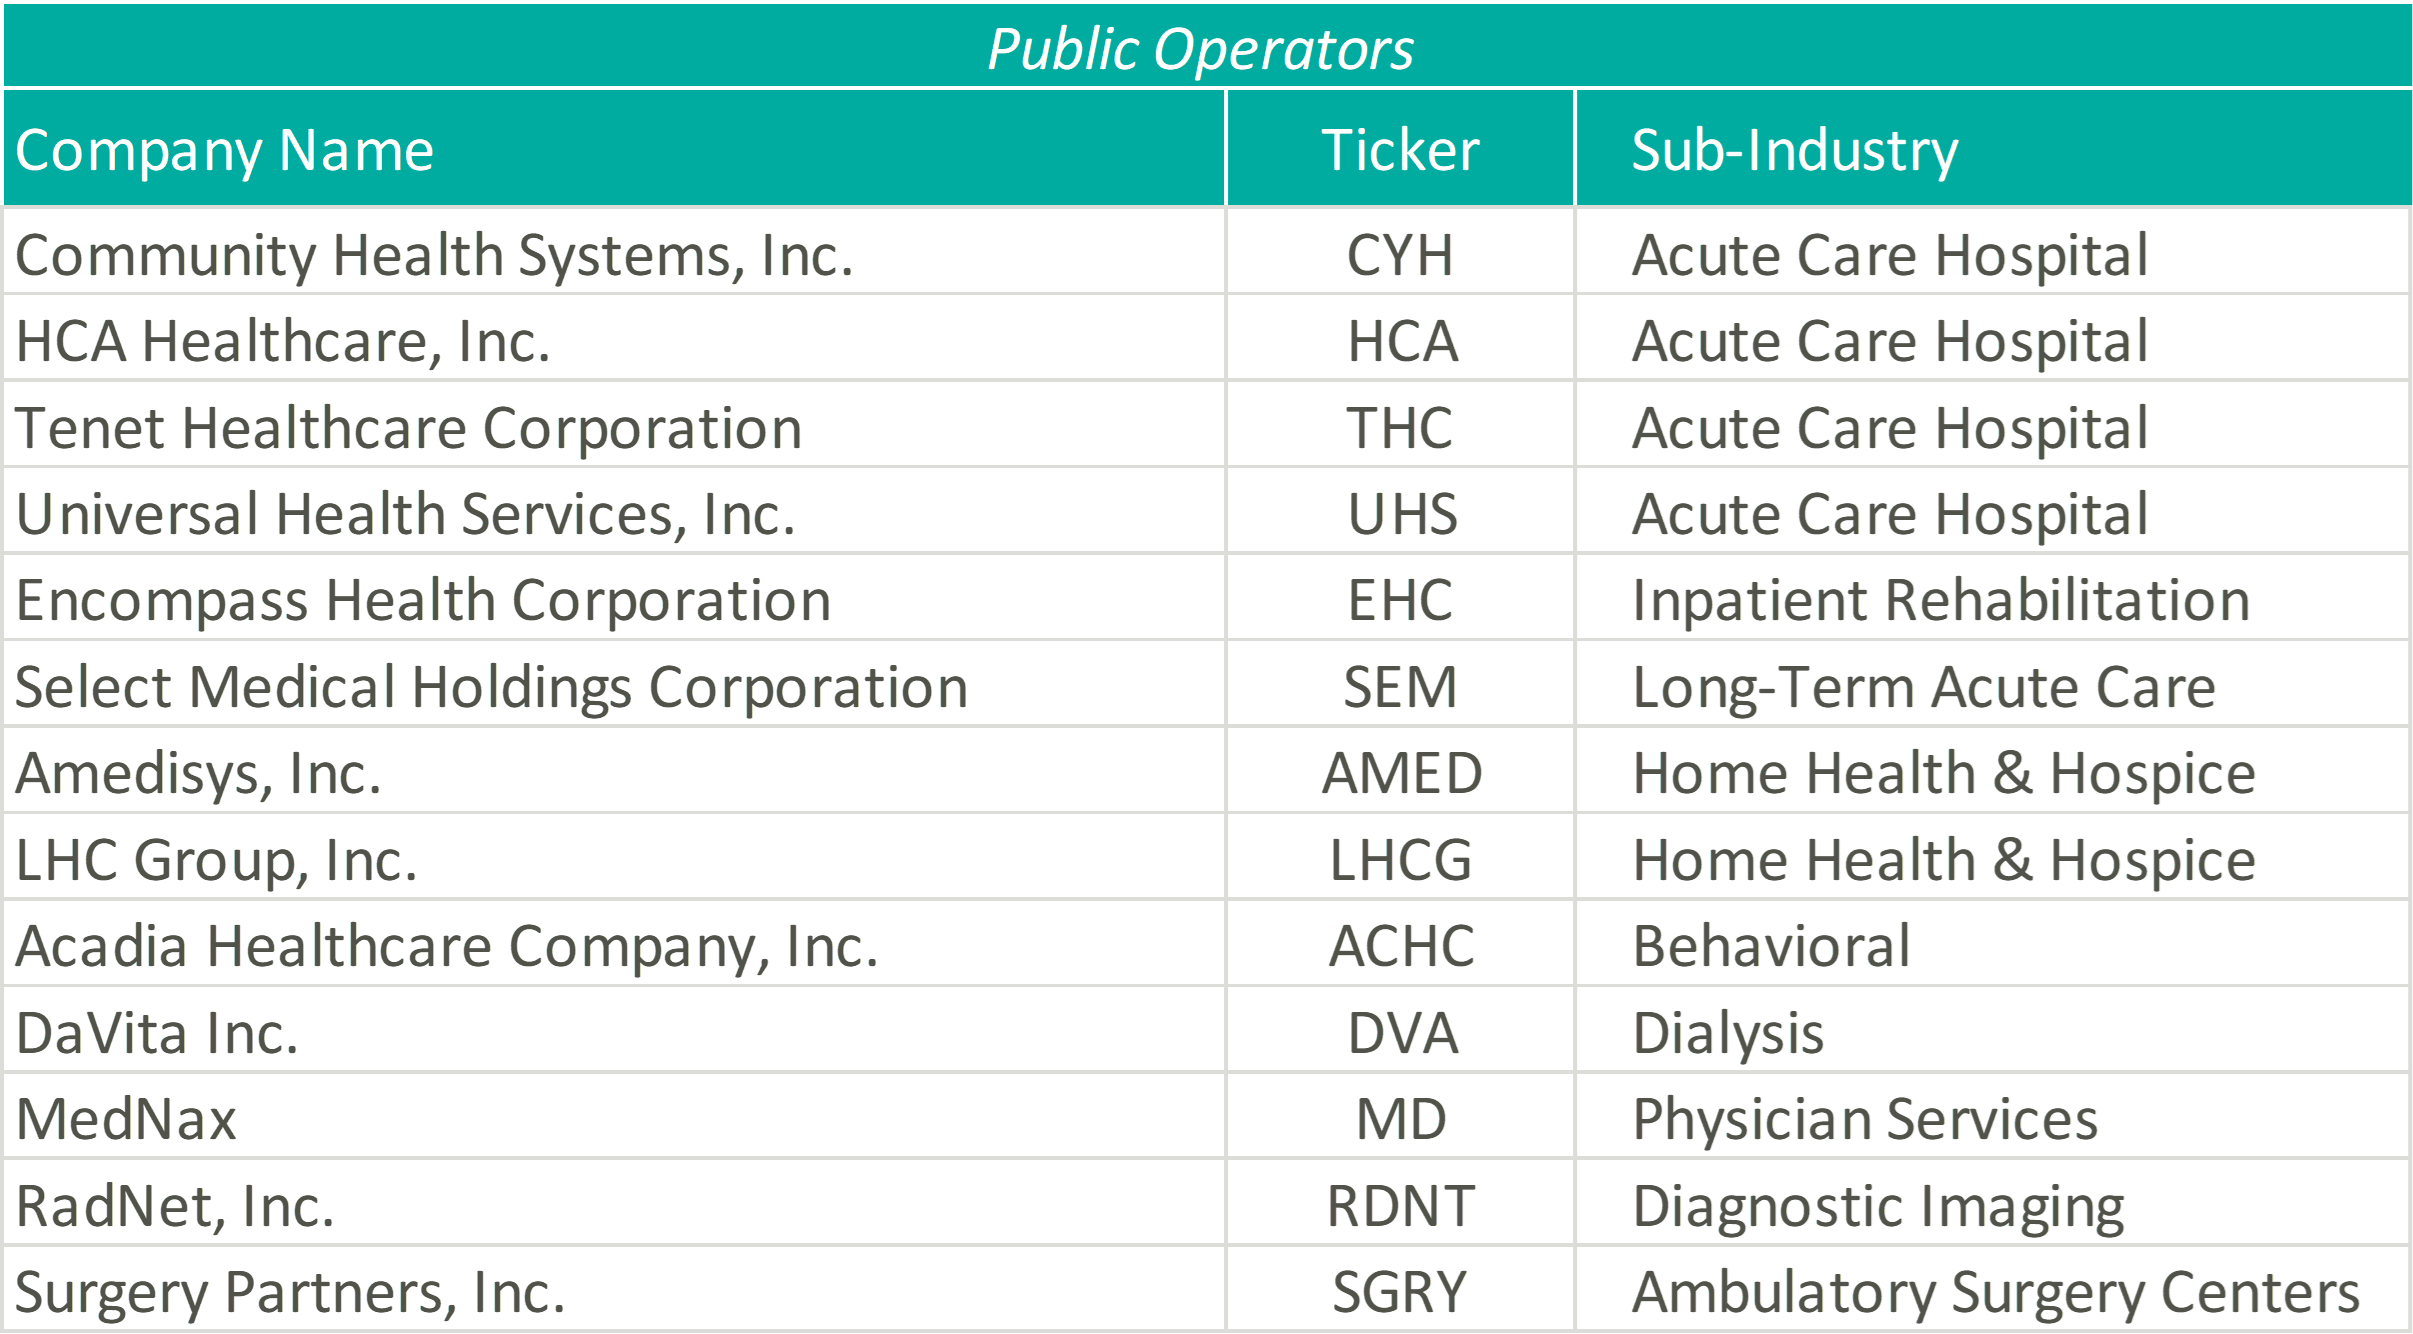
In March 2020, the coronavirus (“COVID-19”) pandemic began reshaping the world economy. At the time, many factors about the disease were unknown and impossible to predict. Some of these factors include the evolution of the disease, timeline to produce a vaccine, and the economic effects of worldwide lockdowns. The healthcare industry was uniquely affected, and many healthcare operators felt that they were not in the position to forecast future financial performance. After a year of operations in a COVID-19 impacted world, operators resumed the disclosure of earnings guidance. VMG analyzed guidance figure trends from publicly traded acute care hospitals, post-acute providers, home health and hospice companies, and a variety of other operators to better understand how the industry is recovering and evolving as the pandemic continues.
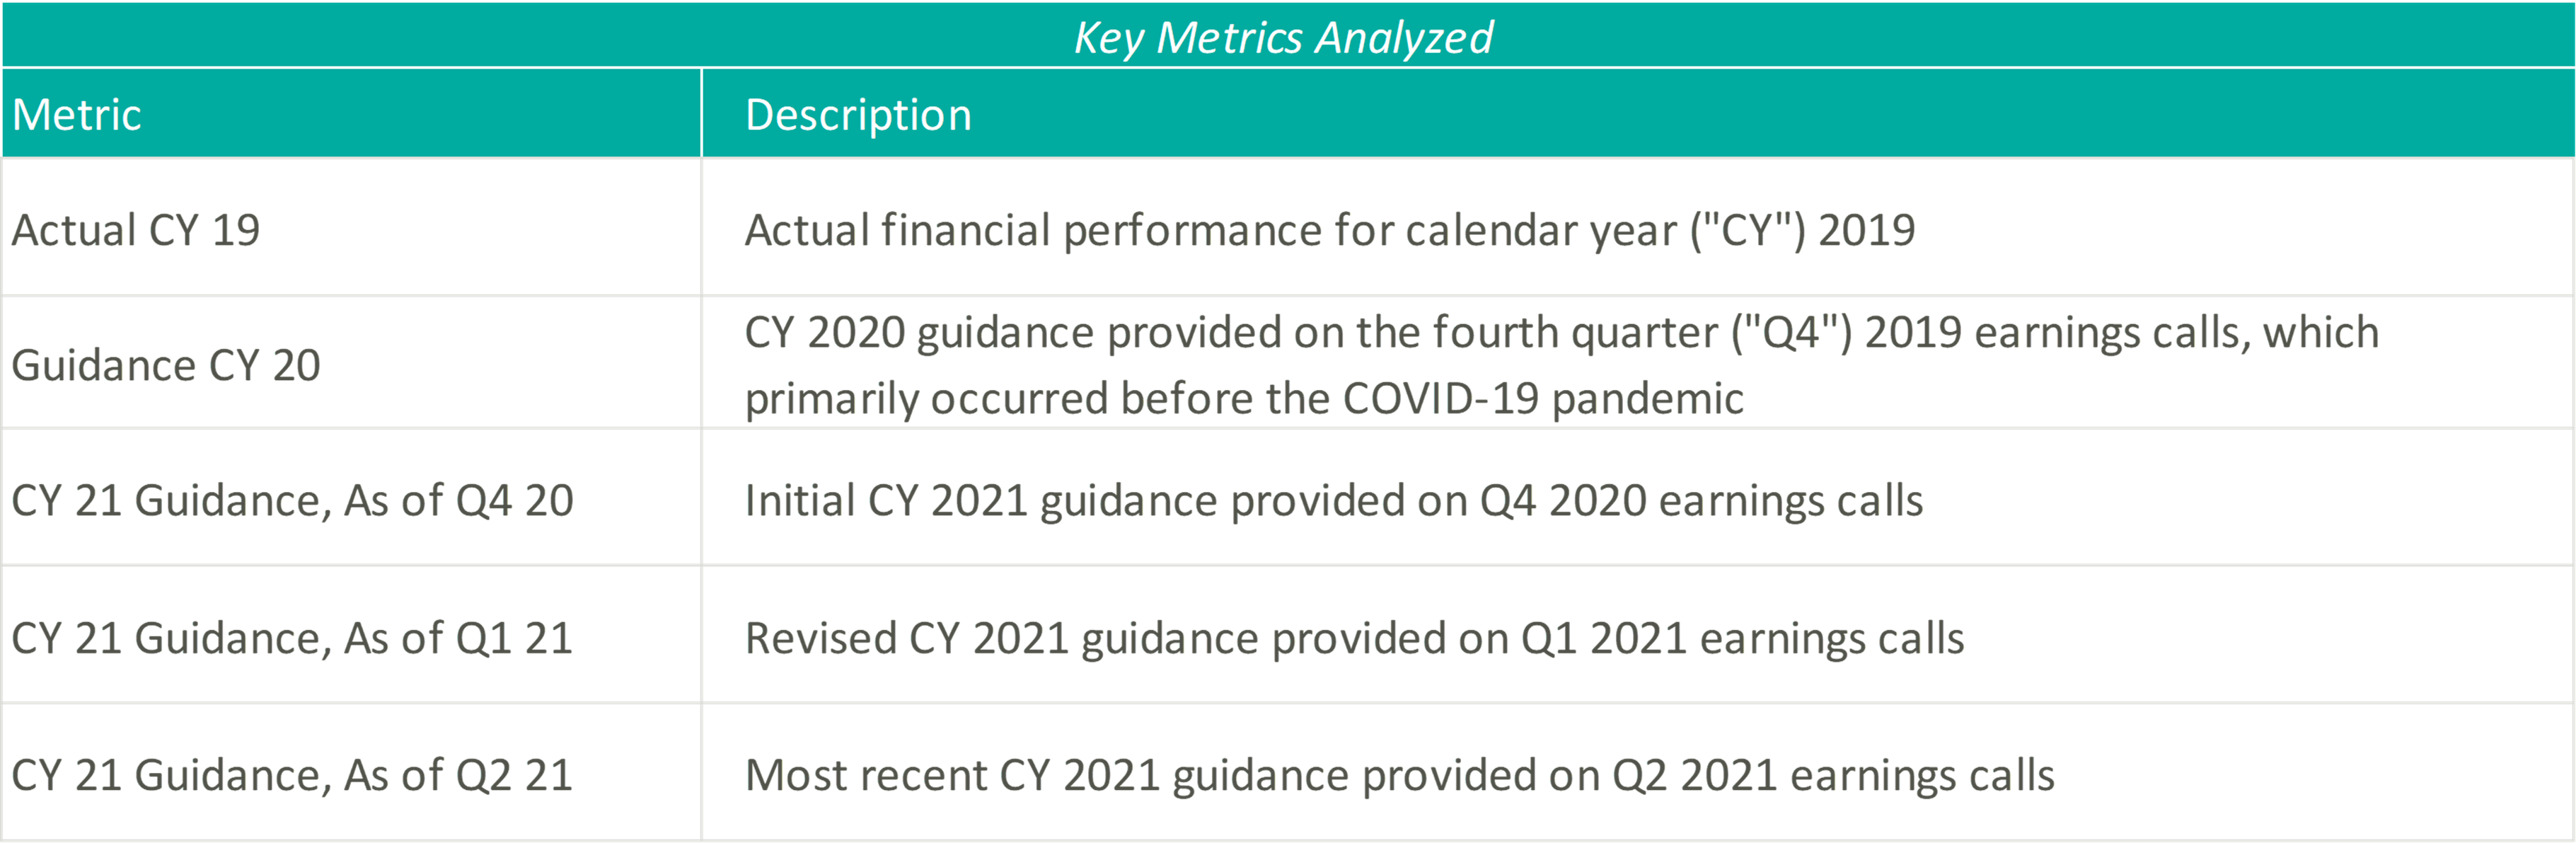
Please see below for a list of the companies examined, as well as further detail regarding the various metrics considered.
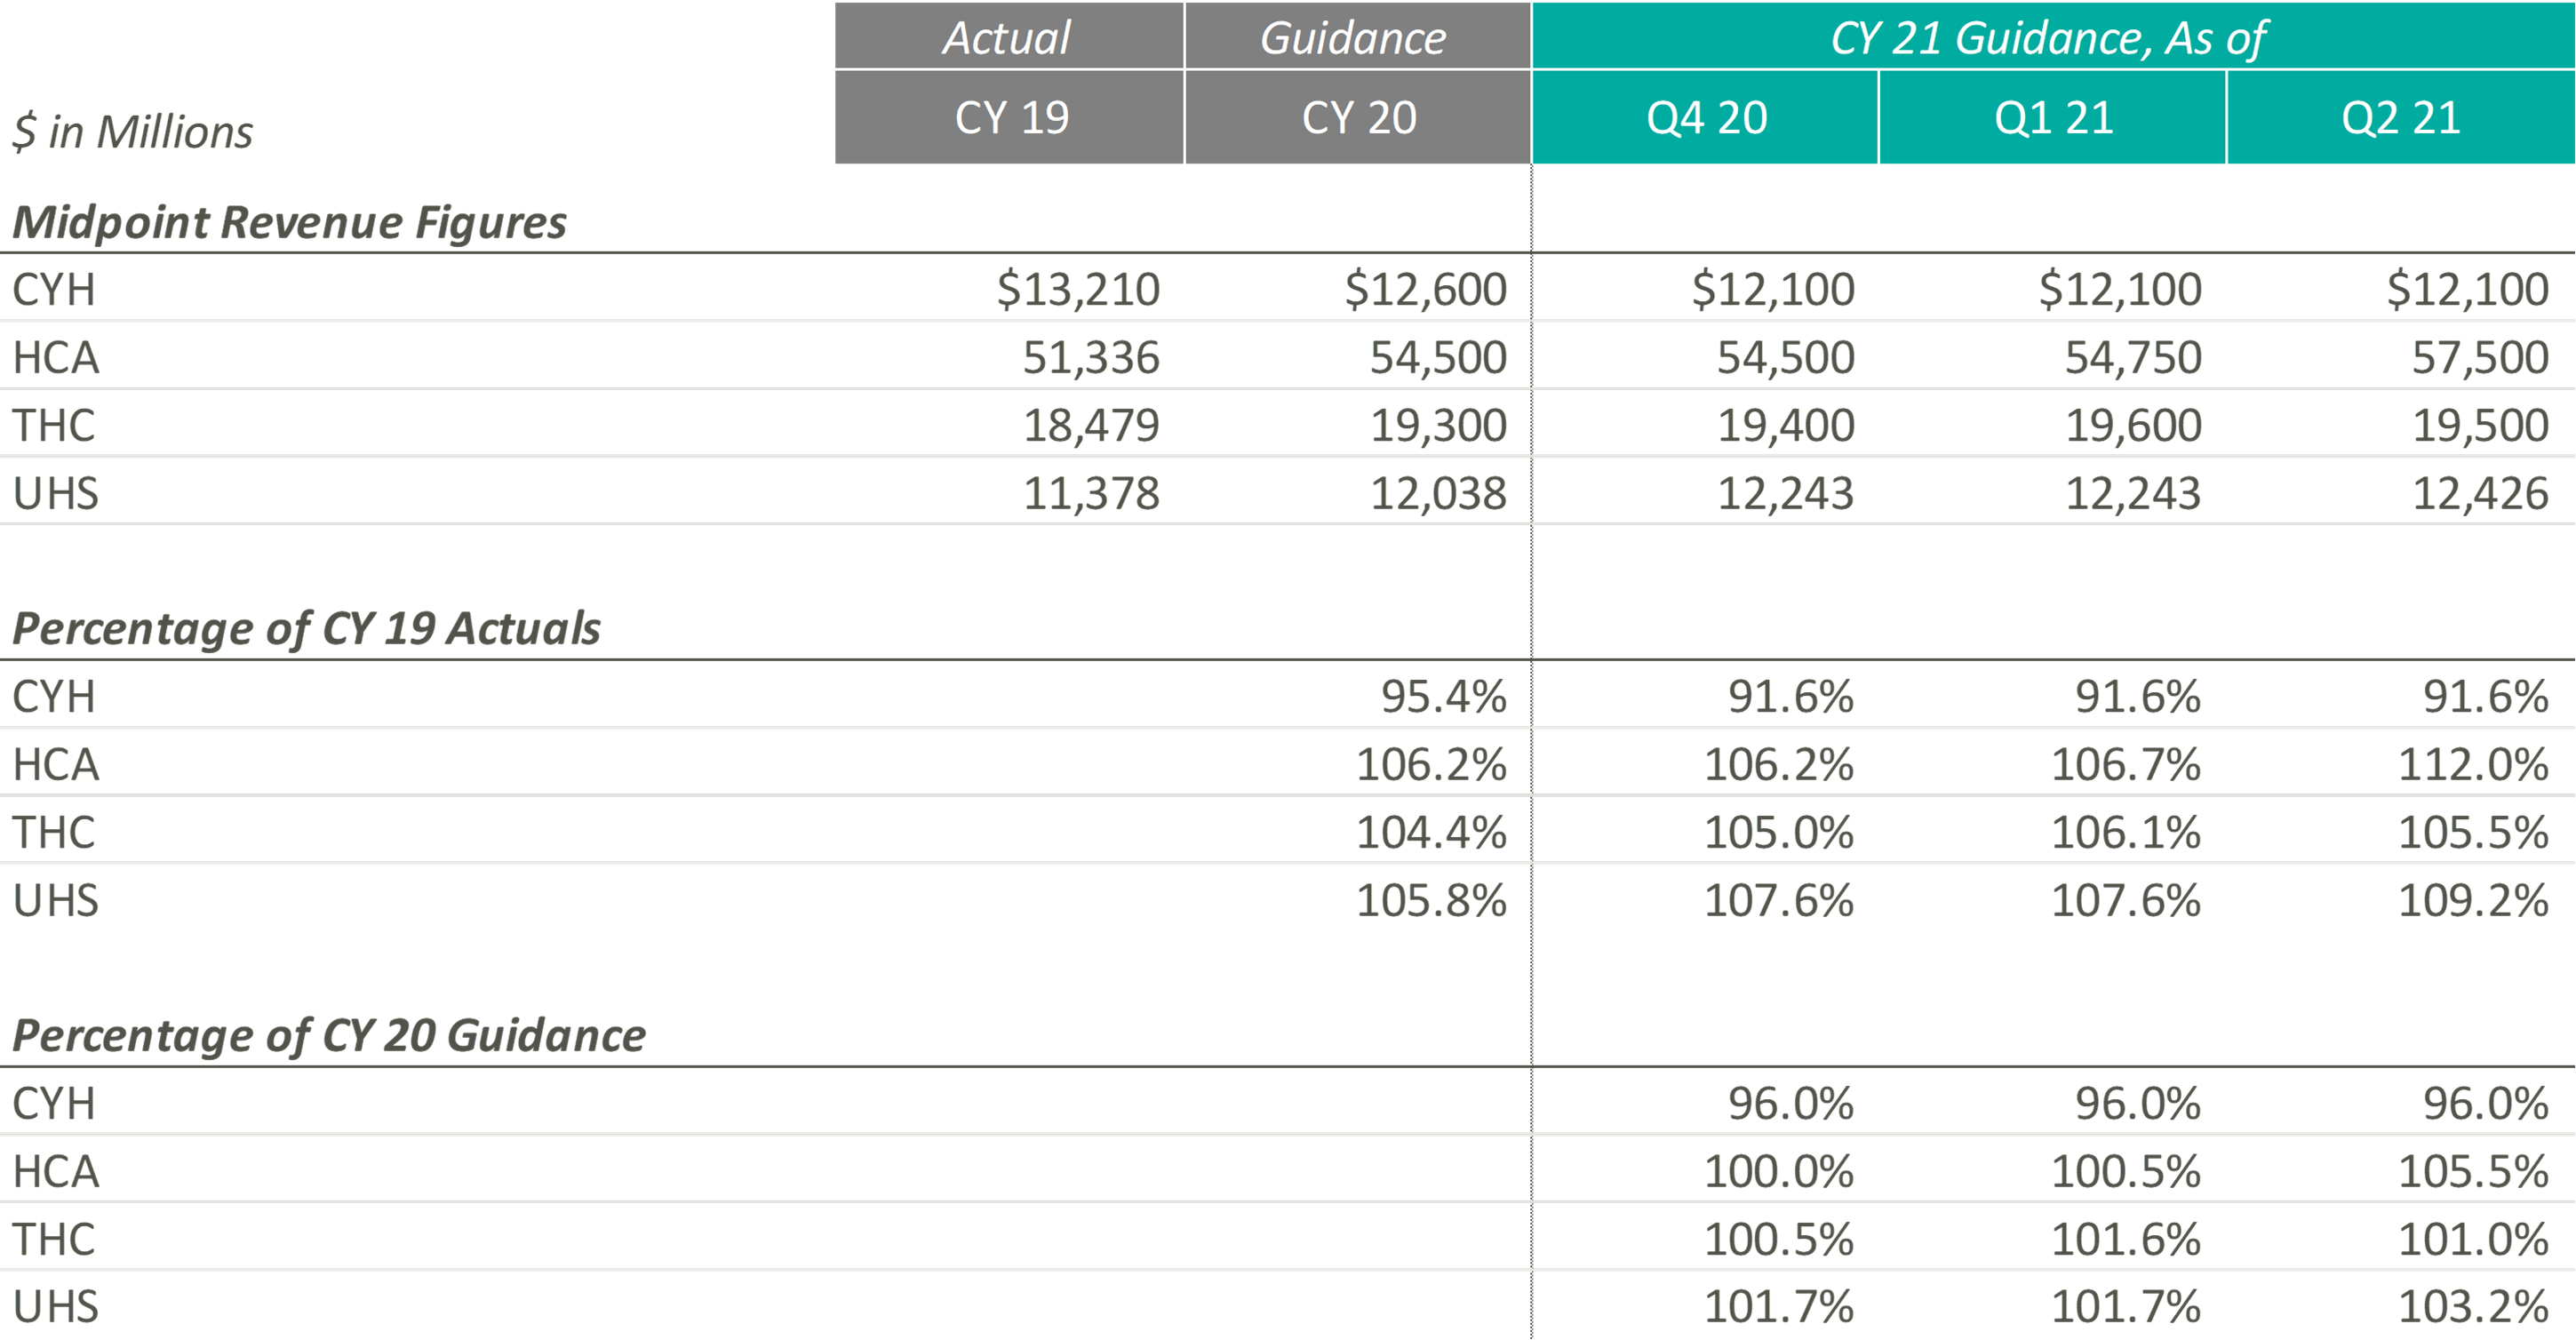
The pandemic’s grip on acute care moderated through Q2 2021 resulting in significant revenue increases for the public hospital operators. Management, often with a tone of surprise, cited strong demand for services as the primary driver of the revenue upticks and reports of double-digit volume growth frequented earnings call highlights.
Samuel N. Hazen, CEO of HCA noted, “On a year-over-year basis, revenues grew 30.0% to $14.4 billion… To highlight a few areas, outpatient surgeries were up 53.0%, emergency room visits grew 40.0%, cardiology procedures increased 41.0%, and urgent care visits were up 82.0%.”
Similarly, Tim L. Hingtgen, CEO and Director of CYH revealed, “For the second quarter, on a same-store basis, net revenue increased 30.2% year-over-year… For the full quarter, year-over-year, same-store admissions increased 17.0%, while adjusted admissions were up 28.5%. Surgeries increased 43.7% and ER visits were up 39.2%.”
As a result of the performance of Q2 2021, public hospital operators further increased their guidance for CY 2021. Still, 2021 revenue guidance remains relatively in-line with pre-COVID 2020 estimates indicating revenue stagnated in 2020. The outlier, CYH, completed a planned divestiture program at the end of 2020, making it difficult to compare post-COVID revenue guidance to the pre-COVID figures.

In terms of profitability, HCA and THC were the earliest Acute Care Hospital operators to predict CY 2021 adjusted EBITDA to exceed the figures estimated at the beginning of CY 2020 and CY 2019, which they publicly estimated as early as Q4 2020. In light of the positive results reported during Q2 2021, CYH and UHS joined their peers in predicting favorable improvements in profitability. As of Q2 2021, the public hospital operators were unanimous in their guidance for the full year in terms of exceeding pre-COVID CY 2020 adjusted EBITDA.
Steve G. Filton, CFO and Secretary of UHS noted, “This robust recovery in volumes exceeded the pace of our original forecast and drove the favorable operating results even in the face of continuing labor pressures in both of our business segments.”
On a margin basis, all Acute Care Hospital operators have estimated CY 2021 adjusted EBITDA margins to exceed CY 2019 and 2020 levels. The pandemic has forced Acute Care Hospitals to take a closer look at their expense structures and streamline operations, leading to the predicted EBITDA margin growth.
The management teams have all reacted positively to a successful first half of 2021, as all four operators expect CY 2021 revenue and adjusted EBITDA levels near or above their initial CY 2021 estimates. However, although the guidance figures seem positive, CY 2021 levels are only at or slightly above pre-COVID CY 2020 expectations, proving that these operators are remaining cautious when providing forward-looking estimates. The Acute Care Hospital industry, while showing signs of recovery after the initial peak of the pandemic, is still experiencing the effects of the COVID crisis, and the recent rise of the Delta variant could further exacerbate the impacts that the COVID-19 pandemic had on the Acute Care Hospital providers.
During UHS’ Q2 2021 earnings call, Steve G. Filton, CFO and Secretary of UHS, cautioned, “During the past 4 to 6 weeks, many of our hospitals have experienced significant surges in the number of COVID patients, and it is not evident that this surge has yet reached its peak. Given the uncertain impact of this most recent surge on non-COVID volumes and on labor shortages, we based our guidance for the second half of the year, primarily on our original internal forecast.”

In CY 2021, Post-Acute Care operators expect growth above both CY 2019 revenues and expected pre-COVID CY 2020 revenues. Most notably, when these operators released their original CY 2020 guidance, they projected mid-single digit growth. Looking at their CY 2021 guidance as a percentage of CY 2019 levels and as a percentage of CY 2020, it appears that they expect to still achieve mid-single digit growth on a compounded annual basis from CY 2019. These data points suggest that the Post-Acute Care operators’ growth trajectory was likely not hindered or set back a year by the COVID-19 pandemic.
Additionally, both Post-Acute Care operators have continued to raise their CY 2021 guidance over the past two quarters. During EHC’s most recent earnings call, management highlighted that the return of elective procedures has been fueling inpatient rehabilitation facility (“IRF”) discharge growth. In addition, EHC is experiencing growth in IRF revenue per discharge due to strong reimbursement rates, continued suspension of sequestration, improved discharge destination, and cost report adjustments. These tailwinds, along with the improvement of home health and hospice volumes and IRF M&A activities, resulted in the continued increase of revenue guidance for EHC.
Similarly, SEM has experienced a rebound in volumes in all four segments (i.e., IRFs, long-term acute care hospitals (“LTACHs”), occupational health, and outpatient rehabilitation) at levels well above pre-pandemic levels, resulting in the continued increase in CY 2021 guidance figures. As stated in SEM’s Q1 2021 earnings press release, “In March 2021, both Select Medical’s outpatient rehabilitation clinics and Concentra centers experienced patient visit volume approximating the levels experienced in January and February 2020, the months preceding the widespread emergence of COVID-19 in the United States.”
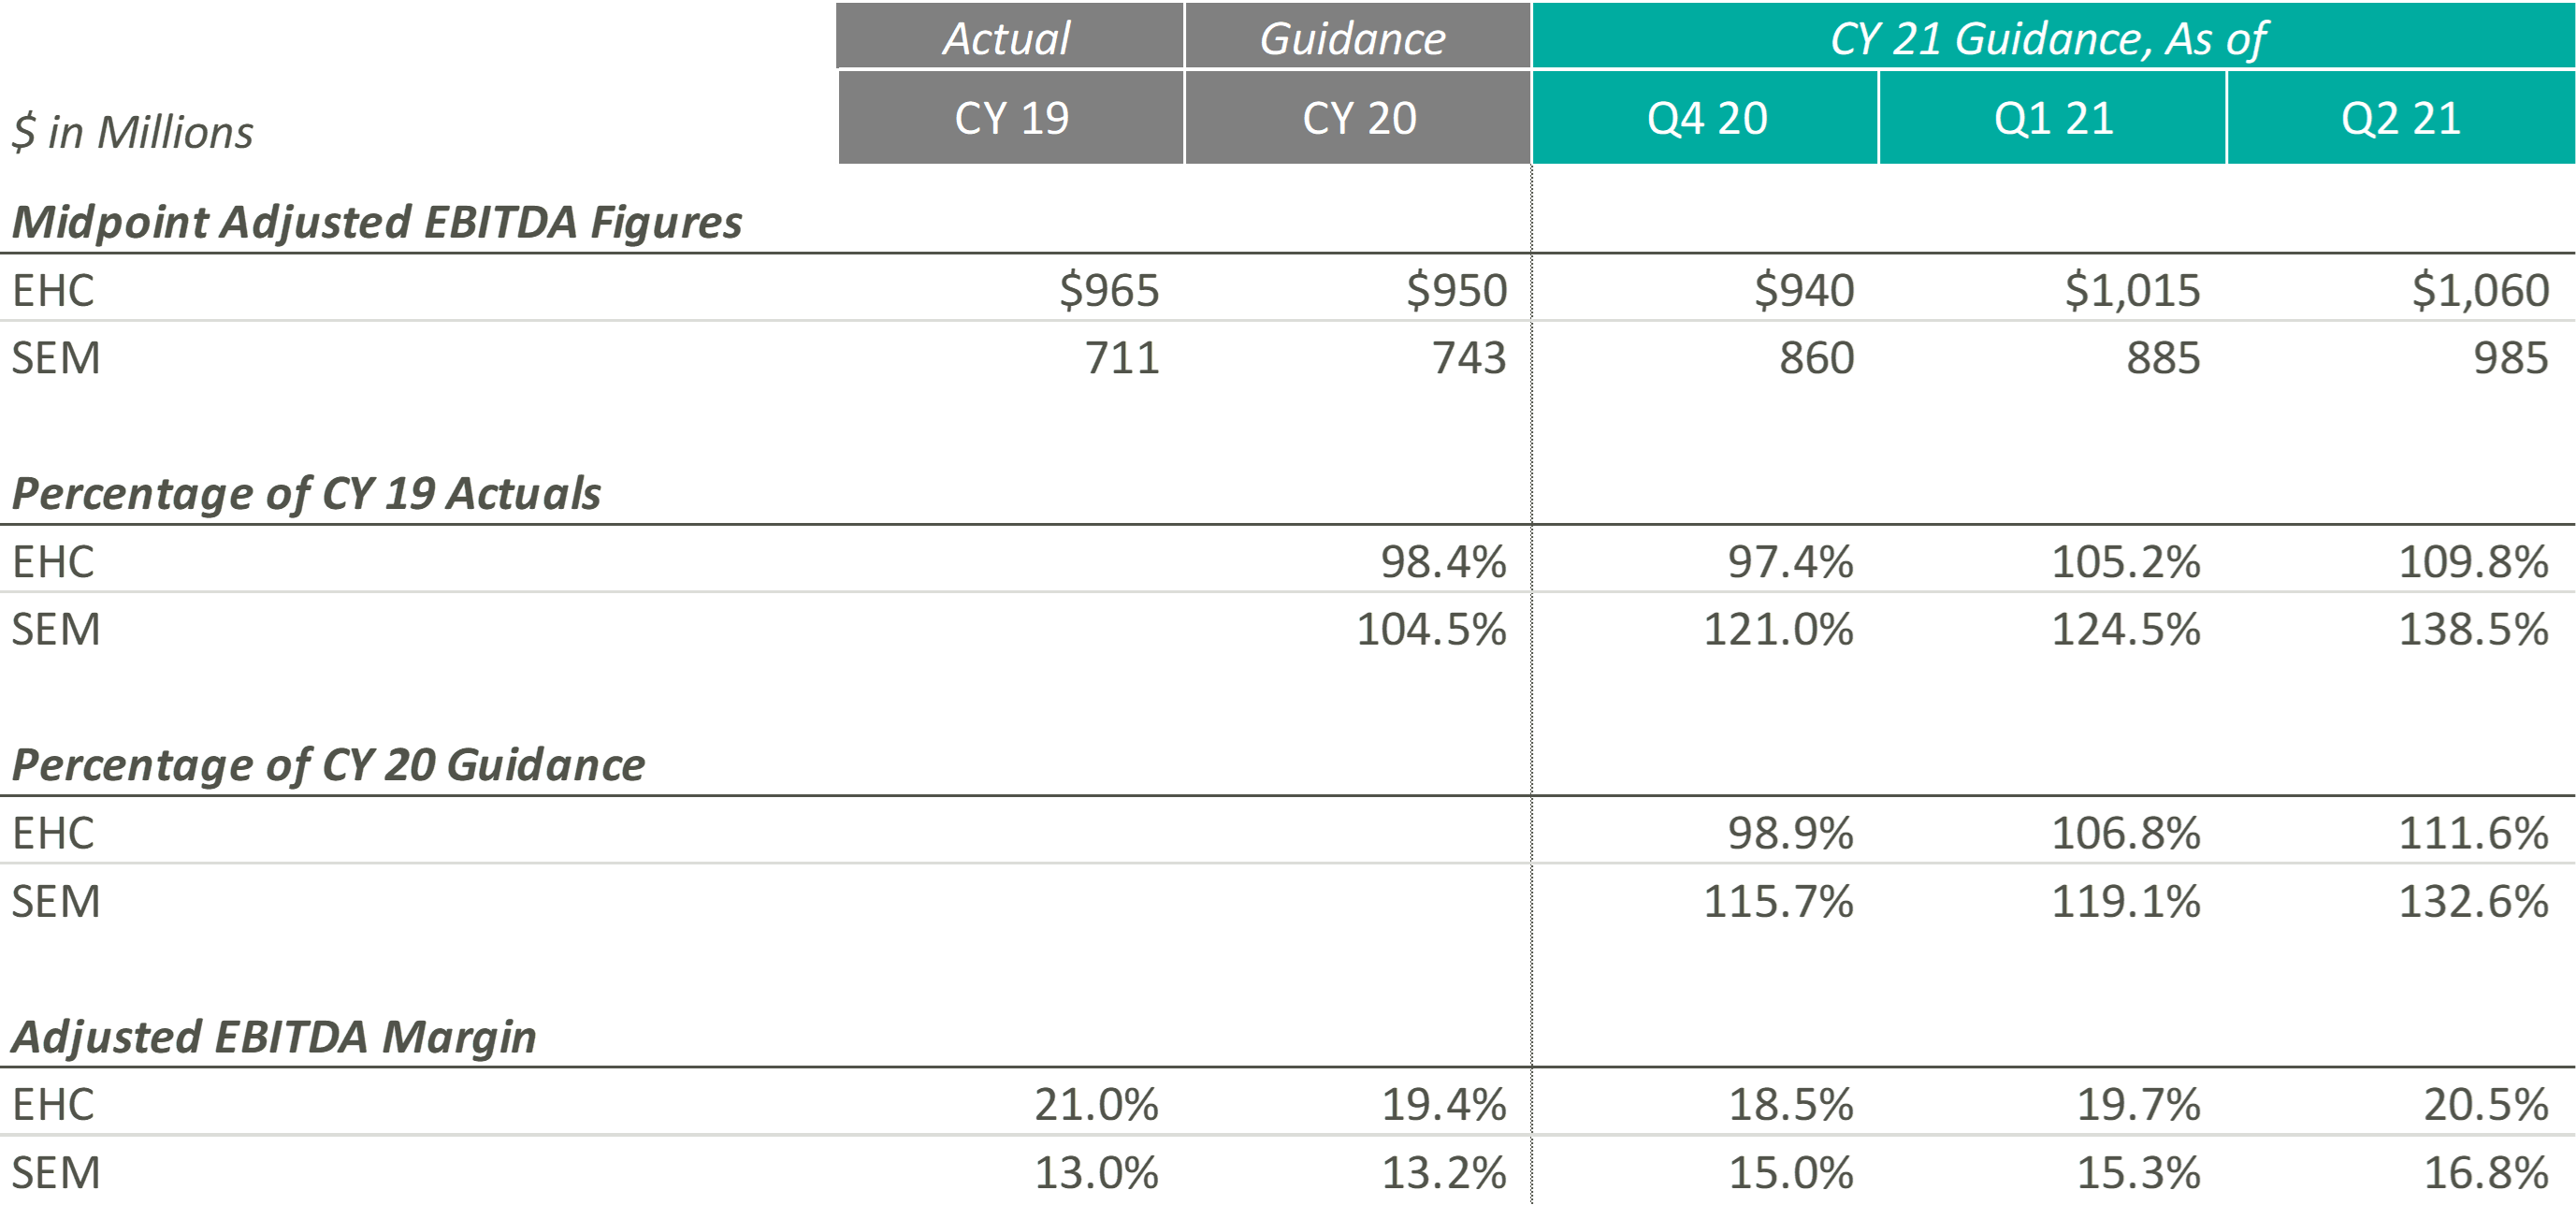
Similar to their CY 2021 revenue guidance figures, EHC and SEM have continued to raise their CY 2021 Adjusted EBITDA guidance ranges. According to EHC’s Q1 2021 earnings release, EHC increased CY 2021 guidance “to reflect Q1 performance and the extension of suspension of sequestration.” Similarly, in Q1 2021, SEM cited revenue growth as the primary driver of adjusted EBITDA growth, with revenue growth resulting from favorable pricing, a new joint venture, a higher acuity patient mix, increased reimbursement rates, and the suspension of sequestration.
Even with the COVID-19 pandemic affecting performance in CY 2020, SEM beat its original CY 2020 midpoint guidance figures by approximately $57.0 million, primarily driven by revenue growth in its inpatient segments. As SEM’s outpatient segments return, SEM’s Adjusted EBITDA performance continues to improve in CY 2021. During SEM’s Q2 2021 earnings call, the Co-Founder & Executive Chairman, Robert A. Ortenzio, stated, “In addition to the volume growth, the inpatient and outpatient rehabilitation hospitals and clinics posted their highest quarters for adjusted EBITDA in the history of the company.”
On the margin side, although EHC has continued to increase its expected CY 2021 Adjusted EBITDA margin throughout the past two quarters, management has cited pressures in nursing staffing across the country that may result in “a little bit of cost climb as we move into 2021 and throughout the year.” On the other hand, SEM has projected Adjusted EBITDA margins at levels well above those expected pre-pandemic. As SEM continues to raise their expected Adjusted EBITDA margin, management has noted that their expenses are being managed well, resulting in current Adjusted EBITDA margins that are “the highest in the history of the company.”
Overall, both Post-Acute Care operators have reacted positively to successful performances over the first half of CY 2021. To this point, Mark Tarr, CEO and President of EHC, noted “the combination of the return of our former market, along with new referral sources we’ve added throughout COVID, leave us very encouraged about the strong organic growth opportunities beginning in the back half of the year.”
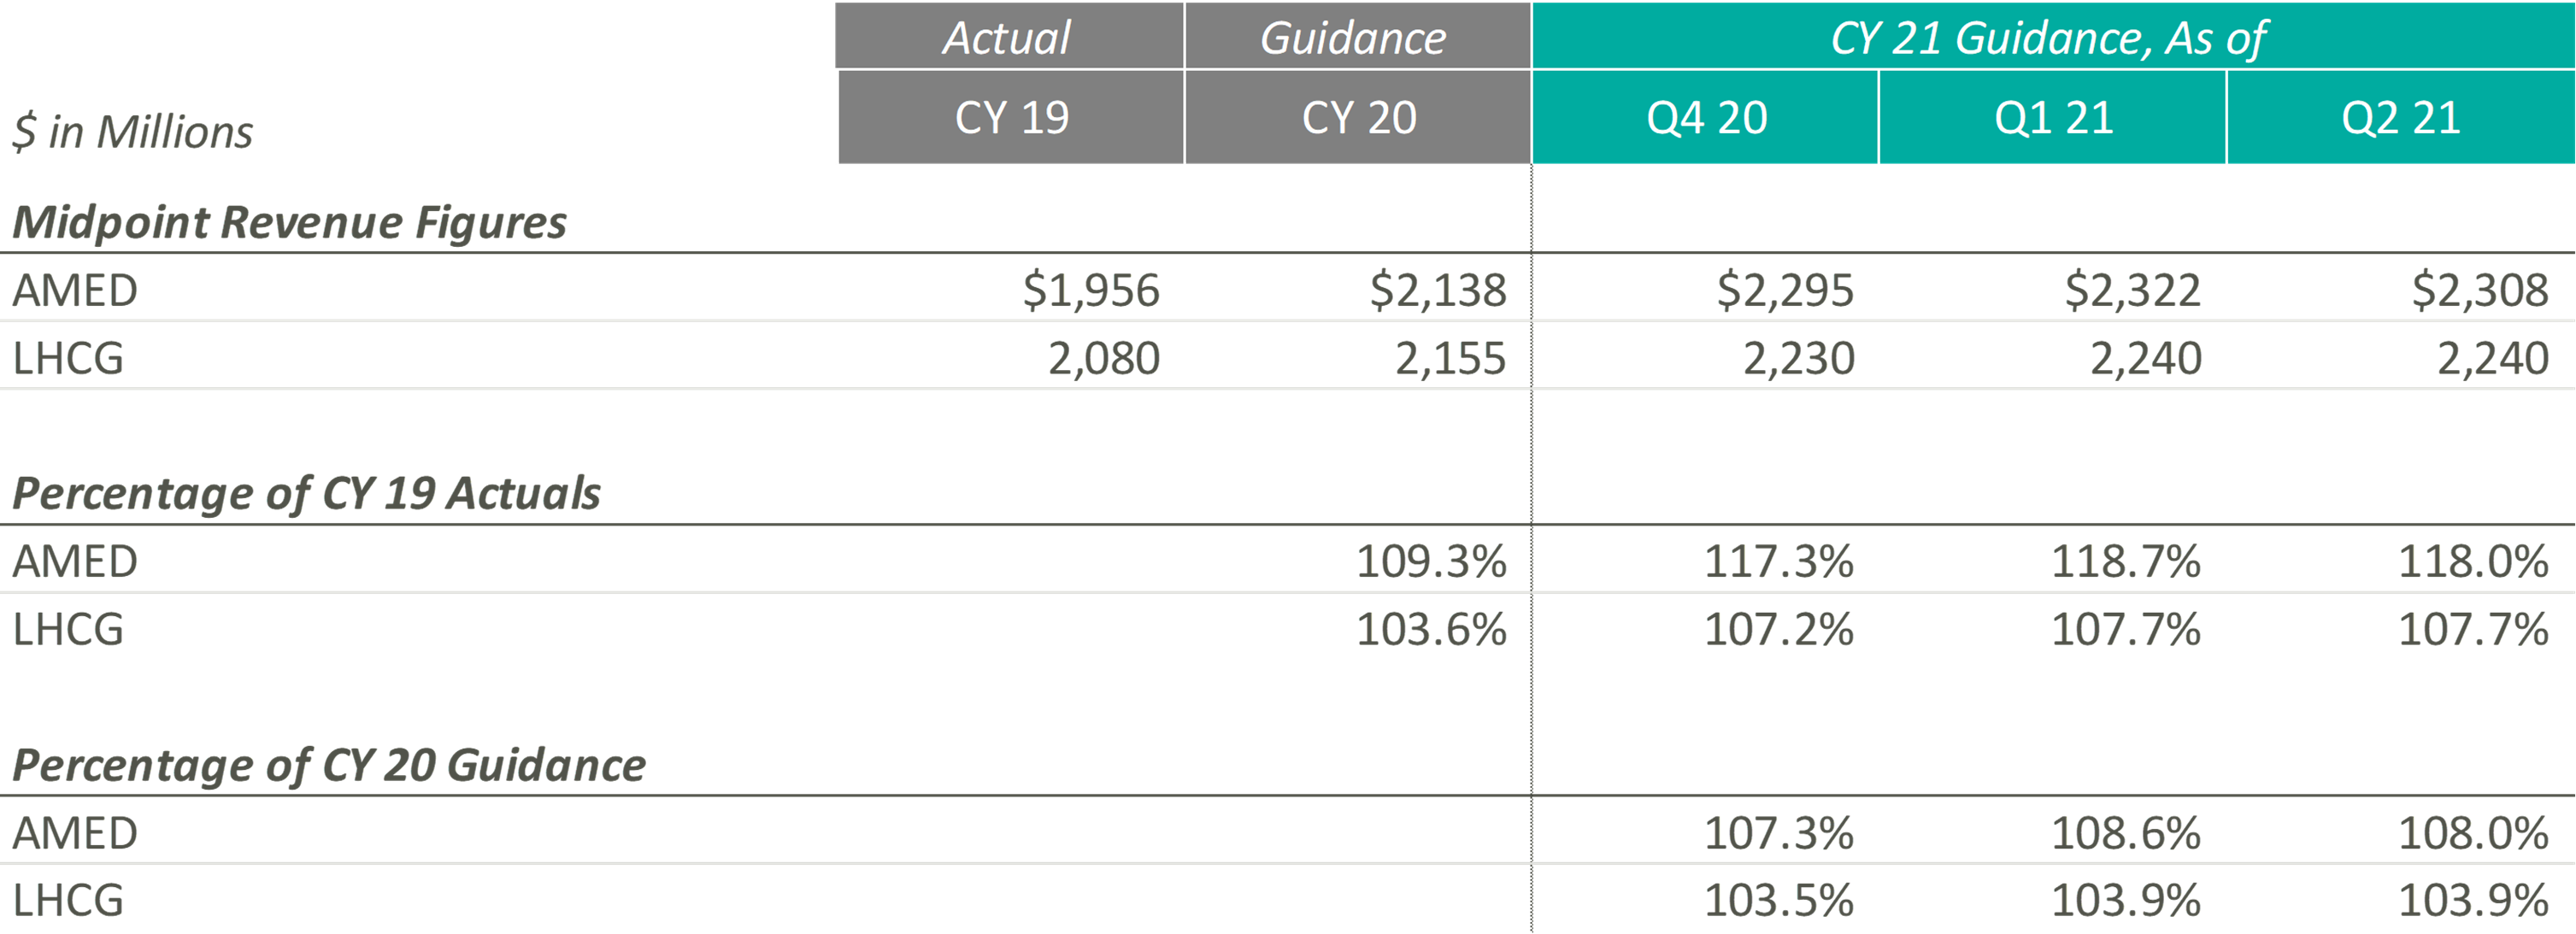
Since the end of CY 2019, AMED and LHCG have both steadily increased their observed revenue estimates, until the most recent quarter. In fact, AMED lowered its CY 2021 guidance during its most recent earnings call citing more conservatism due to the “prolonged, and now, resurgent impact of COVID on our hospice business.” More specifically, the pandemic has resulted in a continued decline and suppression of occupancy rates in senior living facilities (a major referral source), a decrease in length of stay, and an increase in hospice staff turnover. AMED’s management noted that when previously releasing CY 2021 guidance, they had not expected the continuation of COVID impacts during the second half of the year. LHCG discussed similar headwinds but did not adjust the projected guidance figures.
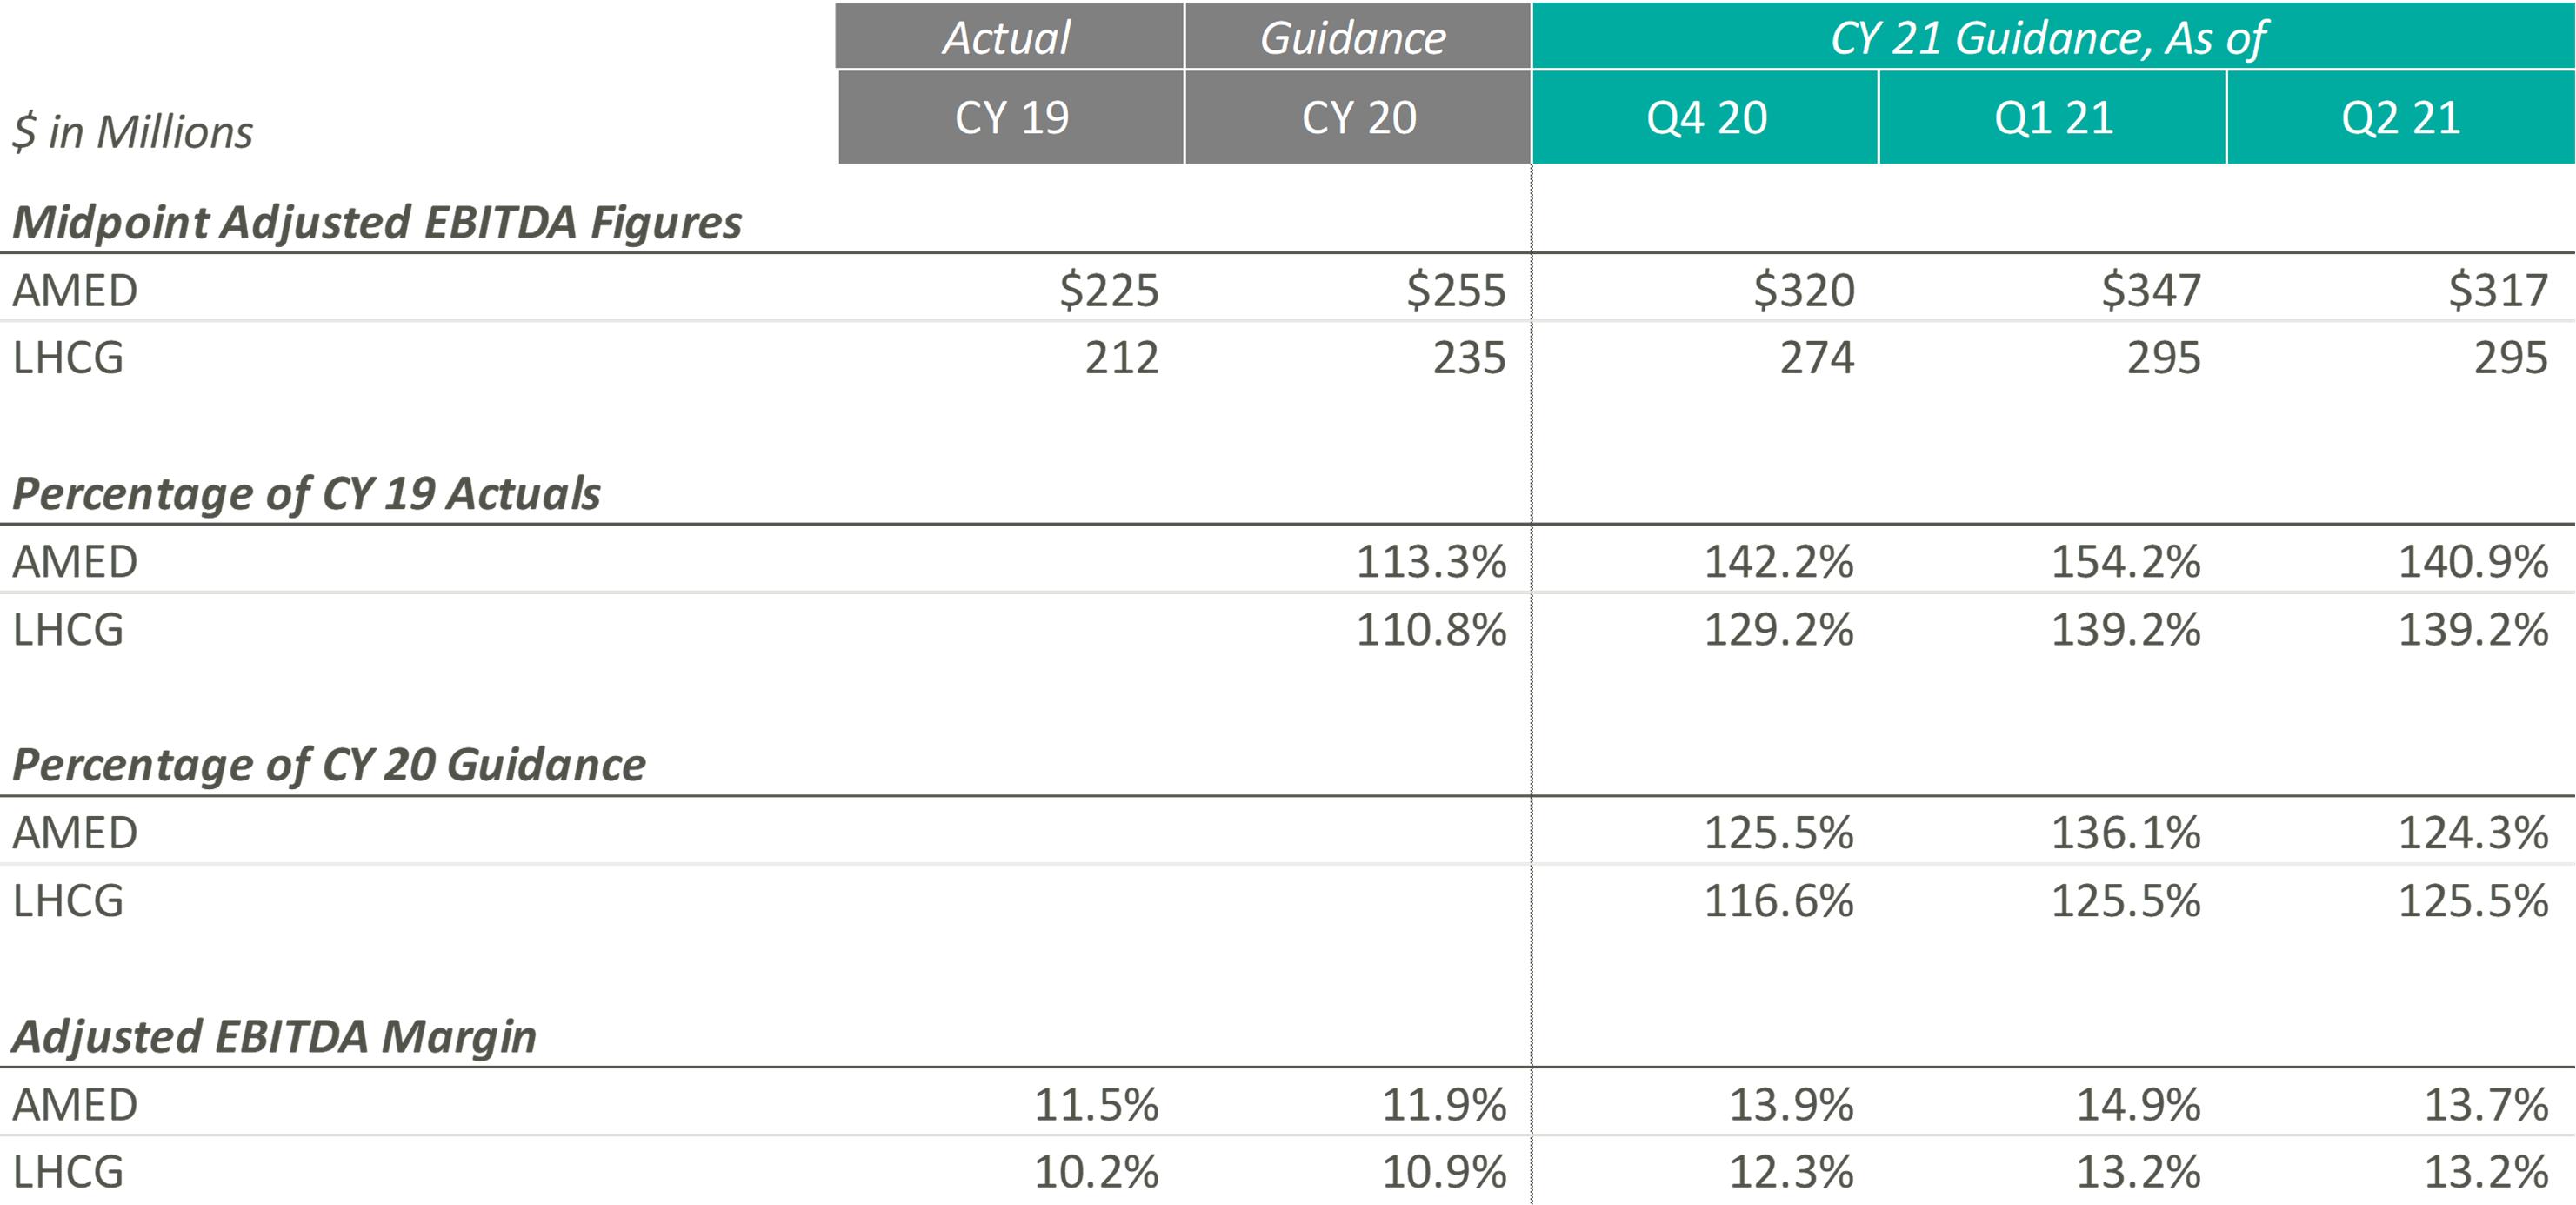
During Q4 2020 and Q1 2021, the Home Health & Hospice operators expected to significantly improve upon their CY 2019 and pre-COVID CY 2020 adjusted EBITDA guidance levels. Keith Myers, CEO of LHCG, discussed the company and overall industry’s success, stating “We are also benefiting from an improved legislative and regulatory outlook as legislative initiatives from Congress, innovation from CMS and stated budget and stimulus priorities of the Biden Administration are all emphasizing the need for at home care.” In addition to improved expected adjusted EBITDA levels since the pandemic, the adjusted EBITDA margin for the Home Health & Hospice operators has also increased compared to CY 2019 and pre-COVID expected CY 2020 levels.
While these Home Health & Hospice operators expected strong performance as they emerge from the pandemic, referrals from senior housing have remained low since the pandemic. Kevin McNamara, CEO and President of Chemed, a company in the space that does not provide guidance for its Home Health & Hospice subsidiary, stated, “The most complex issue still facing [our subsidiary] is the disruptive impact that the pandemic has had on traditional hospice referral sources and low occupancy in senior housing. This disruption continues to impact our admissions and traditional patient census patterns.” This sentiment was reflected in AMED’s Q2 2020 earnings call, where they decreased guidance to reflect the headwinds discussed previously.
Despite the recent concerns related to the continuation of COVID, operators remain optimistic about the future of the space, specifically the demographic tailwinds. During the Q4 2020 earnings call, Paul Kusserow, CEO and President of AMED stated “[Demographics are] in our favor with the baby boomers creating a potential surge of patients in the coming year, with more people turning 65 years old than ever before. The burgeoning 75-plus population, coupled with ever-increasing unsustainable health care costs puts us in a very advantageous position.”
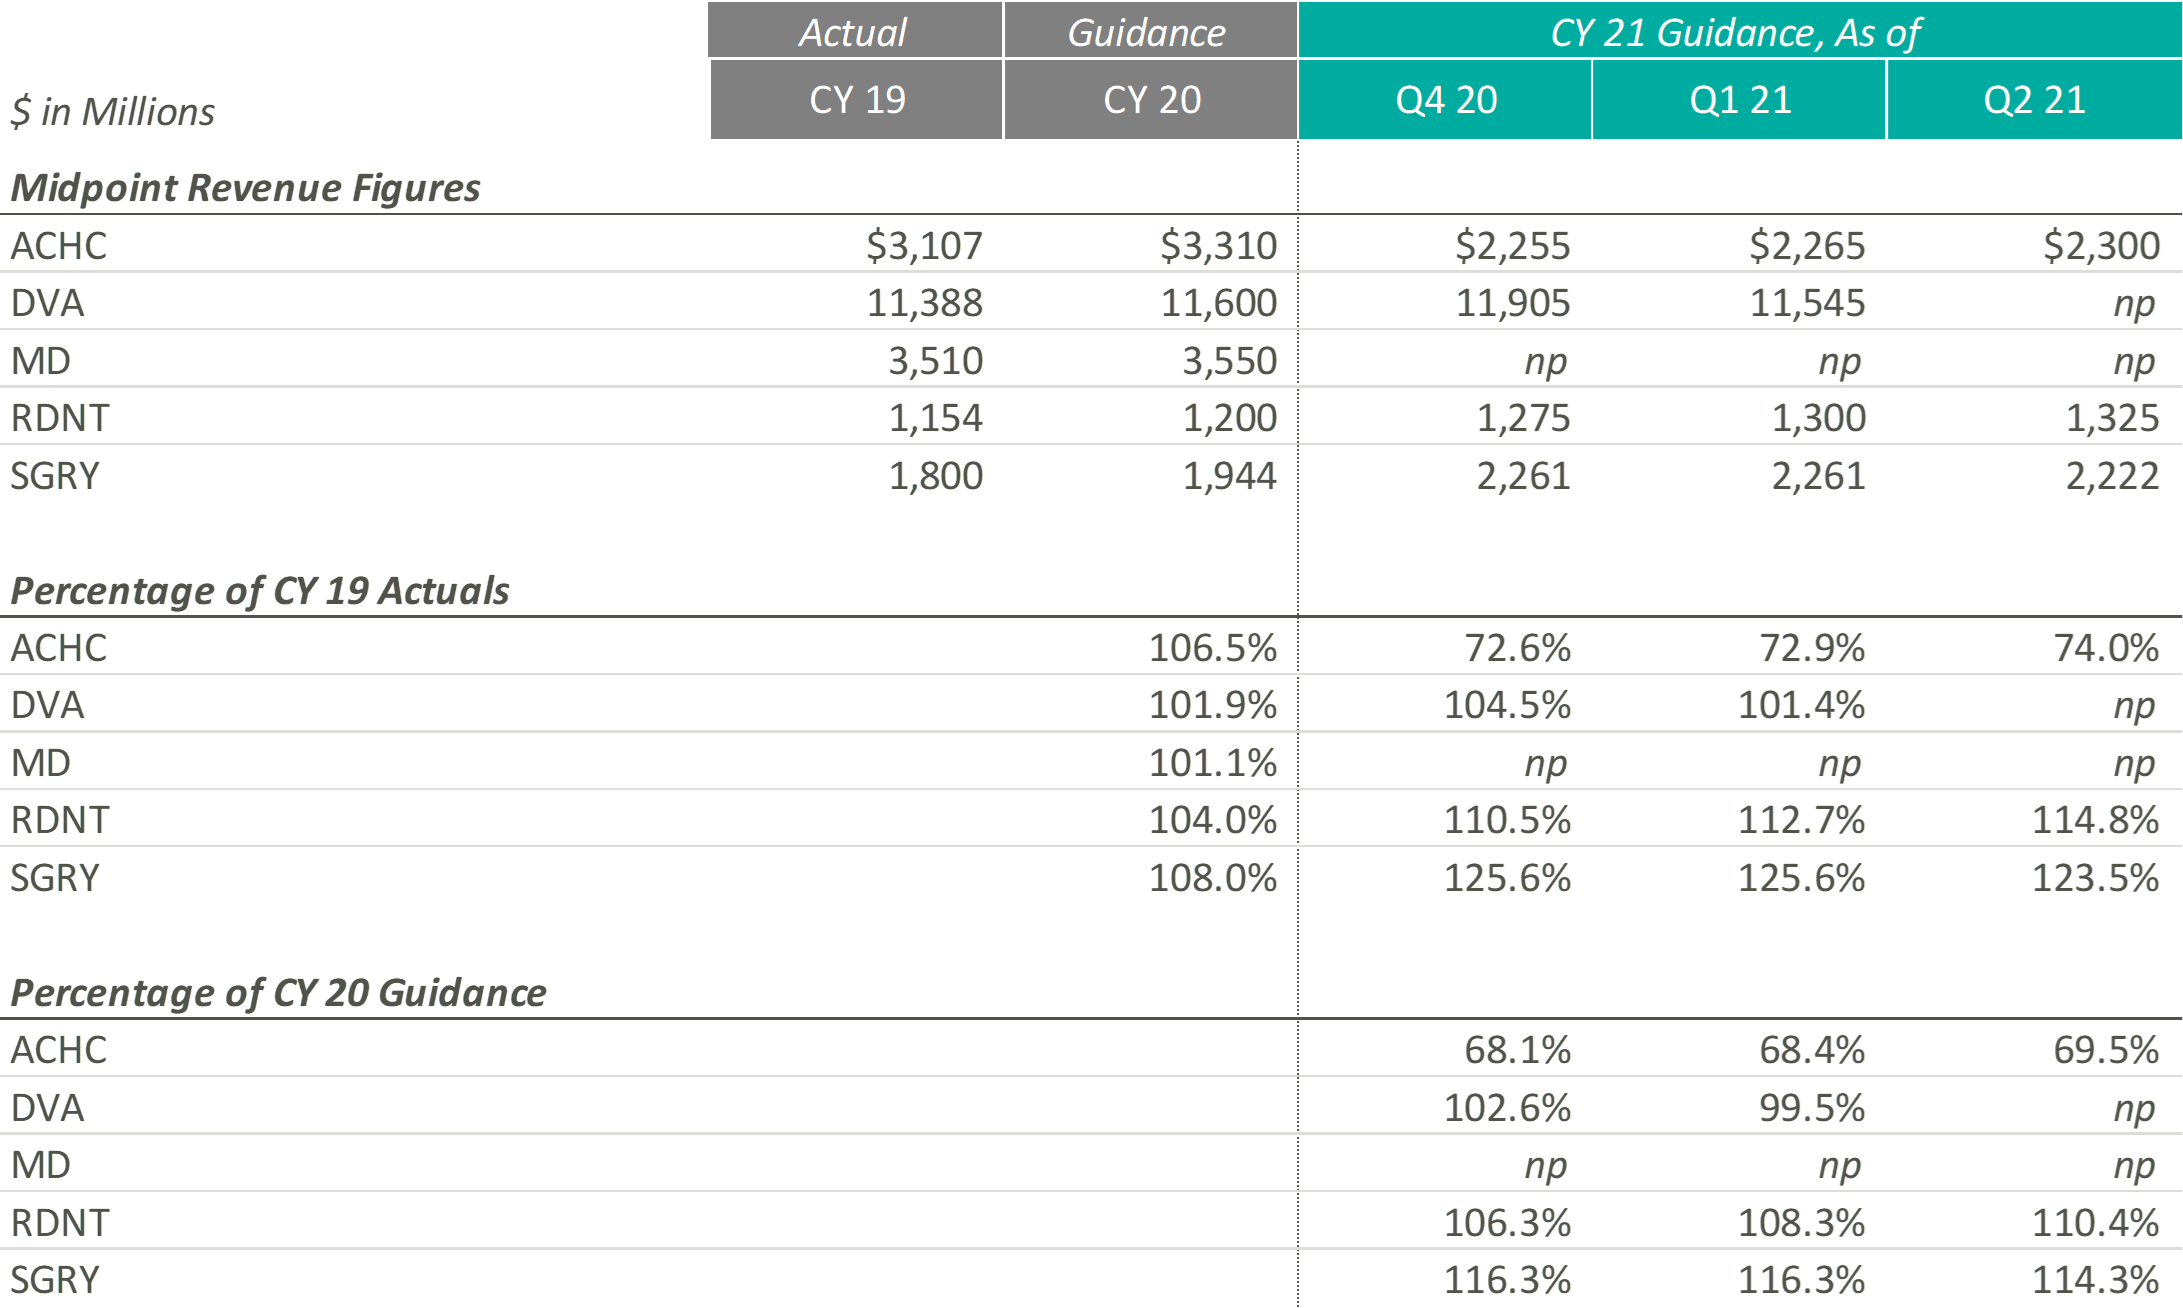
Revenue projections for Outpatient and Other operators are varied as they represent a variety of industries and markets that have been affected by COVID-19 in different ways. RDNT, which provides diagnostic imaging services, and SGRY, which runs ambulatory surgery centers, expect growth above both CY 2019 revenues and expected pre-COVID CY 2020 revenues. RDNT increased their revenue guidance as volume, in virtually all areas of the business, has increased as the states in which they operate have loosened COVID-19 restrictions. While still higher than CY 2019 and CY 2020, SGRY has decreased their CY 2021 revenue guidance as low acuity cases are expected to represent a larger portion of the case mix than previously thought.
On the other end, ACHC, a behavioral health company, expects growth below both CY 2019 revenue and expected pre-COVID CY 2020 revenues. However, ACHC is an outlier as they sold UK operations to a private equity firm in December 2020, making it difficult to compare going forward guidance estimates with historical estimates. ACHC increased CY 2021 guidance as patient volume increased due to the mental health crisis that evolved during the pandemic as well as an increase due to the societal acceptance of mental health services.
DVA, which performs dialysis services, did not provide CY 2021 guidance during the most recent earnings call. Additionally, MD, a physician-led medical group that partners with hospitals, health systems and health care facilities to offer women’s and children’s care, has still not resumed guidance since they announced in their Q1 2020 earnings report that they would no longer provide guidance due to the rapidly evolving nature of the COVID-19 pandemic.
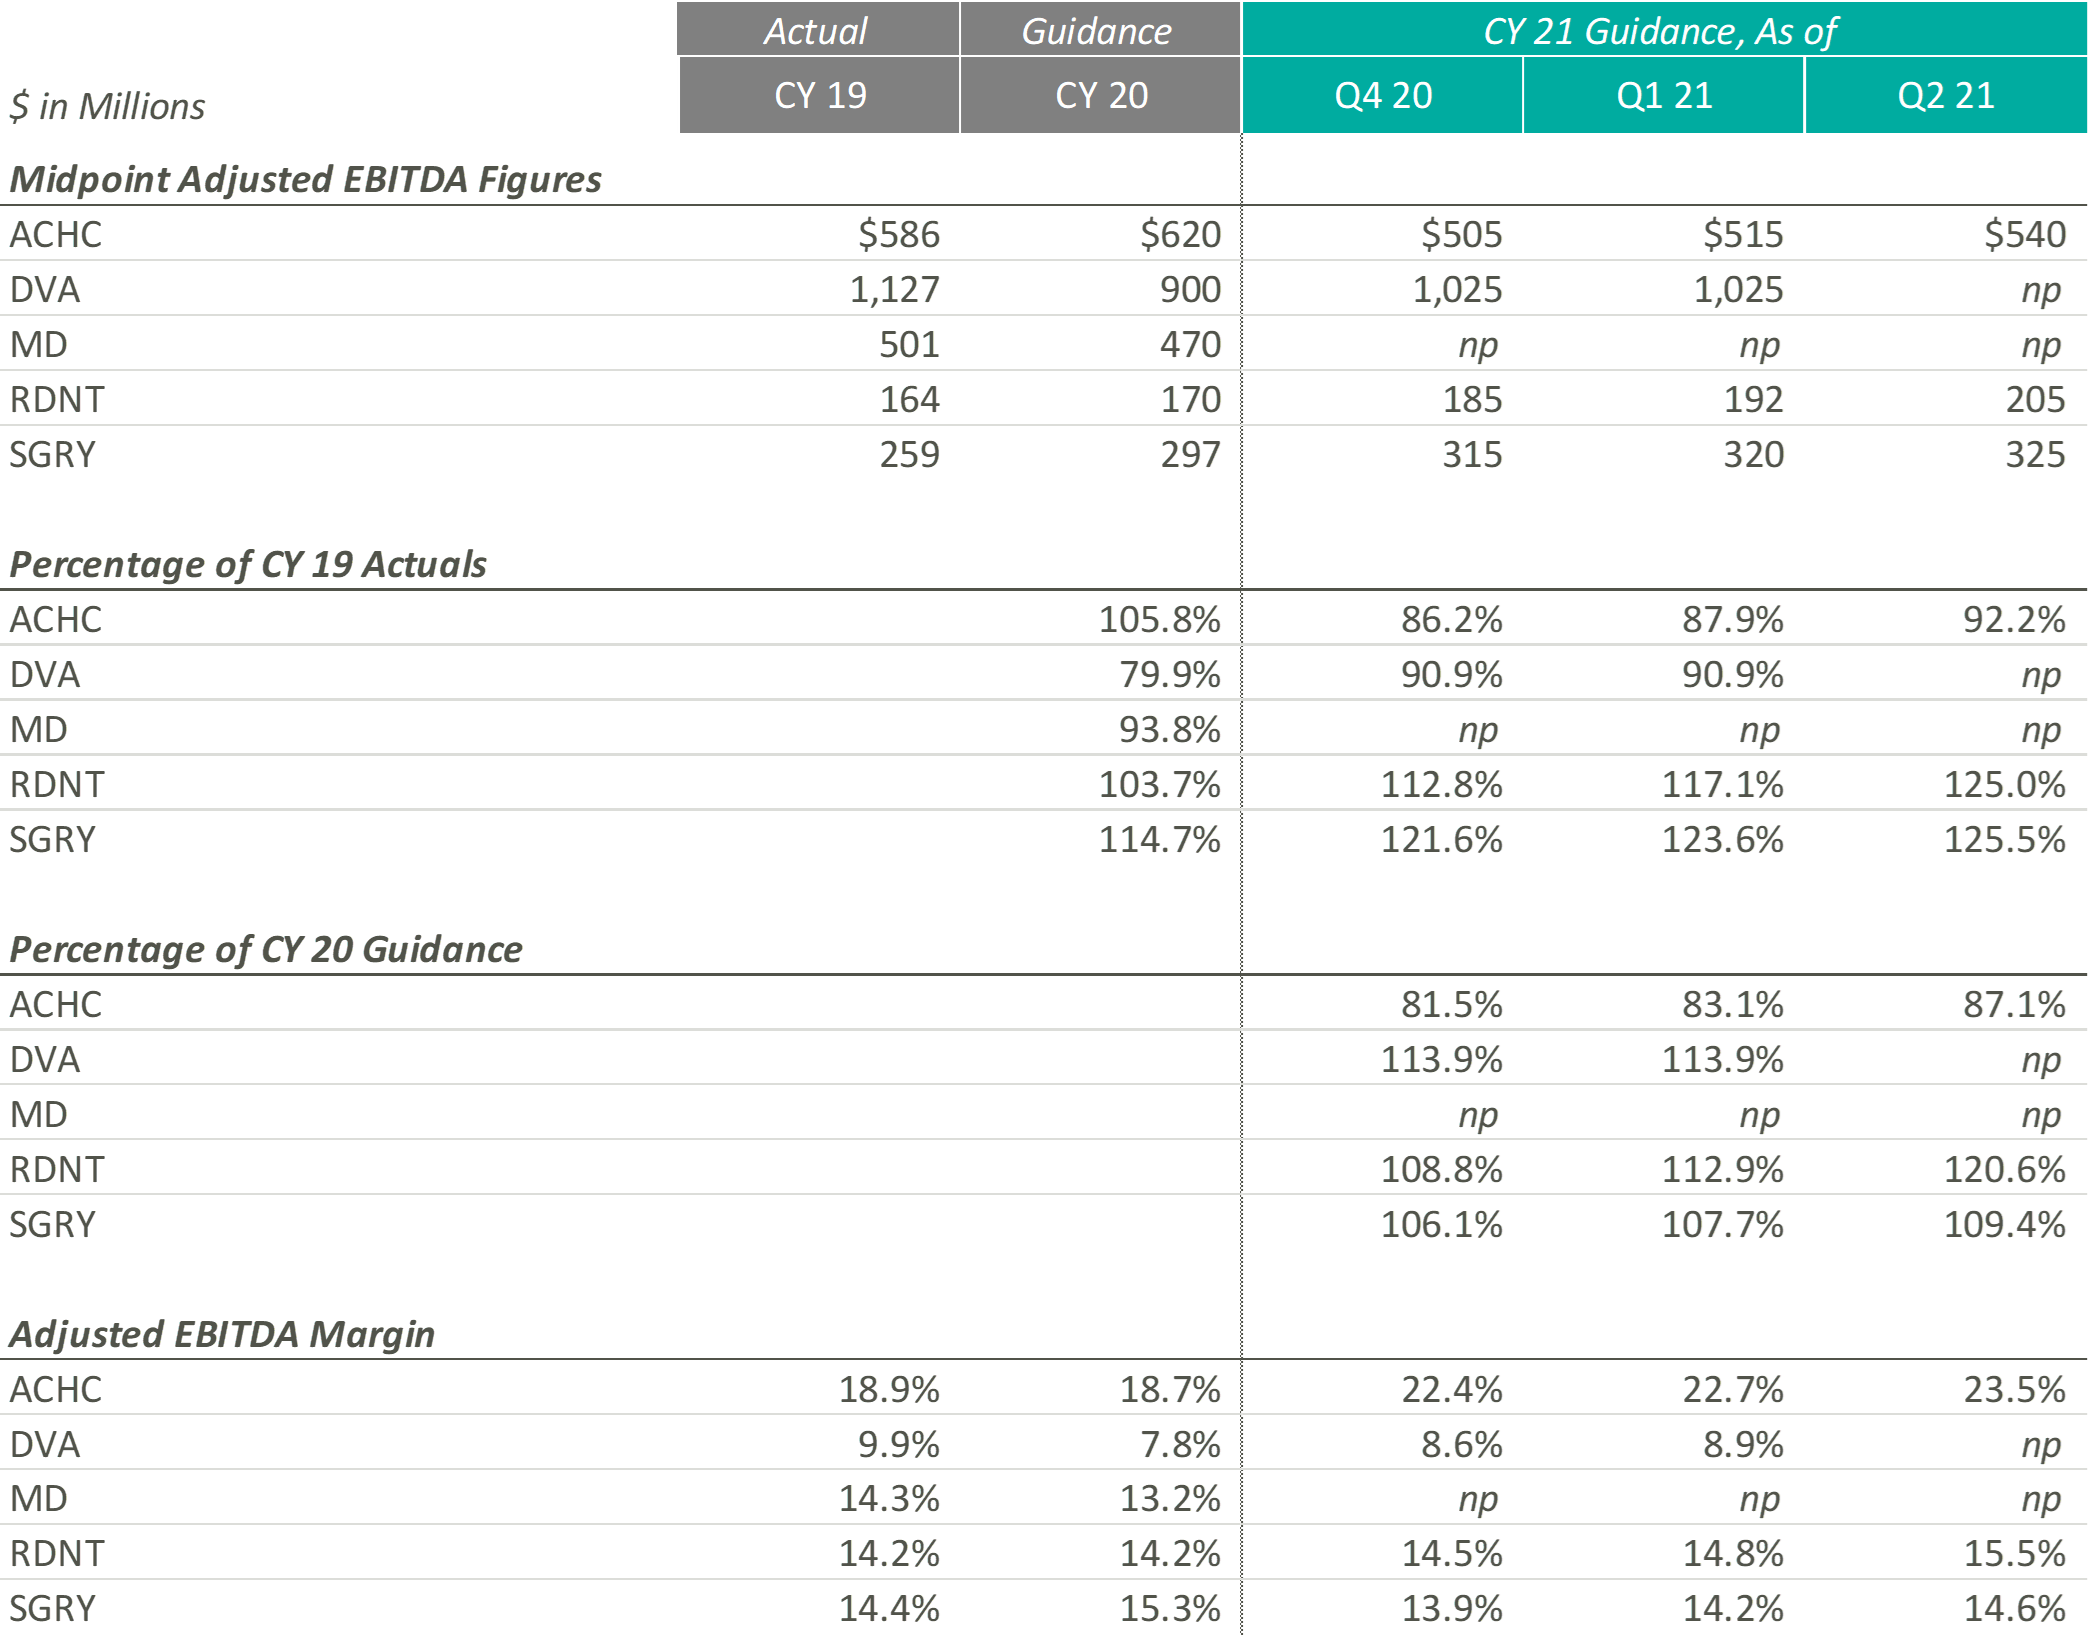
During the most recent earnings calls, every entity that provided guidance increased their CY 2021 guidance figures. ACHC increased adjusted EBITDA guidance due to a rise in patient volume and the expectation that the demand for mental health services is expected to increase. ACHC also expects their adjusted EBITDA margin to increase as more cost synergies are realized with the addition of new beds and facilities.
While DVA did not provide adjusted EBITDA guidance, the CFO & Treasurer, Joel Ackerman, stated “we’re also expecting an uptick on costs related to testing, vaccinations and teammate support as a result of the Delta variants” during the company’s Q2 2021 earnings call.
During the most recent earnings call, RDNT raised their CY 2021 EBITDA guidance from $192m to $205m. According to Mark D. Stolper, the Executive VP & CFO, RDNT’s adjusted EBITDA margins have improved due to regional cost efficiencies and an increase in reimbursement due to previous investments in new equipment. Howard G. Berger, President & CEO of RDNT, recently stated in the company’s Q2 2021 earnings call that “with patient volume returning to more normal levels and through implementing aggressive cost-cutting and cost containment programs, our same-store growth and performance model has returned.”
Like RDNT, SGRY has increased their most recent CY 2021 adjusted EBITDA guidance due to the expectation of volume increases due to seasonality and a rise in higher-acuity procedures. J. Eric Evans, CEO & Director of SGRY, stated in the Q2 2021 earnings call that margins “are projected to increase in the back half of 2021, consistent with historical performance as seasonal commercial mix intensifies.”
The entities in this section represent a variety of sub-industries that were all affected by the pandemic in a unique way. Overall, it appears that the companies that were able to create cost efficiencies and see a notable recovery in volume increase their guidance figures, while those who dealt with increasing expenses and continued volume variability decreased or did not provide guidance.
Although each industry and operator reacted to the pandemic uniquely, the overall outlook among these operators remains positive. Comparing the most recent guidance figures to CY 2019 performance, eight out of eleven operators with sufficient guidance data expect higher revenue in CY 2021 according to their most recent Q2 2021 earnings reports. Furthermore, nine of the same eleven operators estimate similar performance with adjusted EBITDA.
Comparing Q2 2021 guidance to the CY 2020 estimates released before the pandemic can provide additional insight on which companies not only survived but continued to grow throughout the COVID-19 pandemic. Eight out of the eleven operators expect CY 2021 revenue to exceed estimated revenue levels at the beginning of CY 2020. Additionally, ten out of eleven predict similar trends with adjusted EBITDA. However, it is interesting to note that some of these operators, specifically in the Acute Care Hospital sectors, expect CY 2021 estimates to outperform CY 2020 estimates only by a slim margin. Since these operators are only predicting a small amount of revenue and adjusted EBITDA margin expansion from 2020 to 2021, it appears they might not have experienced normal levels of development throughout the pandemic. The Post-Acute Care and Home Health & Hospice operators, on the contrary, expect to significantly outperform pre-COVID CY 2020 estimates in 2021, illustrating that these two sub-industries may not have experienced a “lost year” of growth in 2020 as a result of the COVID-19 pandemic.
Lastly, to understand how these operators’ performance has trended throughout CY 2021, we have compared the most recent CY 2021 guidance figures to those released during the Q4 2020 earnings calls. Nine out of eleven companies have adjusted revenue guidance to levels at or above the initial figures, and ten out of the eleven have either increased adjusted EBITDA estimates or left them equal. Based on these statistics, it appears operators have successfully started CY 2021.
Despite the lingering COVID-19 pandemic, it appears healthcare operators are optimistic about the recovery of their revenue and Adjusted EBITDA metrics over pre-pandemic levels. Further, many healthcare operators have taken the past year and a half to implement new strategies that will allow them to become more efficient long-term. Overall, it appears the healthcare operators have adapted during these times and are optimistic about their future performance despite the lingering COVID-19 pandemic.
The impacts of the Covid-19 pandemic have been felt throughout the healthcare industry and led to major shifts across all verticals. In particular, the care of the elderly and frail population has faced some of the most scrutiny over the past 18 months given the population’s elevated level of susceptibility to Covid-19 and the major safety protocols that come along with keeping them protected from transmission. Institutional, in-home, and community-based long-term services and support (“LTTS”) providers were forced to make major changes in procedure and delivery of care which has led to mixed results. However, one segment of the LTTS healthcare sector, Programs of All-Inclusive Care for the Elderly, or “PACE” organizations, has been incredibly successful in evolving its services under the tumultuous circumstances of the pandemic. The pandemic provided a unique opportunity for PACE organizations to rethink in-community and care-based services for participants. Throughout the pandemic, PACE organizations consistently demonstrated the ability to pivot quickly and effectively while maintaining a high level of safety for their enrollees and staff; all the while, keeping the cost of care under control.
PACE Programs are community-based programs serving over 55,000 elderly participants across 31 states and D.C. (1). Under PACE, enrollees are provided with an extensive list of care and services covered by Medicare and Medicaid as well as necessary care and services not covered while still able to reside in their own home (2). The general eligibility of PACE programs requires the enrollee to be above 55 years, reside in the PACE organization’s service area, and be certified as eligible for nursing home care by their state while able to live in a community setting (2).
PACE Programs, as opposed to other long-term care-facilities, allow enrollees to live in their own homes while providing transportation to the on-site PACE community center, with a central objective of reducing cost of care and admissions to both hospitals and residential care facilities (3). The platform allows for socialization and interaction but does not require nor offer 24/7 contact with other enrollees and staff. This degree of separation of enrollees largely affected the number of transmissions of Covid and Covid-related deaths in PACE Programs; approximately 1.39% of PACE enrollees tested positive and died from Covid-19 as of July 27, 2020 whereas 5.23% of the 1.3 million nursing home residents had died from Covid-19 as of August 13, 2020 (4). Despite enrollees’ frailty and eligibility for nursing homes, PACE participants, on average, had fewer hospitalizations, less time in the hospital, and a lower death rate than nursing home residents for both Covid and non-Covid related ailments (4). Non-communal living allowed PACE Programs the ability to change course rapidly without the concern of transmission from member to member or staff to member.
When the pandemic first began, PACE programs had to pivot, and could no longer view themselves as solely a physical location, but rather a moving entity comprised of enrollees, staff, and transportation vans. Problems centered around the conglomeration of people to receive care and to interact socially within the PACE centers (3). PACE programs had to redesign their care model almost overnight to accommodate regulations and to protect enrollees. All activities ceased, care providers were sent into homes, transportation vans became mobile health clinics, daily phone calls were made to enrollees, meals were delivered to homes, and activities became virtual (3). While every precaution taken was to protect enrollees, with the reduced interaction, loneliness for enrollees living alone became a pervasive issue. To combat this issue, some PACE programs partnered with telehealth companies. One PACE Program, Element Care, partnered with the telehealth company GrandPad, to obtain a proprietary tablet with a simple interface which allowed their enrollees to reach nurses, complete physical therapy, and participate in social activities (5). This program was one of many that were able to effectively reduce levels of loneliness and depression with the implementation of telehealth that offered enrollees an alternative way to connect with their peers during periods of isolation.
A huge concern surrounding care for the enrollees was the temporary closure of medical practices, due to the pandemic, to assist with the enrollees’ average six chronic illnesses (4). As a potential solution, Summit Eldercare, one of the largest PACE programs, opted to transform their in-house community center into an infirmary to care for Covid-positive members who were discharged from hospitals (4). It took about a month for Summit Eldercare to get the infirmary running, serving a total of 11 patients and providing around-the-clock care (4). Although the last patient was discharged in June of 2020, Summit Eldercare demonstrated PACE programs’ ability to utilize space effectively with the resources at their disposal.
PACE offers a much more dynamic and evolving system of aging that gained popularity and traction with the loosening of legal boundaries and allowance of for-profit entities entry into the market in 2015 (7). Prior to 2015, PACE programs were solely non-profit organizations that were plagued by static growth in participants and locations around the country despite the high demand for eldercare services (1). By 2030, the youngest Baby Boomers will be above the age of 65, contributing to the overall aging of the US population and creating a strain on the healthcare system (8). PACE has the opportunity to tap into this market and the potential to grow through scale, spread, and scope; increasing the number of people, number of organizations and communities served, and expanding the range of populations that PACE serves (9).
PACE Programs demonstrated the adaptive nature of the platform and their potential for growth, however, PACE still have substantial issues as the nation emerges from lockdown. Job growth in the leisure and hospitality industry has grown significantly over the past three months and Healthcare is one of the industries with the highest amount of job openings, in part due to 2/3rds of workers who lost their jobs either reconsidering their job choice or choosing to stay home (10). As PACE organizations plan for future expansion, these organizations will be forced to navigate a tight labor market in order to provide the full spectrum of care to new participants.
PACE programs adapted to the “new normal” that COVID presented and proved the benefits for quality in home and community-based care. Given the successes of PACE since the spring of 2020, policymakers around the country will continue to take notice and deliberate further expansion of the programs in their states. Although PACE has its fair share of headwinds, the innovative mindset of the operators as well as the program’s track record during the pandemic bodes well for the future of PACE in the ever-growing elderly care market space.
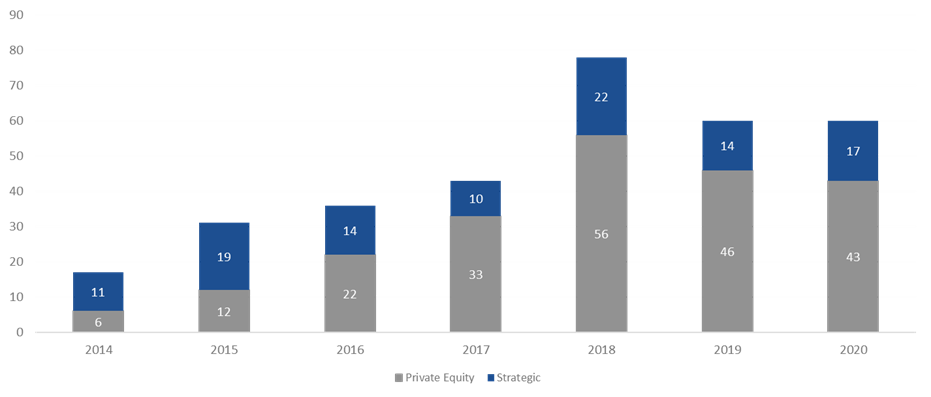
At the American Health Law Association’s 2021 Annual Meeting, held in June, VMG Health Managing Director Clinton Flume, presented trends within the behavioral health industry, along with co-presenter Jenna Gunville of the law firm Polsinelli. The excerpt highlights Mr. Flume’s observations of the continued consolidation within the behavioral health industry.
Behavioral health has been a very active market over the last three to four years. 2018 was the high-water mark, with over 75 transactions. 2019 fell off a bit as owners and operators integrated these transactions within their platforms. Obviously, COVID-19 hit 2020, but the year started off well. As year-end numbers became available at the beginning of 2021, the industry anticipated total transaction numbers to be a bit soft but was pleasantly surprised that the deal count came in roughly the same as 2019. This boded very well for continued transaction acceleration in 2021, which is on pace to surpass 2019.
The Global Behavioral Health Market is expected to garner growth at a compounded annual growth rate of 5.0% from 2020 to 2027 and to reach a value of around $242 billion by 2027[2]. The two main factors that I believe will continue to help spur activity are public perception and acceptance and continued investment by private equity. Perception and acceptance involve the acknowledgement and social understanding that mental health services are just as important as the physical treatments we receive as a collective. High profile government official and celebrities certainly aid in bringing awareness to and lessening the social stigma around mental health struggles.
In addition, I believe that payor parity and investment in platform digital health services are key contributors to the increase in transactions. Payor parity focuses on the historical noncompliance of insurers in reimbursing providers for mental health services and creating equal footing for reimbursement and access to services. Increased legislative scrutiny and enforcement of health plans and reimbursement expansion though the Coronavirus Preparedness and Response Supplemental Appropriations Act are two ways payor parity has recently been addressed.
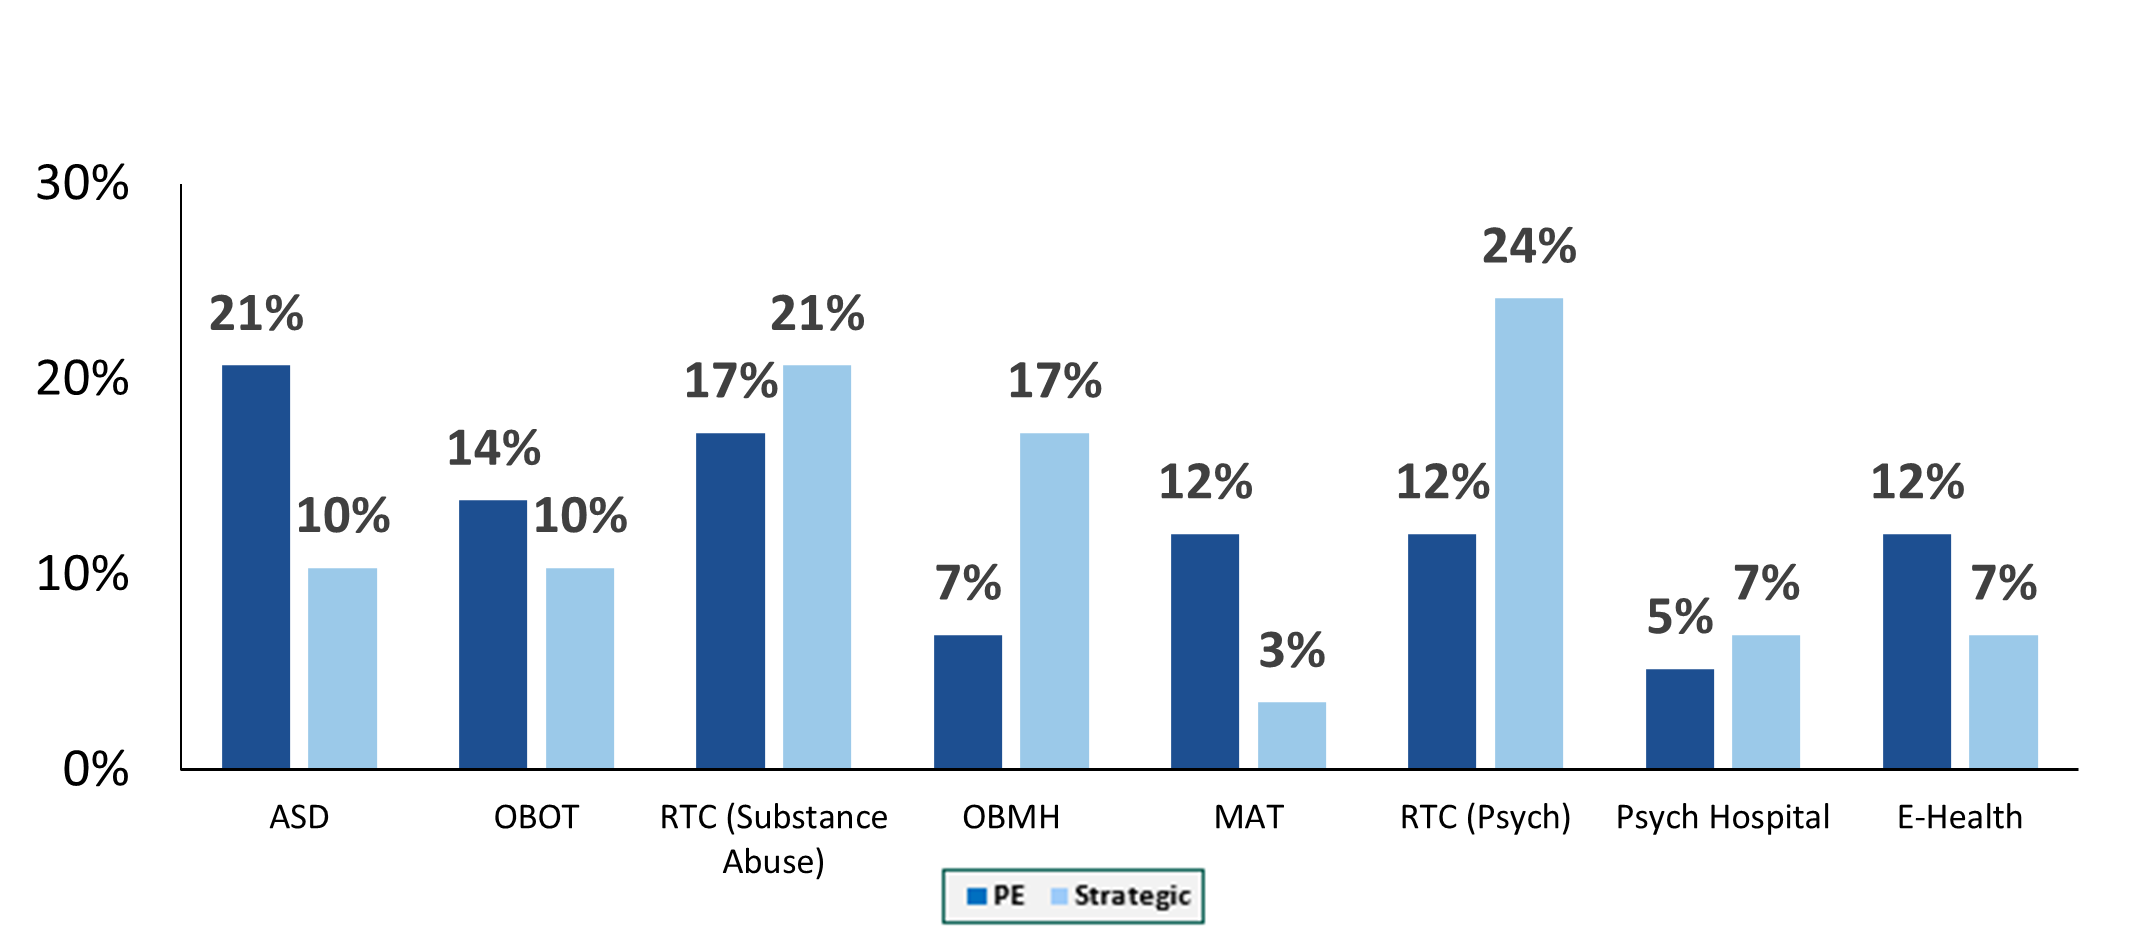
Autism spectrum disorder transactions have exhibited the greatest share of transaction growth since 2018. This is largely driven by acknowledgement of an underserved industry, legislation that includes the Autism CARES Act of 2019, and improvements in reimbursement. Residential treatment centers (both substance abuse and mental health), along with office-based treatment facilities, continue to occupy the bulk of transactions. One area we have been seeing real growth in over the last two years is digital health transactions. These deals include digital technology administration of services such as direct-to-consumer care, revenue cycle performance improvement and automation, and artificial intelligence applications for managing and treating substance abuse and mental health disorders. In June, Rock Health[3] stated that U.S. behavioral health digital startup companies raised $588 million in the first half 0f 2021, which is equal to the annual amount this segment received in funding for any prior year. As we look at 2021 and beyond, we expect that digital health platforms and direct-to-consumer technology will accelerate the growth and acceptance of mental health services.
[1] The merger and acquisition data contained in various charts and tables in this report has been included only with permission of the publisher of Deal Search Online, HealthCareMandA.com. All rights reserved.
[2] Globenewswire.com, IBIS World
[3] https://www.fiercehealthcare.com/tech/funding-for-digital-behavioral-health-startups-surged-amid-covid-19-pandemic
[4] The merger and acquisition data contained in various charts and tables in this report has been included only with permission of the publisher of Deal Search Online, HealthCareMandA.com. All rights reserved.
Behavioral health has been of one of the most active sectors in the healthcare transaction marketplace in recent years. Driven by plentiful investment capital, regulatory changes, the opioid crisis, public recognition of the need for mental healthcare and broader coverage from payors, the industry has seen numerous companies pursue consolidation strategies. A common trend that has emerged in the behavioral health industry involves the proliferation of joint ventures between non-profit health systems and for-profit companies to operate full service behavioral health hospitals. Some recent examples of joint ventures over the last two years include:
UHS and Acadia have traditionally been the most active for-profit operators pursuing this model. However, new entrants have emerged, as highlighted by Kindred Healthcare’s entrance in the behavioral health space, which has historically focused on joint ventures with health systems to provide post-acute care. It appears this type of behavioral health joint venture will only continue to be a strategic focus for these companies going forward. Rob Marsh, recently highlighted Kindred’s perceived opportunity with the model to Behavioral Health Business:
“Right now, we’re probably working with somewhere in the neighborhood of 15 health systems throughout the United States. Some of those are a little further along than others, but I feel very confident that the pipeline is just going to continue to expand.”
Acadia’s 2021 Q1 earnings call, Acadia’s CEO, Debra Osteen, stressed the importance of these strategic partnerships:
“We will continue to pursue this important pathway of growth for Acadia in the year ahead and beyond. With a solid pipeline of joint venture projects in different stages, we expect 2022 to be our strongest year for joint ventures with 4 to 5 facilities expected to open.”
UHS’ CFO, Steve Filton, expressed similar sentiments to its shareholders during the companies’ Q4 2019 earnings call:
“We also continue to grow our behavioral health joint venture portfolio with 3 new facilities already operational; 7 under construction or announced, which are expected to open in 2020 and 2021; and over 40 opportunities in the pipeline.”
Why would a non-profit hospital want to joint venture their behavioral health service line with a for-profit operator? Based on our experience, motivations for these transactions from a health system perspective may include the following:
From a for-profit operator perspective, some of the major motivations behind the joint venture model are as follows:
The transaction generally consists of a non-profit hospital contributing its existing service lines existing behavioral health service lines such as inpatient psychiatric units, outpatient programs, certificates of need (where applicable), and licenses for use of the health system trade name. The for-profit operator contributes capital to construct a new facility that expands capacity and service capabilities. In addition, the for-profit partner usually provides management services post-transaction.
As a large referral source to the new partnership, the health system contribution should be consistent with Fair Market Value (“FMV”) for regulatory purposes. In addition, any service agreements between the new joint venture and the parent entities also need to be carefully negotiated and consistent with FMV. Key examples include the management agreement between for-profit operator and the joint venture, or if physicians employed by the hospital are provided to the joint venture through a professional services agreement. Finally, there may be other service agreements with either party providing IT, pharmacy or other ancillary services that payments will need to be at FMV
Another key consideration is the impact to revenue. Reimbursement for the service line when structured as a department of the hospital might not be achievable on a freestanding basis. Generally speaking, the joint venture has to negotiate new contracts and rates with the payors. Stakeholders should perform careful analyses around the impact of freestanding commercial rates when compared to what the health system was able to historically achieve. Furthermore, the hospital DSH or other government subsidy payments could possibly be impacted post transaction with the loss of Medicaid patient days. This impact to DSH can prove to be a strong disincentive for a health system to pursue affiliations.
In summary, behavioral health joint ventures have been common in recent years. With the large increase in demand for behavioral health services, limited bed capacity nationwide and the ability for both non-profit and strategic operators to achieve benefits, it is expected this type of transaction will continue to grow in popularity in the future.
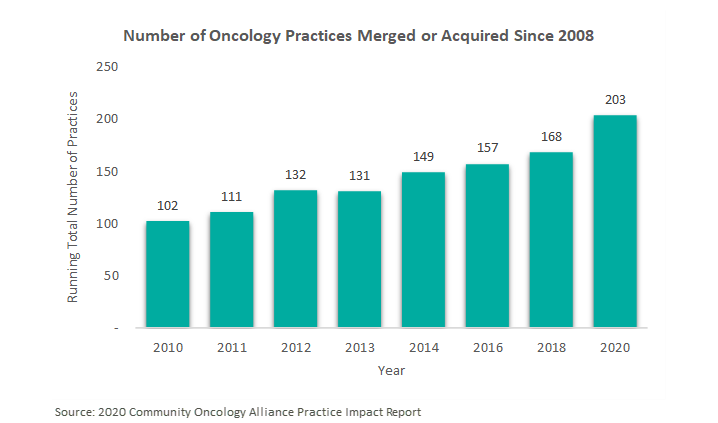
In August 2019, VMG Health published an article titled “Oncology on the Rise: Private Equity Investment in Cancer Care.” This article discussed the emerging interest in the oncology provider industry by private equity (“PE”) firms, most notably through the formation of PE-backed platform practices. Since this article was published, the oncology practices have continued to trend toward consolidation. According to the 2020 Community Oncology Alliance Practice Impact Report, the number of community oncology practices merging or being acquired by another practice or corporate entity, such as a private equity firm, has increased almost 21% since 2018. In fact, trends over the previous ten years suggest there has been an approximately 7.0% annual increase, on average, in the number of community oncology practices that have been acquired by a corporate entity and/or merged with another oncology practice. [1]
However, more recent deal activity suggests a shift from the large-scale platform transactions to tuck-in acquisitions by these platform entities as they seek to scale their businesses in both geography and size.
As previously mentioned, there has been an uptick in tuck-in acquisitions in the oncology space following the emergence of these PE-backed platforms throughout 2018. These platforms strategically target practices for consolidation to leverage geographic expansion, economies of scale, or hospital affiliations. Below is a summary of the recent activity of the major PE-backed oncology platforms.


Following its acquisition by Tahoe Investment Group in April 2017, Alliance Healthcare Services has continued its national oncology and radiology platform expansion through direct partnerships with physicians and hospitals, such as Beaufort Memorial Hospital in South Carolina and SCL Health in Colorado. “Across the US, we work side by side with more than a thousand hospitals to deliver effective and efficient diagnostic radiology, radiation therapy and related services. We believe it is the best of both worlds: a focus on each unique community, partnership and patients, supported by national resources,” said Rhonda Longmore-Grund, President and CEO of Alliance HealthCare Services. [2]
On June 25, 2021, Alliance announced its acquisition by Akumin for $820 million, which is expected to close in Q3 2021. After holding the platform for 5 years, Tahoe Investment Group will transition to a minority ownership position in the publicly traded, combined entity. Regarding the transaction, Riadh Zine, President and CEO of Akumin, stated “The acquisition of Alliance is transformative in a changing healthcare ecosystem that continues to shift toward outpatient, price-transparent, value-based care. There’s no other organization that has the complement of attributes we will offer together as outpatient healthcare services experts, in particular with Alliance’s longstanding hospital and health system relationships and Akumin’s freestanding operational expertise.” The combined company is projected to have pro forma revenue in excess of $730 million and EBITDA of approximately $210 million based on the trailing twelve months ended March 31, 2021. [3]

Founded in 2018 with the acquisition of Horizon Oncology by Pharos Capital Group, Verdi Oncology has since expanded into the Tennessee and Texas Markets. In July 2019, Verdi announced a partnership with Nashville Oncology Associates, a two-physician medical oncology practice, in which the platform would provide management services, economies of scale, and infrastructure.[4] Similarly, in August 2019, the company launched Verdi Cancer and Research Center of Texas, which would provide medical oncology services and early phase clinical trials in Dallas-Fort Worth. [5]

Since its founding in 2018 by General Atlantic, OneOncology has continued to expand its physician network in both size and geography. The platform, now comprised of 600 providers at 189 sites, has acquired, and subsequently grown, practices in Arizona, California, New England, Pennsylvania, New Jersey, and Texas. [6] For example, OneOncology partnered with North Texas-based Center for Cancer and Blood Disorders (“CCBD”) in 2020 and recently announced the addition of three practices and fourteen physicians to the Texas affiliate. [7] OneOncology targets leading community oncology practices to provide comprehensive and cost-effective cancer care. Oncologists are attracted to the platform’s business model which allows them to remain independent while expanding their services and offering advanced treatment options. “OneOncology gives us the best path forward to continue to bring our patients in Central Pennsylvania advanced cancer care and to grow our clinical trial program. Working with other leading oncology practices across the country who share our vision for delivering the highest quality care in the community setting is what sets OneOncology apart” said Satish Shah, MD of Gettysburg Cancer Center, one of the platform’s most recent targets. [8]

Silver Oak Services Partners led the recapitalization of Integrated Oncology Network (“ION”) in October 2018. Shortly thereafter, ION continued its growth strategy with the 2019 acquisitions of Gamma West Cancer Services (“Gamma West”) and e+CancerCare. As a result of the e+CancerCare acquisition from Kohlberg & Company, ION added 21 outpatient cancer care centers in 10 states. [9] Similarly, the platform expanded their services into communities in Utah, Nevada, Wyoming, and Idaho with the Gamma West acquisition. [10] This partnership also advanced ION’s strategy to affiliate with quality healthcare systems. Recently, ION created a new multispecialty platform in the Cleveland, Ohio market with the acquisition of Southwest Urology in January 2021. As stated by Josh Johnson, ION CEO, “This new venture with Southwest Urology represents a pivotal moment in ION’s strategic direction. Our entrance into the urology space with such a highly-respected practice strengthens our capabilities and positions ION to continue growing specialty networks across the country.” [11]
KKR-backed GenesisCare, an Australian oncology platform, acquired previous standalone operator, 21st Century Oncology. The transaction was completed in May 2020 and valued at over $1 billion. At the time, 21st Century Oncology operated out of 293 locations with nearly 900 affiliate physicians in 15 states. [12] Now the combined entity collectively operates with over 5,000 physicians at 440 locations across the world. [13]
Updating our August 2019 article, the following section addresses follow-up items on previously discussed corporate-backed and standalone operators, McKesson’s The US Oncology Network and Cancer Treatment Centers of America, as well as two new operators, American Oncology Network and The Oncology Institute.

Since July 2019, The US Oncology Network has expanded its presence in California, Pennsylvania, Indiana, and Texas through partnerships with Northern California Prostate Cancer Center, Alliance Cancer Specialists, Northwest Oncology, and Texas Colon & Rectal Specialists. Since April 2020, the Network has brought over 131 new physicians into the organization.[14]

Cancer Treatment Centers of America, an owner and operator of cancer care hospitals and outpatient care centers, announced in November 2020 a partnership with Miller County Hospital designed to meet cancer care needs of Southwest Georgia residents. The organization also notably sold CTCA Philadelphia to Temple University Hospital and announced the closure of CTCA Tulsa in March of this year. CTCA Atlanta opened a comprehensive Women’s Cancer Center this past June with 8 physicians.[15]
Though not currently backed by a private equity group, American Oncology Network (“AON”) has gained significant ground in the oncology space over the past few years. Since its founding in mid-2018, AON, a nationwide group of physician practices focused on improving outcomes in community-based oncology, has expanded to include over 170 providers across 17 states. New partnerships in the past year have been forged in Michigan, Georgia, Washington, Arizona, and Maryland. They also have a presence in Idaho with the recent addition of Summit Cancer Centers.[16] According to recent press releases, reasons given for aligning with AON include greater access to resources (i.e., outpatient pharmacy, pathology, and laboratory services), enhanced care management and technological capabilities. Most recently, AON finalized an $85 million financing package with PNC Bank, priming the organization for continued growth in the development of its information technology platforms, pharmaceutical purchases, practice acquisitions, and expansion of service-line offerings.[17]
Another sub-sector within the oncology space that has garnered recent interest is value-based care. Recently, DFP Healthcare Acquisitions Corp (“DFP”), a special purpose acquisition company (“SPAC”) announced the acquisition of The Oncology Institute (“TOI”), a market-leader in providing value-based oncology care. Regarding the transaction, Richard Barasch, one of the sponsors of DFP, stated “[TOI] has created a scalable, replicable model with difficult-to-duplicate capabilities that facilitate rapid expansion… this business combination will create a well-capitalized company that is poised to expand organically, through accretive M&A activity, and via strategic payor relationships.” While TOI currently operates 50 community-based practices in Florida, Arizona, Nevada, and California, they plan to pursue organic growth opportunities and strategic acquisitions in both new and existing markets.[18]
While the oncology industry continues to trend toward consolidation, there has been a shift from the acquisition or establishment of platform practices to the acquisition of tuck-ins as existing platforms focus on growth through strategic partnerships with practices and physicians. Even with the emergence of such platforms and their subsequent tuck-in activity, the oncology market remains fragmented and poised for continued consolidation as physicians seek alternatives to hospital employment.
Furthermore, private equity firms hold their investments for an average of three to seven years. This trend can be evidenced by the recently announced acquisition of Alliance Healthcare Services by Akumin after five years of ownership by Tahoe Investment Group. Given the age of several of the other platforms, it is likely there will be recapitalizations of these businesses over the next few years.
[1] https://communityoncology.org/wp-content/uploads/2020/04/COA_PracticeImpactReport2020_FINAL.pdf
[2] https://www.alliancehealthcareservices-us.com/alliance-cancer-care-colorado-at-red-rocks-partners-with-scl-health/
[3] https://www.alliancehealthcareservices-us.com/alliance-healthcare-services-announces-acquisition-by-and-integration-with-akumin/
[4] https://www.prnewswire.com/news-releases/verdi-oncology-inc-completes-partnership-with-nashville-oncology-associates-pc-300880500.html
[5] https://www.prnewswire.com/news-releases/verdi-oncology-launches-verdi-cancer-and-research-center-of-texas-300896938.html
[6] https://www.oneoncology.com
[7] https://www.prnewswire.com/news-releases/in-growth-spurt-since-joining-oneoncology-the-center-for-cancer-and-blood-disorders-in-fort-worth-adds-3-practices-and-14-physicians-301331169.html
[8] https://www.oneoncology.com/blog/gettysburg-cancer-center-joins-oneoncology-platform
[9] https://ionetwork.com/2019/06/26/integrated-oncology-network-acquires-ecancercare/
[10] https://ionetwork.com/2019/05/13/integrated-oncology-network-and-gamma-west-announce-transaction/
[11] https://ionetwork.com/2021/01/07/integrated-oncology-network-announces-strategic-partnership-with-southwest-urology/
[12] https://www.genesiscare.com/us/21st-century-oncology-now-genesiscare-collaborates-with-landmark-cancer-center/
[13] https://www.genesiscare.com/us/21st-century-oncology-becomes-part-of-genesiscare/
[14] https://usoncology.com/our-company/news/media-releases/
[15] https://www.cancercenter.com/community/press-releases?page=1
[16] https://www.aoncology.com
[17] https://www.aoncology.com/2021/06/24/american-oncology-network-secures-85-million-in-financing-from-pnc-bank/
[18] https://www.businesswire.com/news/home/20210628005481/en/DFP-Healthcare-Acquisitions-Corp.-Announces-Proposed-Business-Combination-With-The-Oncology-Institute
*This is Part 4 in VMG’s series on transaction structuring considerations for new developments. The other parts in this series can be found here: Part 1, Part 2, Part 3.
This four-part series has provided an overview of the unique considerations that investors, JV partners, developers, hospitals, physicians, and other parties to a new development should evaluate in pursuing a new project. For instance, if a hospital and/or a physician partner are developing a building and then leasing it to a JV entity, the associated lease rate and overall development terms will likely need to be documented as being commercially reasonable[1] and within fair market value (“FMV”) parameters. For investors constructing build-to-suits, primary concerns may revolve around analyzing the risk associated with a particular tenant. For hospitals and physician partners who are joint venturing on a development, the key analyses may involve appropriate allocation of risk, responsibility, and capital vs. non-capital contributions that each party is making to the development. If parties are sharing in development responsibility and risk, then a careful analysis should be undertaken to ensure that parties receive appropriate return given their risk, as well as their various capital and non-capital contributions.
If you are evaluating a new project and require outside assistance, VMG Health is well-equipped to assist with the following:
Finally, as is evidenced by the overview presented within this series, transaction and valuation considerations associated with new construction are complex. VMG has previously published thought leadership focused on a number of areas which are pertinent when evaluating new construction. These include: a) insurable value/replacement cost; b) on- v. off-campus locations; c) ground leases on hospital campuses; d) MOB financial feasibility; e) specialty assets; and f) premium sites (i.e. healthcare projects with high land values). The final section of this series will include more specific examination of each of these individual topics. For further guidance on these topics, please refer to the following resources.
Insurable Value / Replacement Cost – Another item to evaluate prior to (and subsequent to) a new development is insurable value and replacement cost. For more on this topic, please refer to VMG’s published guidance here:
On v. Off-Campus Location – Whether the new project is situated on or off a hospital campus can have a significant impact. Use restrictions, different reimbursement status, ground lease issues, and other factors could all affect the project’s success (and associated development risk). Furthermore, certain real estate fundamentals (related to rent rates, cap rates, and sale prices) also are affected by on- vs. off-campus locations. For more on this topic, please refer to VMG’s published guidance here*:
On-campus Medical Office Buildings: Is a Premium Warranted? If So, When and Why?
*Please note that this article was published in December 2016. Stark Law FMV definition and market conditions have changed in the intervening years; please contact VMG with questions related to how these changes may affect the commentary and analysis in this article.
Ground Lease Considerations – If the proposed development is to be situated on a ground-leased site, a variety of transaction structuring issues must be navigated, along with variance in risk profile and associated market-based return. For further guidance on ground lease considerations associated with hospital campuses, please refer to the following:
Under All is the Land: Ground Leases and Hospital Campuses
Financial Feasibility – In some cases, a building may not be 100% master leased. A hospital or a developer may construct a building with the intent to go “at risk” for a certain amount of space. Risk considerations associated with that development could then include evaluating various real estate market fundamentals, including lease-up period, area payor mix, patient drive-times, demand for various physician specialties, and so forth. For more on this topic, please refer to VMG’s published guidance here:
Financial Feasibility & Speculative Medical Office Building Construction
Specialty Assets – Some build-to-suit projects involve highly specialized real estate assets. Further diligence related to the particular health vertical (ASC, imaging, radiation oncology, specialty hospital, etc.) may be required in this case. Examples of highly specialized sectors on which VMG has published real estate related guidance include life sciences and micro-hospitals. For more, see the below:
Micro-Hospital Real Estate: Six Key Considerations
Spotlight on Life Sciences – Healthcare Real Estate
Premium Sites – Site value affects the “all-in” development cost, and accordingly can affect rental rates in a built-to-suit scenario (or feasibility in a speculative development). Sites located in dense, urban environments have unique considerations which drive pricing. See the following article for VMG’s commentary on considerations related to premium site locations:
Location, Location, Location: Premium Sites and Healthcare Real Estate
For any questions concerning a new or proposed development, please contact VMG Health’s real estate department.
[1] In the December 2, 2020 Final Rule, CMS provided updated and detailed guidance on commercial reasonableness (“CR”). CR is a complex topic, and a detailed CR discussion is beyond the scope of this article. For questions regarding commercial reasonableness in the context of a new real estate development, please contact VMG Health.