Built-to-Suit: Constructing a New Building? Transaction Structuring, FMV, and Compliance Considerations – Part 3: Build-to-Suits and Capital Markets
June 28, 2021
By: Victor McConnell, MAI, ASA, CRE, Frank Fehribach, MAI, MRICS, and Grace McWatters
*This is Part 3 in VMG’s series on transaction structuring considerations for new developments. The other parts in this series can be found here: Part 1, Part 2, Part 4.
Are you constructing a new building, on or off of a hospital campus? If so, there are unique considerations that investors, JV partners, developers, hospitals, physicians, and other parties to a new development should evaluate. For instance, if a hospital and/or a physician partner are developing a building and then leasing it to a JV entity, the associated lease rate and overall development terms will likely need to be documented as being commercially reasonable [1] and within fair market value (“FMV”) parameters. For investors constructing build-to-suits, primary concerns may revolve around analyzing the risk associated with a particular tenant. For hospitals and physician partners who are joint venturing on a development, the key analyses may involve appropriate allocation of risk, responsibility, and capital vs. non-capital contributions that each party is making to the development. If parties are sharing in development responsibility and risk, then a careful analysis should be undertaken to ensure that parties receive appropriate return given their risk, as well as their various capital and non-capital contributions.
This article will provide an overview of key issues to be considered prior to, during, and subsequent to construction of a new building. For assistance with transaction advisory, cost benchmarking, FMV analysis, commercial reasonableness opinions, or other consulting services, please contact VMG Health.
In Part 1, we covered the economics of build-to-suit projects, the rates and returns associated with their development, as well as the types of costs and fees that can be expected during various stages of these projects. In Part 2, we covered variance in credit ratings, lease quality, and tenant risk, and how these factors can influence the profitability of a project. Part 3, which is presented below, will cover the relationship between capital markets and BTS rates, as well as rent factors and amortization rates, and how these factors impact development terms.
Build-to-Suit Rates and Capital Markets
As previously discussed, build-to-suit rates are significantly affected by cap rate trends, among other factors. Prevailing terms for debt also have a significant impact. For instance, in some CTL structures or loan instruments, a landlord may set a rate based upon a fixed number of basis points above an agreed upon index (such as the U.S. Prime Rate or 10-Year Treasury).
An investor may underwrite a real estate investment assuming a certain “spread” between the rate at which they can borrow money as compared to the rate of return that the property will generate. The cost of debt, the length of the loan, and the loan-to-value (“LTV”) are all significant factors for a real estate investor to evaluate relative to the cap rate at which they will acquire a property or the terms they will offer in a build-to-suit or for a tenant improvement allowance. In some cases, a tenant and landlord may negotiate a predetermined rate for TI amortizations, building additions, purchase options, or put options. In these instances, both landlord and tenant will evaluate the terms relative to alternatives (i.e. alternative investment options and alternative borrowing options).
In the last decade, VMG’s valuation & advisory team has worked extensively within the healthcare real estate sector, including on behalf of lenders, REITs, private equity, as well as health systems and physicians. In a recent consulting project, VMG reviewed information from more than 50 prior projects involving specialty healthcare construction. The goal of this internal data review was to generally evaluate prevailing build-to-suit market trends, as well as to analyze specific agreements where a tenant and landlord agreed on a predetermined price for significant capital expenditures on specialty real estate assets. Furthermore, VMG has analyzed select public REIT filings, historical capital market trends, and pertinent publications and surveys from brokerage firms and academic researchers.
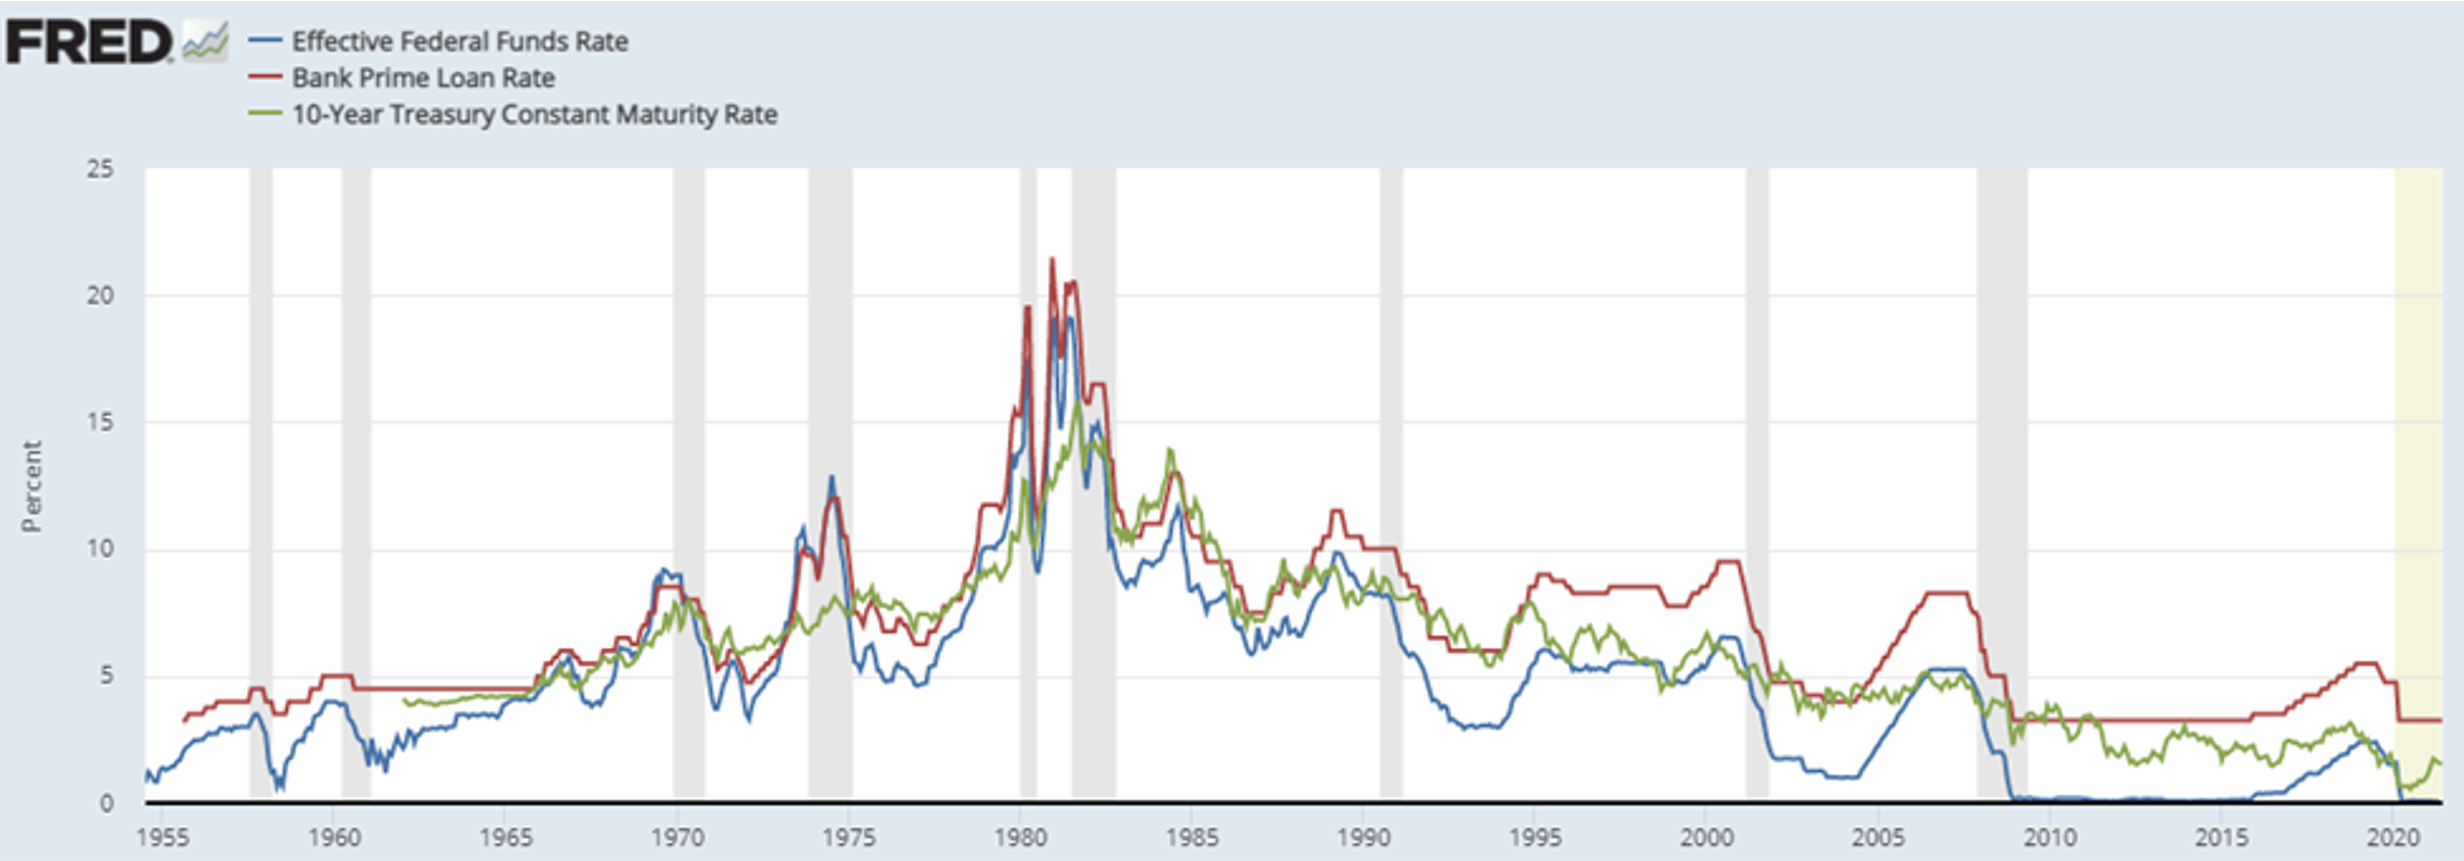
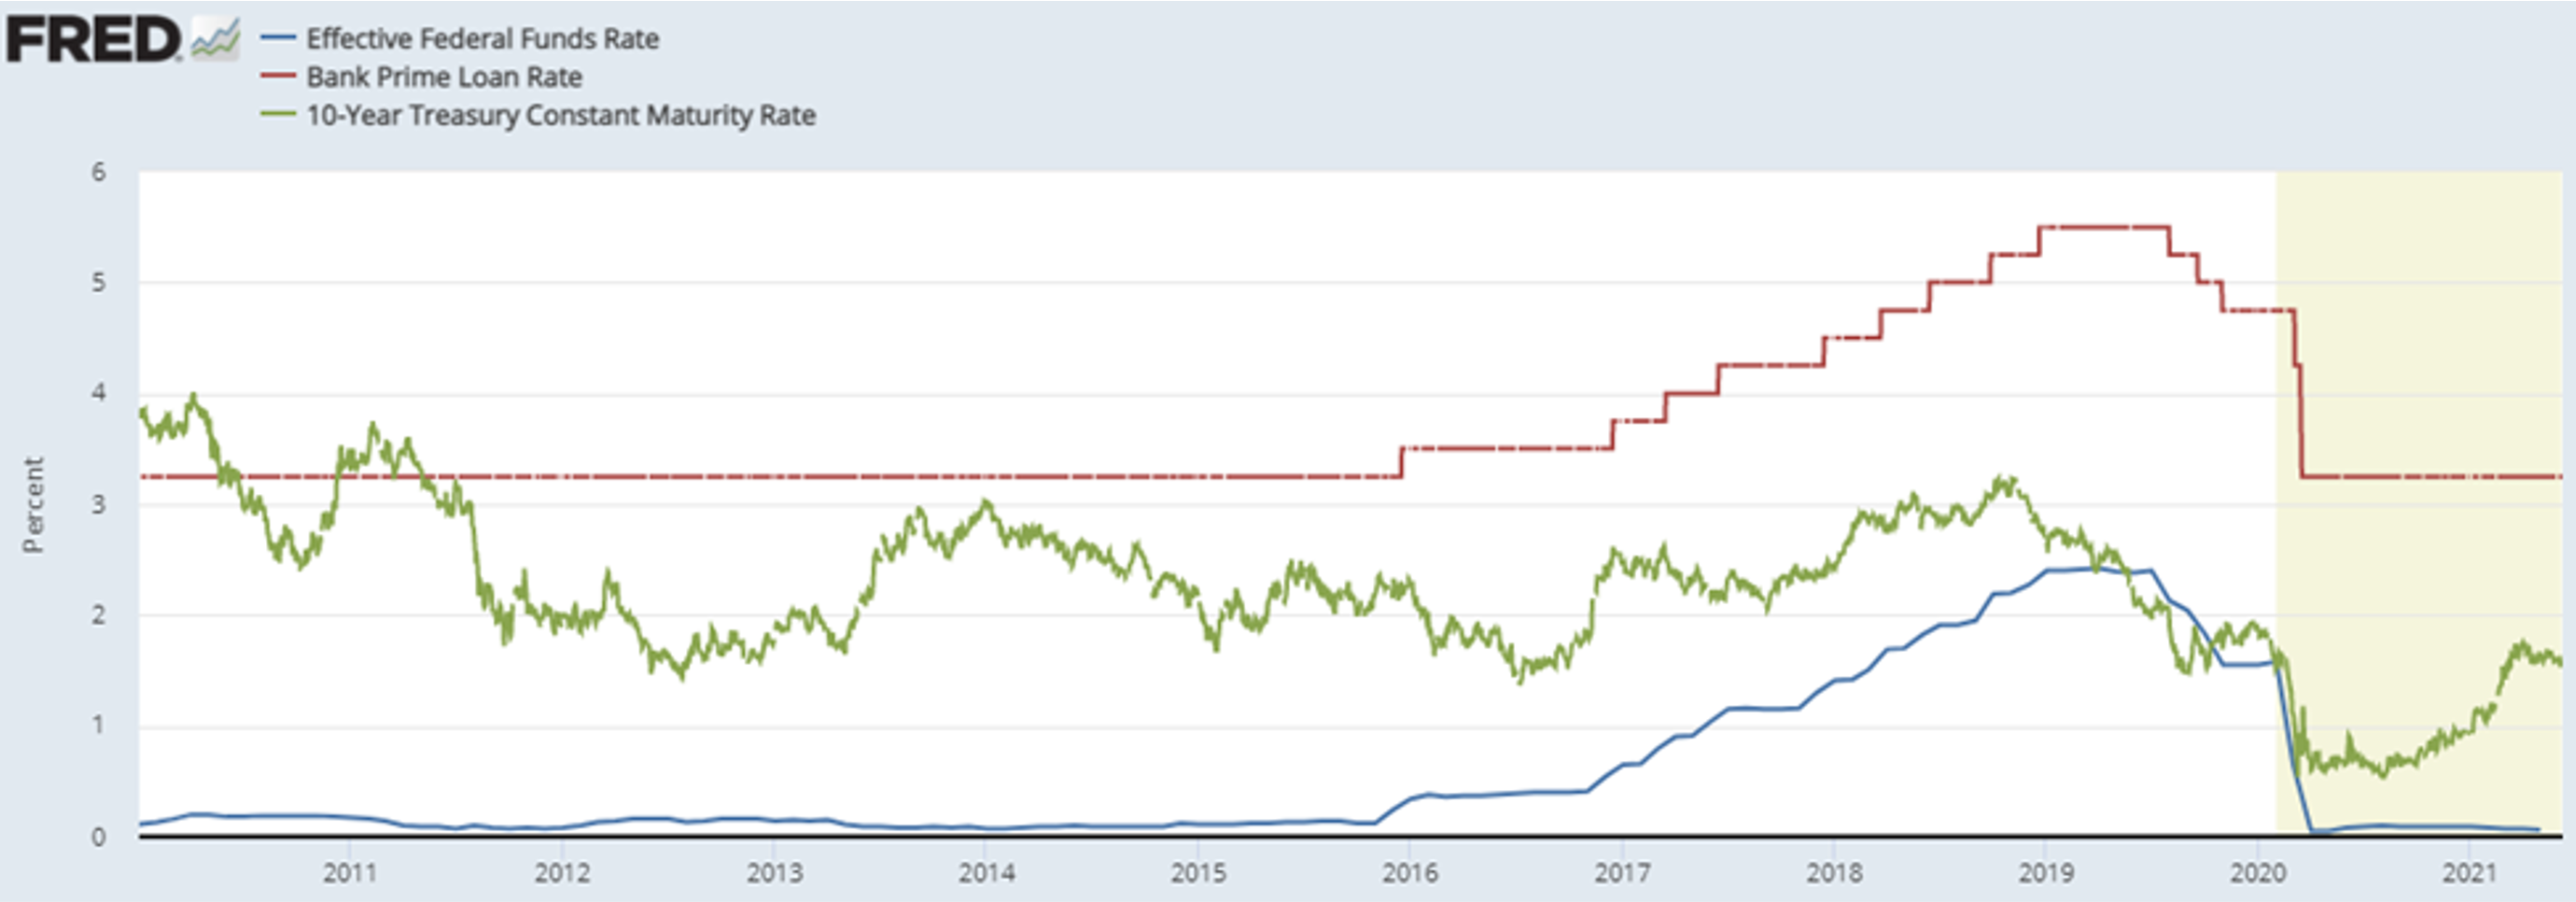
Throughout the commercial real estate sector, prevailing market rates are affected by capital markets conditions, including U.S. Prime Rates (“Prime Rates”). The Prime Rate is generally the lowest rate at which money can be borrowed from commercial banks by non-banks; the Wall Street Journal defines the Prime Rate as “The base rate on corporate loans posted by at least 70% of the 10 largest U.S. banks.” This rate is highly correlated with the Federal Funds Rate. Long-term fixed rates are generally correlated to the 10-Year U.S. Treasury Note (the “10-Year Treasury”). An investor could choose between “locking in” a return on a U.S. Treasury bond (such as the 10-Year Treasury) or investing in the commercial real estate market, where cap rates serve as an indication for an investor’s unlevered return. Unlike a bond with fixed payments, growth in cash flows is anticipated in a real estate investment. Thus, future growth rate assumptions also affect an investor’s overall anticipated return. Examining the spread between the 10-Year Treasury as compared to various commercial real estate (“CRE”) cap rate metrics can reveal changes in investor sentiment, as well as growth expectations. In order to illustrate long-term trends in the capital markets, the following two charts depict the Federal Funds Rate, the 10-Year Treasury Rate, and the U.S. Prime Rate in two periods: since 1950 and since 2010.
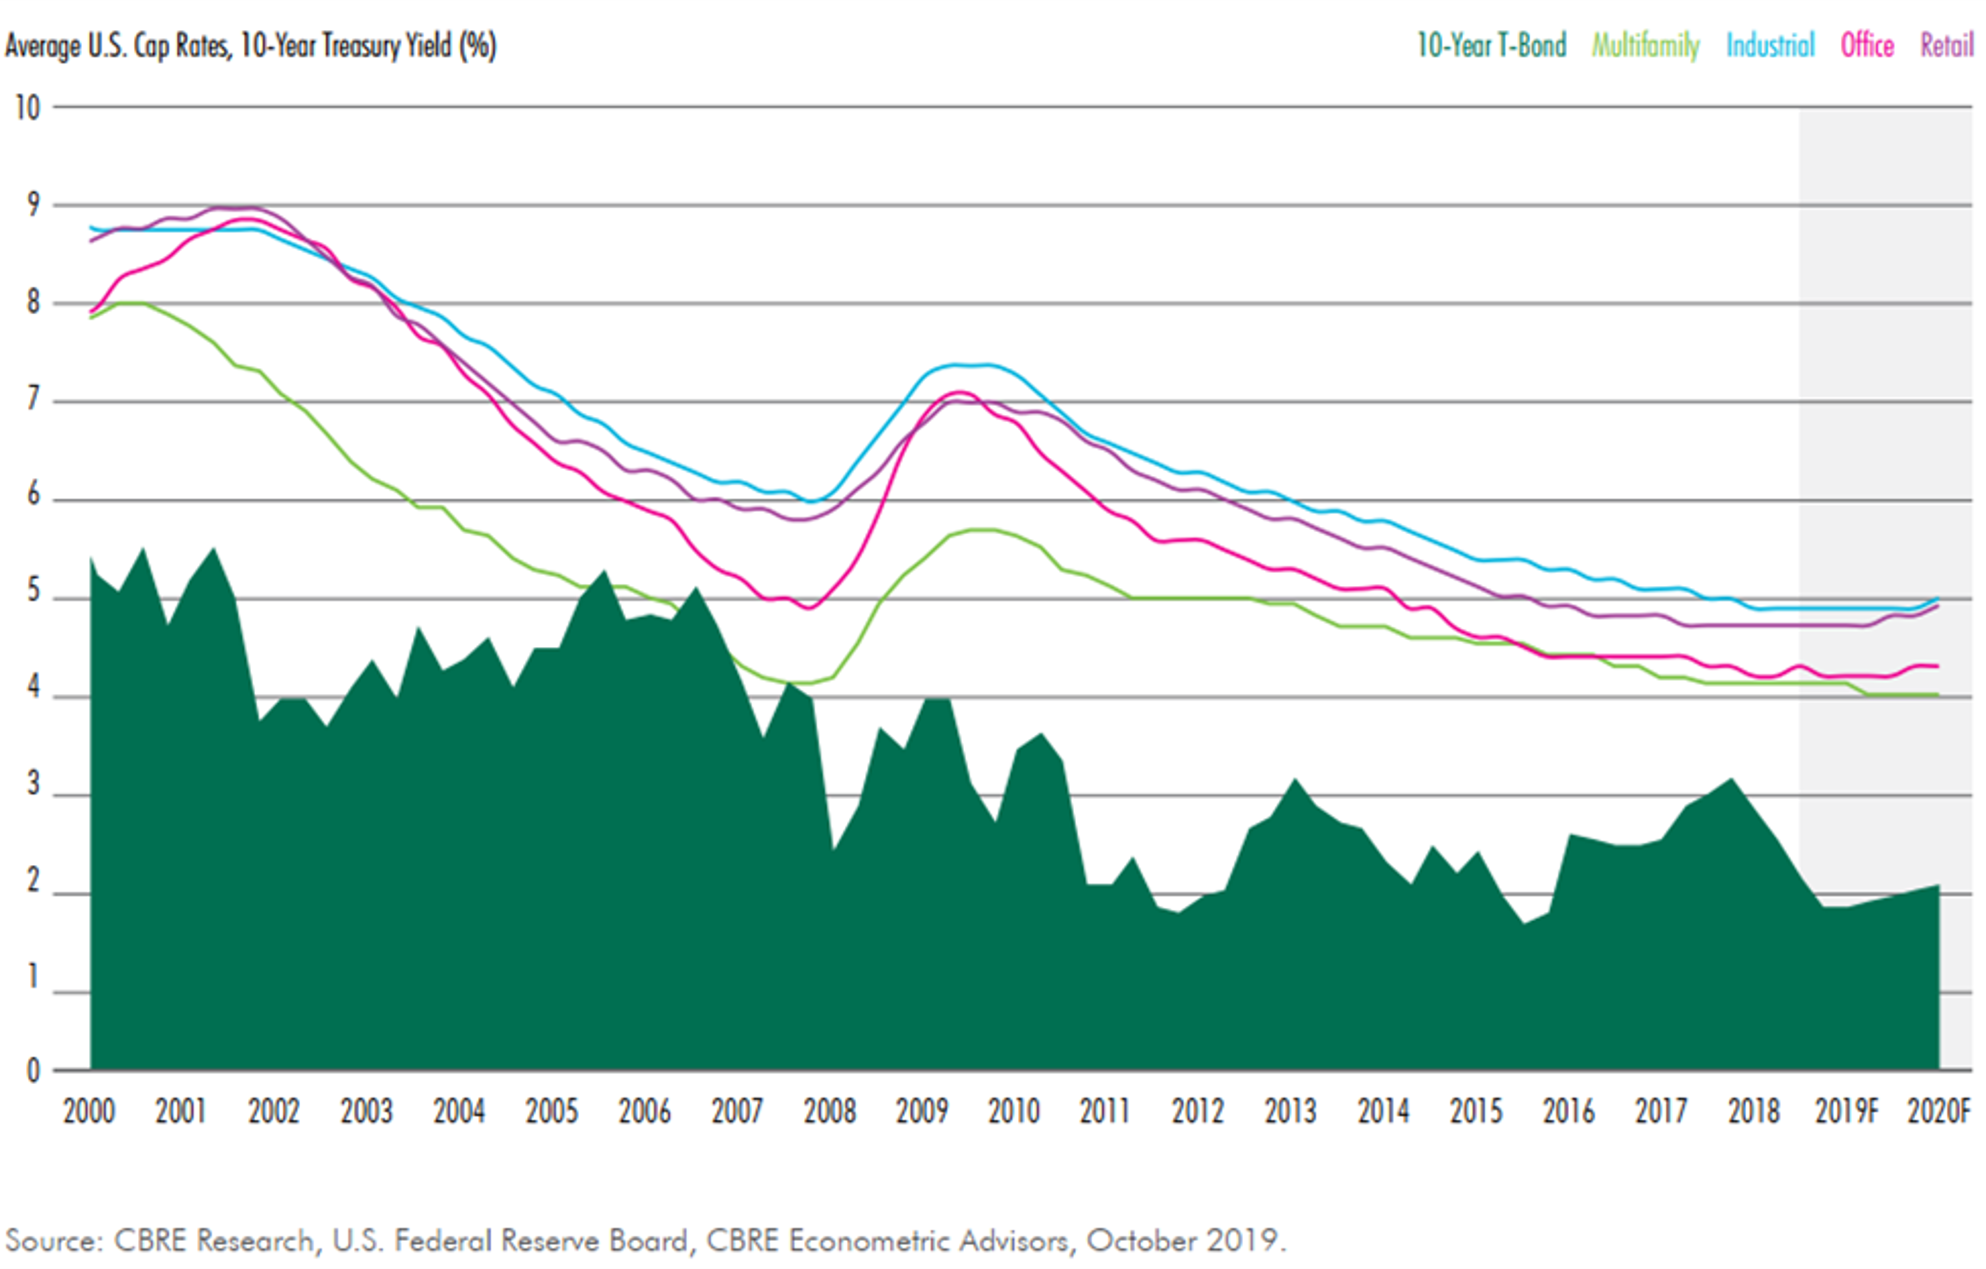
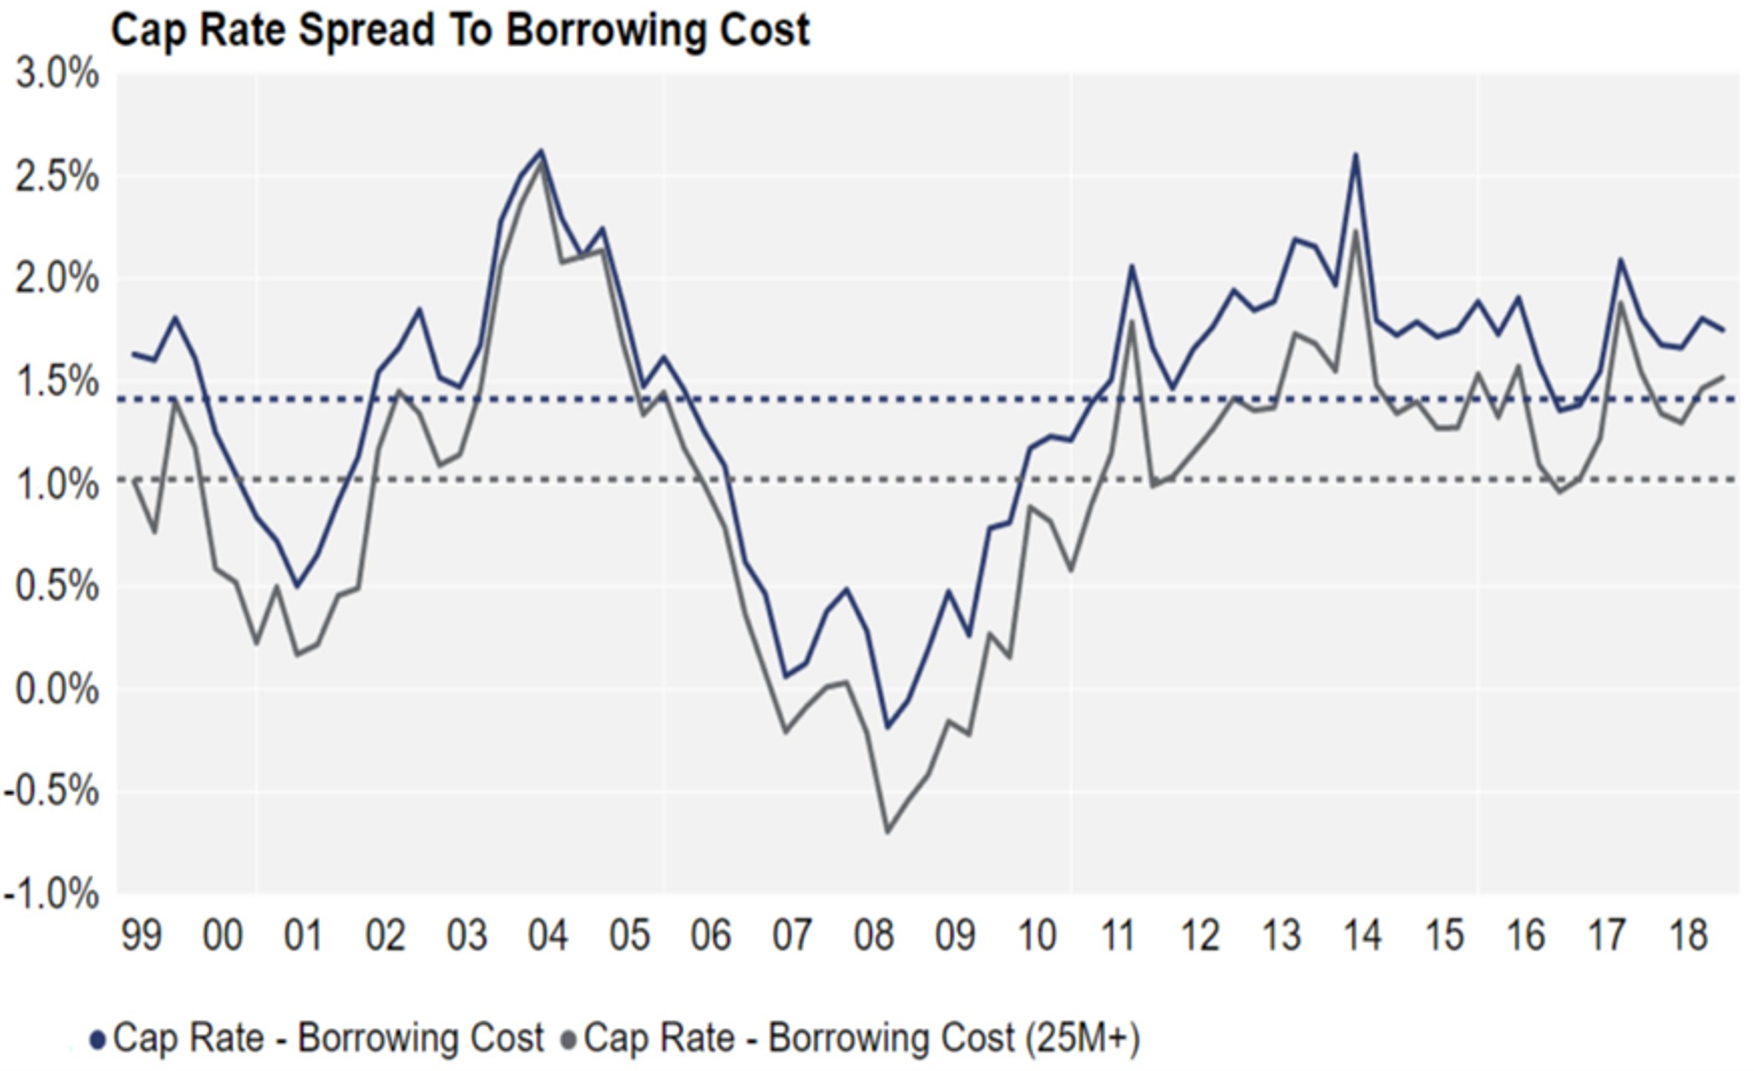
As is evident in the above charts, the three rates are highly correlated, though not perfectly so. These rates also impact the real estate markets, and a variety of research has been performed examining commercial property cap rate trends relative to these rates. The following two charts compare a) core commercial property sectors to the 10-year U.S. Treasury and then b) cap rates as compared to borrowing costs.
Source: Quantum Real Estate Advisors February 2019 report (additional sources noted as ACLI, NCREIF, CoStar Portfolio Strategy)
Though significant fluctuations are evident, the preceding charts also illustrate general long-term trends related to the spread between the Prime Rate and 10-Year Treasury.
Between 1990 and 2020, the median spread between the Prime Rate and the 10-Year Treasury was 137 basis points, whereas the 25th and 75th percentile during that period was 42 basis points and 228 basis points.
Between 1990 and 2020, the median spread between the 10-Year Treasury and the Federal Funds rate was 160 basis points, with a 25th and 75th percentile of 56 and 264 basis points, respectively. Thus, the spread between Prime Rate and Federal Funds rate during this period would be 297 basis points on a median basis.
Prior to the onset of COVID-19 and its impact on the real estate markets, CBRE’s “U.S. Real Estate Market Outlook 2020” noted that “the minimal increase in the 10-Year Treasury yield anticipated for 2020 will help limit cap rate increases and keep the spread about 200 to 300 bps above the risk-free rate next year.” This statement illustrates how institutional real estate investors place real estate returns into context relative to other rate benchmarks, such as the 10-Year Treasury. A study published by Ted. C. Jones, PhD (former chief economist of Texas A&M University’s Real Estate Center) benchmarked commercial real estate cap rates (sourced from Real Capital Analytics) as compared to the 10-Year Treasury on a trailing 12-month (TTM) basis, under the thesis that commercial real estate transactions can take roughly 12 months to close. This study focused on the period from Q1 2001 through Q3 2016. The median spread was 404 basis points, whereas the minimum and maximum were 193 and 509 basis points, respectively. Another study published by Quantum Real Estate Advisors in February 2019 (utilizing slightly different sources and methodology) revealed a general range (between the 10-Year Treasury and CRE cap rates) of 100 to 450 basis points with an average spread of around 300 basis points.
In evaluating a RoC rate for a new development, it should be noted that there is a difference between a rent factor and an amortization rate. By way of illustration, suppose $5,000,000 was provided by a landlord to a tenant for a 10,000-square-foot expansion project ($500/SF). If the landlord and tenant agreed to an 8% rent factor, the rent would be $400,000 per year ($40/SF), e.g. the multiplication of the cost ($5M) by the factor (0.08). However, if landlord and tenant amortized the cost over a 15-year term at 8% (compounded monthly), the annual rent would be $573,391 ($57.34/SF). The same amount amortized over a 25-year term would result in an annual rent of $463,090 ($46.31/SF).
Typically, if a landlord is offering funding based on a rent factor rather than an amortization rate, they are also anticipating residual value at the end of the lease term, or the lease term is long enough that the difference between a rent factor and an amortization rate is minimal. Assuming a 25-year lease term, an amortization rate of 6.75% would result in a similar rent indication as an 8.0% rent constant.
Ultimately, any analysis of a build-to-suit project (or funding of a new addition to an existing hospital campus) should involve careful consideration of and distinction between appropriate amortization rates or rent factors.
Within VMG’s analysis of hundreds of FMV lease rate assessments across the United States, VMG has inquired as to prevailing TI amortization rates for medical office building finish out. The range of TI rates offered by landlords to tenants is affected by capital markets conditions, just as cap rates and other return rates are correlated with various rate benchmarks (such as the 10-Year Treasury). Examples of landlords and tenants agreeing to a formula which predetermines a rate in the future for a lease adjustment or a purchase option are less common, though they do exist. For further discussion of a structure whereby a lease adjustment or purchase option is based on a fixed formula, please contact VMG Health’s real estate division.
Though not always associated with build-to-suits and new construction, the sale/leaseback market also contains pertinent indicators, as well as scenarios which can be somewhat analogous to a build-to-suit. For instance, VMG has reviewed leases executed in sale/leaseback agreements with a REIT whereby the REIT would execute the sale/leaseback at a certain rate and would simultaneously offer to fund certain capital additions at a similar or identical return rate (with this reflected in the lease agreement). Essentially, the REIT was evaluating the risk associated with the tenant/operator as equivalent in two separate scenarios: 1) providing funds in exchange for receipt of the operator’s underlying real estate as collateral (the sale/leaseback) and 2) providing funds for a capital addition to the existing collateral in exchange for the operator’s commitment to lease the capital addition at the same return rate. However, in both cases, in selecting its return rate (whether an amortization rate or rent factor), the REIT is also assessing the likelihood of renewal and the residual value that may exist at the end of the lease term.
A variety of survey data pertaining to lending rates for permanent and interim financing also exists. RealtyRates.com publishes an investor survey quarterly with rates specific to a variety of commercial real estate industries, including healthcare / senior housing. The 2nd Quarter 2021 version of this survey featured the following for the Health Care / Senior Housing sector:
Permanent Financing: Rates were quoted on a spread over base basis, with “base” defined as the 10-year Treasury. These ranged from 134 basis points (bps) to 670 bps, with an average of 364 bps. Overall interest rates ranged from 2.60% to 7.96%, with an average of 4.90%. DCRs ranged from 1.10x to 2.25x, with an average of 1.50x, while LTVs ranged from 0.50 to 0.90, with an average of 0.71. Amortization periods ranged from 15 to 40 years, with an average of 25 years, while loan terms ranged from 3 to 25 years, with an average of 14 years.
Interim Financing (Construction): On a spread over base basis, rates ranged from 95 bps to 685 bps, with an average of 394 bps. Overall interest rates ranged from 4.20% to 10.10%, with an average of 7.19%, with loan fees of 1.50% to 5.50% (average of 3.36%). LTVs ranged from 0.50 to 1.0, with an average of 0.78. Loan terms were 12 to 24 months, with an average of 18 months. Amortization was interest only.
The preceding summary of the various indices reveals the range of terms that exist in the capital markets. In a build-to-suit scenario, the overall market trends, as well as the specifics associated with a particular site or tenant, will affect the appropriate overall development terms. If a JV entity between two healthcare providers (health system and outpatient platform company or physician group, for instance) involves providing debt to the project, then the terms should be consistent with FMV and commercially reasonable given the overall transaction profile.
If a “rent constant” is being fixed in advance, then a prudent tenant and landlord will both evaluate capital market trends (and likely projections) to determine where cap rates (or the debt markets) are likely to be at the time that either the debt is secured, or the project is sold (or both). If the funding is tied to a certain capital markets indicator, then tenant and landlord should evaluate long term trends in the selected index.
Regardless of structure (negotiated rent per square foot vs. predetermined rent factor vs. rent tied to a capital markets index), the appropriate spread (and overall development profit) should be considered in the context of the various risks and responsibilities that landlord/developer versus tenant are undertaking.
This concludes Part 3 of VMG Health’s four-part series.
Footnotes:
[1] In the December 2, 2020 Final Rule, CMS provided updated and detailed guidance on commercial reasonableness (“CR”). CR is a complex topic and a detailed CR discussion is beyond the scope of this article. For questions regarding commercial reasonableness in the context of a new real estate development, please contact VMG Health.
Built-to-Suit: Constructing a New Building? Transaction Structuring, FMV, and Compliance Considerations – Part 2: Credit Ratings and BTS Healthcare Assets
June 22, 2021
By: Victor McConnell, MAI, ASA, CRE, Frank Fehribach, MAI, MRICS, and Grace McWatters
*This is Part 2 in VMG’s series on transaction structuring considerations for new developments. The other parts in this series can be found here: Part 1, Part 3, Part 4.
Are you constructing a new building, on or off of a hospital campus? If so, there are unique considerations that investors, JV partners, developers, hospitals, physicians, and other parties to a new development should evaluate. For instance, if a hospital and/or a physician partner are developing a building and then leasing it to a JV entity, the associated lease rate and overall development terms will likely need to be documented as being commercially reasonable [1] and within fair market value (“FMV”) parameters. For investors constructing build-to-suits, primary concerns may revolve around analyzing the risk associated with a particular tenant. For hospitals and physician partners who are joint venturing on a development, the key analyses may involve appropriate allocation of risk, responsibility, and capital vs. non-capital contributions that each party is making to the development. If parties are sharing in development responsibility and risk, then a careful analysis should be undertaken to ensure that parties receive appropriate return given their risk, as well as their various capital and non-capital contributions.
This article will provide an overview of key issues to be considered prior to, during, and subsequent to construction of a new building. For assistance with transaction advisory, cost benchmarking, FMV analysis, commercial reasonableness opinions, or other consulting services, please contact VMG Health.
In Part 1, we covered the economics of build-to-suit projects, the rates and returns associated with their development, as well as the types of costs and fees that can be expected during various stages of these projects. Part 2, which is presented below, will cover variance in credit ratings, lease quality, and tenant risk and how these factors can influence the profitability of a project. Parts 3 and 4 will be presented separately and will cover the relationship between capital markets and BTS rates, as well as rent factors and amortization rates, and how these factors impact development terms.
Credit Ratings and Their Impact on Build-to-Suit Deals
The terms that a landlord/developer will offer a tenant in a build-to-suit scenario are affected by the tenant’s credit rating. Some build-to-suit projects include lease guarantees from parent entities (hospital systems, platform companies, etc), while others are guaranteed by a facility-specific LLC or a physician group. A credit guaranty may be a non-capital contribution to a development that should be taken into account in a JV structure (or in setting the RoC rate with the developer). In the event that a JV develops a new building, but development responsibilities and capital (or non-capital) contributions vary between the parties, then adjustments may be required (in terms of ownership percentages versus cost, or in terms of the go-forward project lease rate) to ensure that the deal structure is consistent with FMV and is commercially reasonable.
Credit ratings and tenant risk are complex topics which have been analyzed extensively within the commercial real estate sector. A “credit tenant” is defined differently by different sources. One definition is as follows: “A tenant in a retail, office, or commercial property with a long history in business, strong financial statements, or a large market presence that could be rated as investment grade by a rating agency. Because of the likelihood of honoring their leases, credit tenants are considered less risky to lease to, and developments with credit tenants as anchors are considered less risky investments for lenders.” [2]
It is worth noting that the preceding definition defines a “credit tenant” as not strictly limited to an entity with a credit rating, though some market participants do define it as such. For instance, a research paper by Sonneman and Yerke published in The Counselors of Real Estate in 2013 defined a credit tenant as “one whose bond issues fall within the investment grade levels set by one of the three major rating agencies.” [3] However, the article also defines an ideal single-tenant, investment grade lease as: being long-term with no early termination, a triple-net or absolute net structure, periodic rent increases, and featuring multiple renewal periods.
The accompanying chart (“Comparative Credit Rating Scale by Agency”) provides comparison of the credit ratings for the three main credit rating agencies: Moody’s, Standard & Poor’s (“S&P”), and Fitch Ratings.
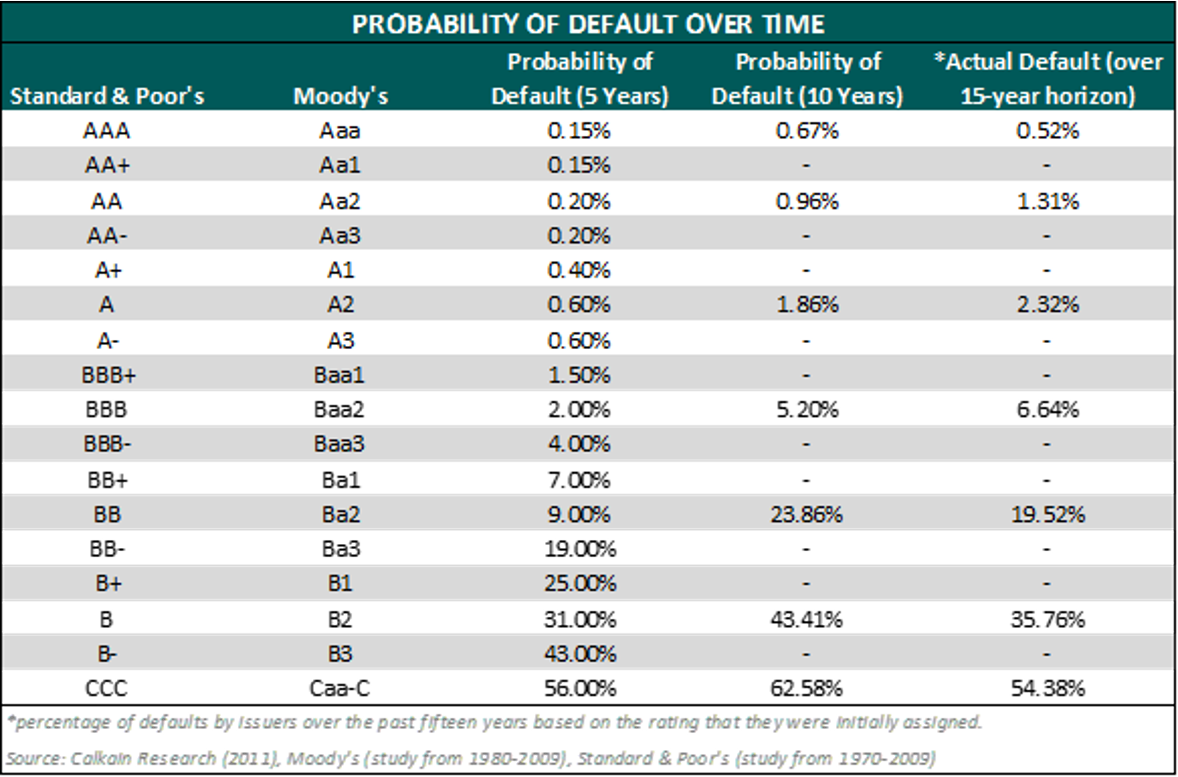
The ratings agencies have periodically evaluated their ratings relative to actual default rates and have assigned default probabilities for each rating, as summarized in the accompanying table (“Probability of Default Over Time”).
Calkain, a boutique commercial real estate firm focused in the net lease market, has a research arm which provides extensive market commentary within the net lease sector and has published numerous surveys and white papers. In a 2011 study of credit ratings and cap rates, Calkain noted that “Moody’s also measured default rates from 1970-2009 based on a company’s issued rating. At 5, 10, and 20 years, investment grade companies’ likelihood of defaulting were .973%, 2.503%, and 6.661% respectively. On the other hand, speculative grade companies over the same time horizons were 21.359%, 34.005%, and 49.649%, respectively.”[4] Entities with inferior credit ratings not only tend to default at a greater overall rate over a long period, but they also default more quickly when starting from a given point in time. For instance, Calkain’s paper also stated that “According to a study done by S&P from 1981-2009, the lower the credit rating, the faster the time of default. For example, the AAA rated companies that defaulted did so on average at 16 years from the issuance of rating, BBB and CCC rated companies did so at 7.5 and 0.9 years respectively. This shows that not only do lower rated companies have a higher probability of default, but [default] also happens at an accelerated pace with lower rating.” Within the context of the single-tenant, net-lease sector, a default likely equates to the early termination of a lease. The consequences of early lease termination depend on the lease rate relative to market as well as the risks and costs related to re-tenanting the property. Real estate investors in the single-tenant net lease sector must evaluate these considerations in their acquisition decisions. For a single-tenant, net-leased specialty asset, the cost of re-tenanting the property can be significant. In a build-to-suit scenario, a developer, lender, or investor must carefully evaluate potential downside risk scenarios in determining an appropriate RoC rate.
A paper titled “Net-Leased Single-Tenant Risks” published by George Renz in the November – December 2014 CCIM Institute publication attempted to address the question of the likelihood of a tenant actually paying rent over a 10-20+ year time horizon.[5] The paper stated that “an analysis of 100 NLST [net-lease single-tenant] deals answers the question. Out of 100 transactions with locations nationwide ranging in value from $322,000 to $9 million, only six tenants filed bankruptcy or did not pay rent. The breakdown: 1) of 70 investment-grade and national tenants, no investment grade tenants defaulted and only one national tenant defaulted; 2) of 30 franchisee, regional, and local tenants, five defaulted.” The paper provided minimal detail regarding the 100-transaction sample, and thus extrapolating any broad default probabilities would be difficult. That said, the article serves as another example of the general commercial real estate investment community’s continued attempt to evaluate risk within the single-tenant net lease sector; the activities of these market participants ultimately affect investment decisions (and, correspondingly, cap rate trends).
Other researchers have analyzed real estate lease backed securities in evaluating risk. McMurray and Mundel noted in a 1997 academic study that “for risky lessees, i.e. all lessees where there is a possibility of default in some period t < T, a credit spread must be added to the risk-free discount rate, r, in the equations shown previously.” [6] The paper noted significant risk factors impacting normative lease credit spreads including lease maturity, mean reversion, correlation, and volatility.
The purpose of discussing real estate backed securities relative to an examination of the build-to-suit healthcare real estate market is to illustrate the expansion of the buyer pool which occurs when a property features a lease backed by a credit-worthy corporate entity; properties which lack credit rated tenants could not be included within an investment grade real estate lease backed security, thus eliminating a portion of the buyer pool (institutional buyers that only invested in highly rated securities; significantly, this portion of the buyer pool typically has a lower cost of capital). If the combination of real estate, lease quality, and tenant quality is sufficient to attract institutional buyers, an impact on the property’s value (i.e. cap rate) would be expected.
In some cases with a specialty built healthcare asset (particularly on a hospital campus), the ability of a developer/landlord to sell may be subject to certain restrictions. However, even absent a sale, the risk profile associated with the lease income stream affects the debt terms achievable in the capital markets; while debt issuance is different than the sale of a property, the terms of the debt ultimately affect the developer/landlord’s profitability.
The previously referenced 2011 Calkain study noted “each lender has different criteria for who they lend to. For example, CTL [Credit Tenant Lease financing] lenders will only lend to investment tenants regardless of real estate. On the other hand, insurance companies such as American Fidelity assess all types of companies and measure them through H and Z scores to determine if they qualify. […] On [American Fidelity’s] list of approved retail credits, there were 71 retailers they would lend to and 55 not approved.” This excerpt illustrates another issue which can cause cap rate compression: superior available financing terms for properties with comparatively lower risk profiles. If a buyer can access financing at a lower rate, then it follows that the buyer would be willing to acquire the property at a lower cap rate, as the spread between the cap rate and the financing represents an arbitrage opportunity.
VMG has previously performed extensive research into the impact of credit guarantees on a variety of outpatient and inpatient healthcare assets. The impact of a credit tenant is more significant, generally, when the underlying real estate is less valuable. When the underlying real estate features strong fundamentals (i.e. growing demographic trends, high land values, strong occupancy rates, increasing rent rates, and so forth), then the impact of a credit guarantee may be diminished.
For further information concerning quantifying the value of a lease guaranty, please contact VMG Health.
The next section (Part 3) in this Build-to-Suit series involves further discussion of build-to-suits and capital markets.
Footnotes & Sources:
[1] In the December 2, 2020 Final Rule, CMS provided updated and detailed guidance on commercial reasonableness (“CR”). CR is a complex topic and a detailed CR discussion is beyond the scope of this article. For questions regarding commercial reasonableness in the context of a new real estate development, please contact VMG Health.
[2]The Dictionary of Real Estate Appraisal, 6th Edition (Chicago: Appraisal Institute, 2015).
[3] Sonneman, Donald, et al. “Comparing Value: U.S. Government Office Leases vs. Credit Tenant Leases.” The Counselors of Real Estate, Spring 2013, Vol. 38, Number 1, pp. 20-30.
[4] Caswell, Chris. “Credit Rating Effect on the Marketplace” Calkain Research, reviewed by David Sobelman, Stanley Wyricz, Richard Murphy, Michael O’Mara, Orzechowski, Winston. 2015, pp. 1-15.
[5] Renz, George L. “Net-Leased Single-Tenant Risks.” CCIM Institute, November│December 2014, pp. 22-25.
[6] McMurray, John P., Samuel M. Mundel. “Real Estate Lease-Backed Securities.” Massachusetts Institute of Technology, September 1997, pp. 1-84.
Built-to-Suit: Constructing a New Building? Transaction Structuring, FMV, and Compliance Considerations
June 22, 2021
By: Victor McConnell, MAI, ASA, CRE, Frank Fehribach, MAI, MRICS, and Grace McWatters
*This is Part 1 in VMG Health’s series on transaction structuring considerations for new developments. The other parts in this series can be found here: Part 2, Part 3, Part 4.
Are you constructing a new building, on or off of a hospital campus? If so, there are unique considerations that investors, joint venture (“JV”) partners, developers, hospitals, physicians, and other parties to a new development should evaluate. For instance, if a hospital and/or a physician partner are developing a building and then leasing it to a JV entity, the associated lease rate and overall development terms will likely need to be documented as being commercially reasonable[1] and within fair market value (“FMV”) parameters. For investors constructing build-to-suits, primary concerns may revolve around analyzing the risk associated with a particular tenant. For hospitals and physician partners who are joint venturing on a development, the key analyses may involve appropriate allocation of risk, responsibility, and capital vs. non-capital contributions that each party is making to the development. If parties are sharing in development responsibility and risk, then a careful analysis should be undertaken to ensure that parties receive appropriate return given their risk, as well as their various capital and non-capital contributions.
This article, which is presented as a four-part series, will provide an overview of key issues to be considered prior to, during, and subsequent to construction of a new building. For assistance with transaction advisory, cost benchmarking, FMV analysis, commercial reasonableness opinions, or other consulting services, please contact VMG Health.
PART 1: Overview, BTS Economics, and Development Risk & Responsibility
Build-to-Suit – What is It?
The term “build-to-suit” (“BTS” or “built-to-suit”) is not formally defined within The Dictionary of Real Estate Appraisal; however, the Commercial Real Estate Encyclopedia defines it as “a type of real estate transaction where a property owner or developer will construct a building for sale or lease that will be built to the tenant’s or buyer’s specifications.” Within healthcare settings, developers commonly develop buildings for tenants who will then lease the building subsequent to construction. In some cases, a hospital (or JV between a hospital and a physician group) may develop a new building and then master lease it to an operating entity. In other cases, the building may be constructed by a third party (developer, REIT, private equity, etc.) who will then lease the space to a healthcare tenant.
Economics of a Build-to-Suit
In a typical build-to-suit arrangement that is to be 100% leased by a single tenant, a developer will construct a property that the tenant will lease at a percentage multiplied by the developer’s “all-in”[2] cost. Market participants differ in the terminology utilized to refer to this “build-to-suit rate”; common terms include return-on-cost (“RoC”) rate, initial yield rate, rent constant (or factor), development constant, or developer’s yield.
In these arrangements, a developer receives a return via the rent collected over the course of the lease term, as well as via reversion upon project sale (unless there is no residual, in which case a developer achieves their targeted return via rent collected during the holding period). The developer will generally anticipate selling the property at an overall capitalization rate (“cap rate”[3]) that is below the build-to-suit rate. Factors which can affect the RoC rate are similar to factors which affect cap rates. These factors include, but are not limited to: a) tenant creditworthiness; b) financing terms associated with the transaction; c) length of lease term; d) lease escalations; e) a property’s location and physical characteristics, such as design and construction quality; f) expense structure between tenant and landlord; g) renewal probability; h) anticipated reversion; i) trends in the capital markets; j) industry specific trends; k) landlord and tenant motivations; and l) a property’s construction cost and implied lease rate relative to market.
Some developers build and hold projects over a long period, while other seek to sell projects based on a shorter forecasted hold period [4]. Furthermore, the developer is likely borrowing money both during the construction period (an interim construction loan) as well as subsequent to construction (permanent financing). In these cases, the developer will likely anticipate borrowing at a rate that is a certain number of basis points below their build-to-suit rate. Similarly, if a landlord is providing funding for tenant improvements in an existing building, the landlord will typically provide those funds to the tenant at a rate above the landlord’s cost of borrowing. When offering tenant-specific tenant improvement (“TIs”) allowances, a real estate investor will evaluate how much residual value, if any, will remain at the end of the lease term. If the TIs are highly specialized and tenant specific, an investor may seek to amortize the full cost of the TIs into the lease term, as the likelihood of residual value to another tenant is low. In some cases, a landlord may offer an amortization schedule which exceeds the lease term, although the tenant may be required to pay the unamortized cost of the TIs if they choose not to renew the lease.
In structuring a lease associated with a build-to-suit, the overall economics must be carefully considered in order to ensure that each party is receiving a return commensurate with their risk and responsibility.
Evaluating Build-to-Suit Rates
Build-to-suit rates (i.e. rent constants) are highly correlated with cap rates and other capital market indicators. However, specifics concerning lease structure (such as absolute net vs. triple-net) can also affect an appropriate rent constant. For instance, in an absolute net lease structure, a tenant will bear more ongoing capital expenditures during the lease term, which decreases the risk profile for the landlord. Term length also affects an appropriate build-to-suit rate, as longer terms are generally more favorable to landlords due to lowering risk profiles (which can translate to lower cap rates or superior financing options).
VMG has conducted extensive research into cap rate trends across various healthcare real estate asset classes. In the course of our valuation and consulting work pertaining to proposed projects, VMG Health has also interviewed multiple investors, developers, and brokers active in the healthcare real estate market regarding cap rate and build-to-suit data for various assets. While return-on-cost rates offered by build-to-suit developers generally compress along with overall capital markets trends, historical averages for a particular sector, as well as forecasted risks for a particular tenant (and their associated industry) will affect the build-to-suit terms available at any given time.
Cap rates and RoC rates are different, though correlated. As previously noted, when developers build specialty healthcare assets for tenants on a build-to-suit basis, the developer’s profit is often a function of the “spread” between their RoC rate and their exit cap rate. For instance, as noted previously, if a developer constructs a project at a 9.0% RoC rate and then immediately sells the project for an 8.0% cap rate upon completion (a 100 BPS spread), the developer will have made a 12.5% unlevered profit (without considering timing and other certain factors). A project built at a 7% RoC and sold at a 6% cap rate would represent a 16.7% unlevered profit for the developer.
In addition to the project-specific or tenant-specific risk factors which can affect risk and profit expectations, the size of the development can also affect the spread sought by the developer, as developer profits tend to be smaller on a percentage basis for a $50 million project as compared to a $5 million project.
Ultimately, build-to-suit rates and development profit are largely affected by the risk associated with the tenant, as well as with the risks and responsibility allocation between developer and tenant.
Tenant risk will be discussed later in this article, whereas an overview of development risk and responsibility is presented in the following section.
Development Risk and Responsibility
In constructing a new real estate development (or performing significant renovations on an existing building), a number of different direct costs[5]and indirect costs [6] are required. Furthermore, time and expertise are required to manage various parts of the construction process. Developers also commonly take a variety of risks during the development process, and the overall return achieved by a developer is generally considered to represent compensation for the risk taken on by the developer. There are a wide array of potential risks (and time expenditures) that a developer may incur, including items such as, but not limited to, the following: a) market analysis and feasibility studies to assess demand prior to development; b) site selection and land acquisition, including potential negotiations with multiple sellers to assemble a large development tract; c) environmental assessments; d) site plans, permitting, and building plans; e) zoning analysis and applying for zoning changes or use exceptions; f) infrastructure assessment and improvement; g) construction financing; and h) other factors. A developer must also consider and factor in the potential for project failure at various points in the early stages, which could result in significant financial losses for the developer. The early-stage land development process can be delayed by a variety of factors, including environmental issues, design delays, zoning and entitlement delays, appeals (and/or litigation) from nearby property owners or other interest parties, and disputes between a developer and the local municipality or other regulatory authorities. During the construction process, a developer may also face risks associated with construction delays, cost overruns, financing issues, pre-leasing risk, and other factors. Subsequent to completion, a developer may continue to have various risks in a project, depending on lease-up, potential exit strategy, tenant default, property management, ongoing capital expenditures, and other considerations.
Given the extended timeline in which development risk is incurred, the timing of an equity investment in an LLC which owns a new building affects the way in which the ownership interest is valued. Assuming an investment is made at very beginning, when the proposed project is just a plan, then the pricing for an equity buy-in into the real estate ownership entity may correspond more closely to direct cost and indirect cost of the development. This is because all investors paying for the construction of the project are sharing in the risks of the project’s development. This assumes that project risks are shared evenly and equitably among JV partners; in these cases, a project’s entrepreneurial profit/incentive would generally align accordingly.
When a project is complete, the sale of a minority equity position (or the sale of a 100% ownership position) in the project will generally no longer correspond as closely to the aggregate construction costs, as the development risk has already been incurred. Thus, post-completion, equity positions should generally be based upon their fair market value (because the equity investor post-completion is no longer taking on development risk and thus would not reasonably be expected to participate in the entrepreneurial profit/incentive associated with the development).
A real estate development can involve a developer and a variety of individuals or companies responsible for managing or overseeing components of a project. Within commercial real estate development, developers are sometimes hired on a fee for development basis, with developer’s fees often included within a project’s budgeted soft costs; this generally represents a lower risk profile for a developer. Developer’s fee is defined as follows: “typically, a payment by a property owner to a third party for overseeing the development of a project from inception to completion, included among the direct and indirect costs of development. Sometimes, the term is used to describe the time, energy, and experience a developer invests in a project as well as a reward for the risk undertaken.” [7] Developer’s fee is distinct from “developer’s profit”, which is defined as “The profit earned by the developer of a real estate project.” Developer’s profit is also sometimes referred to (by appraisers and real estate analysts) as entrepreneurial profit, and the two terms can represent the same concept, though certain market participants may apply the terms differently.
Entrepreneurial profit is defined as: “A market-derived figure that represents the amount an entrepreneur receives for his or her contribution to a project and risk; the difference between the total cost of a property (cost of development) and its market value (property value after completion), which represents the entrepreneur’s compensation for the risk and expertise associated with development.” Entrepreneurial incentive is defined as: “The amount an entrepreneur expects to receive for his or her contribution to a project. Entrepreneurial incentive may be distinguished from entrepreneurial profit (often called developer’s profit) in that it is the expectation of future profit as opposed to the profit actually earned on a development or improvement.”
It should be noted that, over a large enough sample, entrepreneurial profit and entrepreneurial incentive should be roughly equivalent. However, as illustrated by the definitions, entrepreneurial profit is a historical fact (based on the actual profit achieved), whereas entrepreneurial incentive is based on profit that is anticipated.
Entrepreneurial profit (or developer’s profit) and developer’s fees are separate and distinct from certain other soft costs, such as “contractor’s overhead” and “contractor’s profit.” Contractor’s overhead is defined as “The general and administrative costs, over and above the direct costs of material and labor, that are estimated by a contractor on any construction work.” Contractor’s profit is defined as “The amount by which the fee received by a contractor for work performed exceeds the total direct costs of material, labor, and overhead. [8]
Developer’s profit can include construction management and project management, as well, though construction management and project management are not defined terms within The Dictionary of Real Estate Appraisal. [9] However, both are required to construct a building and are roles that are often filled by the developer or the general contractor. Pricing for these services can vary and depend, in part, on whether the party providing the service is profiting in other ways from the development (e.g. a developer who is also the owner or landlord). If a developer is overseeing a project but is not contributing equity, then a developer will typically charge a fee for their time and expertise. If a developer is contributing equity or going at risk for other project components, they may price certain fees differently as they will likely evaluate their overall return on a project relative to the risk (and required time, expertise, and capital outlay). Furthermore, as noted, some developers may provide services on a fixed fee basis, while others will provide services as a percentage of costs or as part of their overall project role (e.g. a developer with significant risk and equity in a project may expect to provide a variety of services over the development and construction lifecycle). Thus, in some instances, developer’s pricing and compensation may also implicitly or explicitly reflect brokerage fees [10], site selection [11] services, or other items.
The detailed discussion of various risks and responsibilities involved in the development process is presented in order to illustrate the complexity of allocating risk and responsibilities between parties in a build-to-suit transaction (and ensuring that the transaction structure appropriately accounts for these factors).
If you are evaluating a potential build-to-suit project and require third-party expertise to assist with ensuring that the transaction structure is fair and reasonable to each party participating in the development, please contact VMG Health for assistance.
The next portion (Part 2) of this series will focus on credit ratings and their impact on build-to-suit projects.
Footnotes:
[1] In the December 2, 2020 Final Rule, CMS provided updated and detailed guidance on commercial reasonableness (“CR”). CR is a complex topic, and a detailed CR discussion is beyond the scope of this article. For questions regarding commercial reasonableness in the context of a new real estate development, please contact VMG Health.
[2] “All-in” costs may be defined differently by different developers for different projects in different markets. Developers take different approaches to pricing projects in a competitive bid situation, with some shifting more profit to a projected residual, while others may seek a higher developer fee or higher rent rate. Generally, however, “all-in” costs encompass all of a developer’s hard and soft costs, including land acquisition, building design and construction, site work, project financing, and so forth.
[3] A “capitalization rate” is defined by The Dictionary of Real Estate Appraisal as “a ratio of one year’s net operating income provided by an asset to the value of the asset; used to convert income into value in the application of the income capitalization approach.” Within the single-tenant, net-leased sector, there are slight variances in the methodologies by which investors calculate a capitalization rate. A detailed discussion pertaining to these variances is beyond the scope of this article.
[4] A hold period, or “holding period”, is defined as “the term of ownership of an investment”. Source: The Dictionary of Real Estate Appraisal, 6th Edition (Chicago: Appraisal Institute, 2015).
[5] Direct costs are defined by The Dictionary of Real Estate Appraisal as “Expenditures for the labor and materials used in the construction of improvements; also called hard costs.”
[6] Indirect costs are defined in The Dictionary of Real Estate Appraisal as “Expenditures or allowances for items other than labor and materials that are necessary for construction, but are not typically part of the construction contract. Indirect costs may include administrative costs, professional fees, financing costs and the interest paid on construction loans, taxes, the builder’s or developer’s all-risk insurance during construction, and marketing, sales, and lease-up costs incurred to achieve occupancy or sale. Also called soft costs.”
[7]The Dictionary of Real Estate Appraisal, 6th Edition (Chicago: Appraisal Institute, 2015).
[9] An example of a definition of “construction management fee” sourced from lawinsider.com is noted as the “fee or other remuneration for acting as general contractor and/or construction manager to construct improvements, supervise and coordinate projects or to provide major repairs or rehabilitation on a property.”
[10] When acquiring vacant land for development or buying, selling, or leasing a building, fees are often paid to a third-party broker based upon a percentage of sales or lease price. Brokerage fees (i.e. broker’s “commission”) are defined by The Dictionary of Real Estate Appraisal as follows: “an agent’s compensation for performing his or her duties; in real estate, a percentage of the selling price of property or a percentage of rentals that is received by the agent.”
[11] Some developers perform site selection services in conjunction with other development services. Brokers will also assist in site selection as part of their brokerage services in assisting a client in buying a property. Furthermore, consultants who specialize in site selection and appraisers with expertise in site selection are sometimes separately engaged in evaluating a potential new location, though their services can sometimes include a more comprehensive feasibility analysis. In some cases, the company providing site selection services will also be involved in conducting feasibility studies and/or limited negotiation with the seller of the land.
Survey Says: The Time to Evaluate Your Market-Based Physician Compensation Plan Designs Is Now
June 16, 2021
Written by Anthony Domanico and Ben Minnis
With the COVID-19 pandemic impacting compensation and productivity levels in 2020, significant changes to wRVU values in the 2021 Medicare physician fee schedule, and the continued industry move from volume to value-based reimbursement and compensation models, VMG Health previously recommended a cautioned approach to compensation surveys in 2021, 2022 and potentially beyond. While it is still early in the 2021 survey season, recently published surveys serve as a strong case study as to why caution is the best approach.
Take the example of family medicine in the 2021 Medical Group Management Association (“MGMA”) survey. VMG expected to see a sizeable decrease in the level of reported work relative value units (wRVUs), which went down by 11.1% at the median from 2020 to 2021. What we did not expect was a nearly 4% increase in median compensation for the specialty, resulting in a 15.5% increase in the reported ratio of compensation per wRVU.
In fact, in reviewing some of the most commonly employed specialists in the market, compensation per wRVU ratios increased between 10 and 12% for primary care, medical, and surgical subspecialties. The only specialty group with a typical 2-3% level of increase are hospital-based specialties, which were less susceptible to changes in volume during the pandemic.
A Closer Look at Family Medicine
The MGMA median compensation for Family Medicine in 2020 was $254,665, with median wRVUs of 4,936 and a median compensation per wRVU rate of $51.70. The 2021 median compensation is about $265,000, a nearly 4% increase from 2020.
If it is assumed that wRVUs performed in calendar year 2021 will return to 2019 levels (ignoring, for now, the change in wRVU values in the latest Medicare fee schedule), at a median rate of compensation per wRVU of $59.69 in the latest survey, the calculated compensation for someone producing at the 2019 median wRVU level would be $294,630 (4,936 x $59.69), a 15.7% increase from 2019 median compensation.
Table 1 – Return to Normal Scenario (Family Medicine)
A similar impact would be found for most of the most commonly employed physician specialties, leading to a potentially significant increased spend in physician compensation for organizations with compensation levels tied to wRVU productivity using conversion factors per the latest industry surveys.
Double Whammy: The 2021 CMS Physician Fee Schedule
It would be one thing if the COVID-19 impact was the only issue impacting physician compensation in 2021, however the increased wRVU values in the 2021 Medicare physician fee schedule complicates the issue even further. Based on our analysis of the new fee schedule, VMG expects wRVUs to increase by about 20% for family medicine physicians, from a median of about 5,000 wRVUs per FTE to nearly 6,000 wRVUs per FTE.
If an organization took the approach of using the latest Medicare fee schedule and the median conversion factor from the latest surveys without adjusting for the impact of the fee schedule, that organization would compensate a median-producing physician over $353,000 (5,923 wRVUs x $59.69), $100,000 more than the median compensation in 2020. Even a 20% reduction to the conversion factor would result in compensation of nearly $283,000 (5,923 x $47.75, which is $59.69 x 80%), an 11% increase from the 2020 median compensation level. Reductions would be less and resulting compensation higher for specialties with a smaller Medicare fee schedule impact.
Table 2 – Return to Normal + CMS Changes (Family Medicine)
Potential 2022 Market Data Solutions
While there are many ways organizations can modify their compensation plans in 2022, two potential solutions could help organizations bridge the gap until surveys stabilize over the next few years.
Option 1: A Hybrid Approach
Under the hybrid approach, organizations could use reported compensation levels in the 2021 surveys (e.g., a 4% increase to $265,000 for family medicine) and the 2020 survey median wRVU levels (4,936 for family medicine) to calculate a presumed median ratio of compensation per wRVU of $53.63 to be used for organizations choosing to remain on the 2020 fee schedule in 2022.
For organizations looking to switch to the 2021 fee schedule, an adjusted survey median level of wRVUs (5,923 for family medicine presuming a 20% fee schedule increase) could be used to calculate an adjusted ratio of $44.69 per wRVU.
Under this approach, regardless of the fee schedule utilized by an organization, a physician producing at a median level of wRVUs would earn the median compensation of $265,000, and physicians would be compensated appropriately relative to their level of work effort.
Option 2: Use 2020 Surveys, with Possible Adjustments for the Fee Schedule Changes
Another option available to organizations is to simply use the 2020 surveys (based on 2019 data), with some aging factors to account for changes in compensation and productivity levels to bring the data to the current year. This approach also assumes some return to normalcy post-pandemic and assumes that compensation changes in the 2021 surveys are also unreliable (e.g., some organizations provided hazard pay or additional compensation that would not typically be earned due to the pandemic).
Other Surveys
Upon a preliminary view of the American Medical Group Association (AMGA) 2021 Provider Compensation Survey, VMG discovered very similar trends to those seen in the MGMA survey. Specifically, wRVUs for many large specialties declined significantly in 2020, causing the reported compensation rate per wRVU values to sharply increase. VMG will continue to monitor the release of other provider compensation surveys as they are published.
Summary
Until surveys more accurately reflect the sustained impacts of the COVID-19 pandemic and the 2021 CMS physician fee schedule, organizations may want to consider an alternative market strategy for provider compensation in 2021 and 2022. While there are many ways to maintain a competitive, financially sustainable, and compliant compensation program going forward, organizations will want to fully understand the impact to providers before incorporating the latest surveys.
VMG Health can help organizations develop a market data strategy as organizations consider compensation plan changes for 2022 and 2023.
Location, Location, Location: Premium Sites and Healthcare Real Estate
June 15, 2021
By: Kristin M. Herrmann, MAI and Victor H. McConnell, MAI, ASA, CRE
The late Lord Harold Samuel, founder of the UK property company Land Securities, has been credited with coining the expression: “There are three things you need in property, these are: location, location, and location.” [1]
While what makes for a “good” location varies widely depending on the use, certain sites command premium pricing. Inpatient or outpatient healthcare uses located in high density, urban settings often must grapple with high underlying land values, which can affect the financial feasibility[2]of a particular use. Furthermore, in high density urban locations where the supply of potential development sites is low, healthcare users may have to compete with other buyers who intend to use a property for office, multi-family, or mixed use. Many urban locations may also feature ground leases (or be offered to the market on a ground lease basis); ground leases within urban markets are common, and the valuation considerations associated with ground leases can be complex[3], whether the site is located on a hospital campus or not.
Ultimately, when evaluating land transactions and underlying site value, it is important to consider factors such as: a) entitlements; b) assemblage/synergy; c) size/highest and best use; d) bulk zoning regulations (including floor area ratio and building height); and e) other factors related to urban settings.
This article will provide an overview of some of these considerations. For specific questions concerning healthcare real estate and premium site value considerations, please contact VMG Health’s real estate division.
Entitlements
Entitlement – “In the context of ownership, use, or development of real estate, governmental approval for annexation, zoning, utility extensions, number of lots, total floor area, construction permits, and occupancy or use permits.”[4]
In certain parts of the country, separate markets exist for entitled properties; this is primarily driven by the risk and time associated with the entitlement process. In these markets, some buyers will acquire a property, secure entitlements, then sell the property to another buyer who will proceed to develop the property. The arbitrage between these two transactions may represent the value associated with the entitlements (though other factors, such as a change in market conditions or navigating other development risks during that period, can also impact the pricing differential). The magnitude of the premium can vary widely from municipality to municipality, even within the same metro area. For instance, some municipalities are more challenging to get zoning variances in than others. If the approval timeline is twice as long in one location, then, generally, the value of a fully entitled property will be higher (assuming that the entitlements obtained are consistent with the property’s highest and best use). Legal issues (i.e., neighborhood residents suing to prevent a proposed development, or site-specific environmental challenges) can also create significant additional development risk or timing delays.
During the course of a variety of healthcare real estate valuation and consulting assignments, VMG Health has evaluated the impact of entitlements on land transactions in high cost, core urban markets across the United States.
“The combining of two or more parcels, usually but not necessarily contiguous, into one ownership or use; the process that may create plottage value.
The combining of separate properties into units, sets, or groups, i.e., integration or combination under unified ownership.”
Synergy – “The total effect of combining enterprises, which is greater than the sum of the independent actions combined to create the effect; in real estate, usually applied to multiuse properties in which the value of the total development is greater than the sum of the individual parts.”[6]
According to The Appraisal of Real Estate, 15th Edition, “Sometimes highest and best use results from assembling two or more parcels of land under one ownership. If the combined parcels have a greater unit value than they did separately, plottage value is created. Plottage is an increment of value that results when two or more sites are combined to produce a larger site with greater utility and probably a different highest and best use…Plottage value may also apply to an existing site of a special size or shape that has greater utility than more conventional, smaller lots. Neighboring land uses and values are analyzed to determine whether an appraised property has plottage value.”
Value premiums associated with assemblages are highly variable. In the article “Estimating assemblage value to help buyers and sellers” dated August 15, 2013, John Galvin from Andrews & Galvin Appraisal Services, LLC discusses the economic theories of supply and demand as it relates to an assemblage. “The buyer wants a specific finite product creating demand. The seller holds the only commodity that will work for the buyer creating the supply. In an active market with steady demand and supply, the two reconcile an exchange of the product in the form of a price, hence creating the current market value of that product. However, if the seller is not willing to sell, the point of equilibrium of the exchange has to shift in order to reach a point where both parties can make a satisfying exchange. For an abutting/assembling property owner, this often means a premium has to be paid to entice the seller to make the exchange…When the buyer is highly motivated to generate a return by the assemblage, yet the seller is not motivated to sell, a premium is almost always involved in the conveyance. For motivated sales, the appraiser is taxed to extract that premium in order to equate the market price paid to make a comparison… A buyer is willing to pay a premium until the point where assembly is no longer feasible.
Sometimes the “assemblage value” is not enough to entice a seller to depart with their property or property rights. One notorious example of this was the “Chicken-man” case in Downtown Hartford. In 1969, Travelers Insurance Co. offered the owner of the Connecticut Live Poultry Market on Grove Street and Columbus Boulevard a sum of $110,000 for his small retail facility. This was considered a very high price for the time period, reflecting the premium the buyer was willing to pay above the fee simple market value of the property. The owner, Dominic LaTorre, who became nationally known as the “Chicken-man,” refused to sell out on the grounds that he was essentially “standing up for the little guy.” Travelers Insurance Company ended up redesigning their class A office building around the small retail store (Hartford Courant, July 7, 1993).”[7]
Some assemblage transactions can effectively represent bilateral monopolies, whereby the only site that facilitates a particular development is held by one specific seller – yet the only realistic buyer may be an entity who has already assembled all of the adjoining parcels and is seeking to acquire the one remaining parcel. In these situations, the relative leverage of either party (along with whether it is possible to develop the assemblage absent the one parcel, as noted in the example above) can result in a wide range as compared to what would be expected in a typical transaction without any assemblage considerations.
In the article, “The Added Value of Assembling Parcels” in Right of Way magazine, the author states that “In general, applying the assemblage theory may be appropriate when the following conditions exist in the before condition:
The costs required to assemble the land are financially feasible.
The assemblage of parcels can be accomplished in the reasonably near future.
The owners of the subject properties are willing to participate in the assemblage.
It is physically possible, legally permissible, and financially feasible to achieve the highest and best use case scenario through the assemblage theory.
The highest and best use case scenario resulting from assemblage will result in the highest value for the subject parcel.
In the San Francisco Bay Area, a recent case employed the assemblage theory. It involved the condemnation of a half-acre vacant parcel needed to expand an adjoining one-acre city-owned vacant parcel for future development as a city park. The half-acre parcel was substantially impacted by two earthquake fault-lines that traversed through it, thus limiting the potential area for future structures to approximately 900 square feet. The city’s one-acre parcel was generally not impacted by fault-lines and did not face nearly the same developmental limitations as did the half-acre parcel. Absent the park project that resulted in the condemnation, the city would not have needed the land for public use. It would therefore have been faced with not having to condemn the half-acre parcel and surplusing its one-acre adjoining parcel. It was determined by the property owner’s legal team that the joinder of the half-acre with the one-acre parcel would have resulted in the highest and best use scenario for both parcels. The combined 1.5-acre site created through assemblage would have allowed for a greater range of developable land uses, such as a fast-food restaurant or service station. These uses would not otherwise have been feasible if the parcels were developed independently. The assemblage would have further allowed the half-acre parcel to be utilized for the required parking and much of the required landscaping, thus greatly increasing its potential land value. This case ultimately settled prior to going to trial.
Therefore the assemblage of parcels and the resulting increased acreage can create certain opportunities. For example, commercial parcels containing less than a half-acre are often restricted to uses requiring limited building floor area and parking, such as retail or office. However, if assembled with adjacent land, the combined acreage may reach an area threshold that allows for additional uses, such as a fast-food restaurant or service station. Substantial additional acreage may have the potential to accommodate even more intensive uses, such as a hotel, mixed-use project or high-rise development. An increase in acreage may also justify the construction of a parking structure. From a highest and best use standpoint, parking structures allow much greater building floor area to be constructed, thus further increasing the number of potential highest and best use candidates. Whether or not to construct a parking structure of course involves many factors of which adequate acreage is an essential one.
An increase in land area through assemblage, along with the removal of the previously shared property lines, can help to lessen the impacts of certain local development standards. This in turn results in the potential for greater developmental intensity and land value. When parcels are combined, the shared property lines that separate them disappear, as do the setback requirements on both sides of those property lines. The proportionate impact caused by the setbacks on development also diminishes accordingly. For example, two five-foot side yard setbacks on a 100-foot wide parcel (ten percent of the total setback area) are far less impacting than the same setbacks on a thirty-foot wide parcel (33 percent of the total setback area) because they allow for a greater percentage of the site to be developed.”[8]
Per the working paper “Estimating the Holdout Problem in Land Assembly,” from the Federal Reserve Bank of Atlanta dated December 2013 and written by Chris Cunningham, the author notes: “I find that properties sold before an assemblage command a statistically significant and economical large premium of 13 dollars per square foot, a seventeen percent premium relative to non-assembled land sold in the same census tract. This finding is robust to inclusion a rich set of control variables for time and space. Consistent with the game theoretic literature, the premium decreases with an individual parcel’s share of the total assemblage. Finally, parcels at the center of ultimate assembly may command higher premiums than do parcels at the edge, suggesting that developers retain, or at least are able to convince would-be holdouts that they can build around a holdout.”[9]
In some cases, an assemblage may facilitate a change in highest and best use or may allow for a zoning change. In these situations, due to the change in economics associated with the proposed development, the value of the underlying site may also change.
VMG Health has interviewed individual developers, brokers, and investors in various urban markets concerning this issue. A common theme among these interviews is the variance regarding the extent to which assemblage affects a transaction – individual examples exist of assemblage sales which seemingly occurred at no premium, and others which occurred at a price well over what the property would have otherwise sold for, if there were no assemblage. Accordingly, the appraiser or analyst must carefully evaluate individual transactions to determine whether pricing was impacted.
Highest and Best Use
Highest and best use may be defined as, “the reasonably probable use of property that results in the highest value.”[10] Highest and best use must meet the following four criteria: 1) Physically possible; 2) Legally permissible; 3) Financially feasible; and 4) Maximally productive. The appraiser’s (or analyst’s) determination of a property’s highest and best use as if vacant is key to deriving an opinion of land value.
Physical possibility is defined as follows: “[f]or a land use to be considered physically possible, the parcel of land must be able to accommodate the construction of any building that would be a candidate for the ideal improvement.[11]
Legal permissibility is defined as “a property use that is either currently allowed or most probably allowable under zoning codes, building codes, environmental regulations, and other applicable laws and regulations that govern land use.” [12]
Financial feasibility is defined as “[t]he capability of a physically possible and legal use of property to produce a positive return to the land after considering risk and all costs to create and maintain the use.”[13]
Maximally productive use is defined as “the physically possible, legally permissible, and financially feasible use that results in the highest present value.” [14]
According to the Appraisal Institute’s Advanced Land Valuation: Sound Solutions to Perplexing Problems, “if two or more uses are financially feasible, then the use that generates the highest residual land value is the use that is maximally productive and represents the highest and best use of the land.” The land residual technique, “a method of estimating land value in which the net operating income attributable to the land is capitalized to produce an indication of the land’s contribution to the total property” [15]is sometimes utilized to determine the maximally productive use (and as such, the highest and best use) for a proposed property.
Site size can affect pricing and development potential. Smaller sites may sell for higher per unit prices in some instances, though a larger site may command a higher per unit price in others, particularly if the larger site can accommodate a different array of uses. In high-density markets, slightly larger sites are sometimes considered more developable, and thus can be more attractive to a developer. In some cases, a change in site size may change the highest and best use (as discussed above), which can affect the value per square foot or per FAR. In other cases, larger sites which command a higher total purchase price may suffer from smaller buyer pools (which generally would drive down the price per square foot due to less competition).
Ultimately, highest and best use analysis is a complex topic, and the level of diligence required to appropriately assess highest and best use is project specific and site specific.
Bulk Regulations (including Floor Area Ratio and Building Height)
Bulk regulations are defined as “Zoning laws or other regulations that control the height, mass, density, and location of buildings, setting a maximum limit on the intensity of development to ensure proper light, air, and open space.” [16] Bulk regulations include limitations (both maximum and minimum) on floor area ratio, setbacks, lot coverage, building height, and required open space, among others.
Most pertinent to the discussion of high dollar land are 1) the allowable floor area ratio (or “FAR”) and 2) the maximum building height. FAR is defined as “The relationship between the above-ground floor area of a building, as described by the zoning or building code, and the area of the plot on which it stands; in planning and zoning, often expressed as a decimal, e.g., a ratio of 2.0 indicates that the permissible floor area of a building is twice the total land area.”[17] Floor area ratio may also be referred to as building-to-land ratio. In certain municipalities, the ratio of building area which can be constructed on a site, which can also be somewhat dictated by the maximum allowable building height, can be a better indicator of the value of the land than on a purely price per square foot of land area basis, since a higher allowable floor area ratio (as well as a higher allowable building height) would allow for the construction of a larger/taller building, all else equal.
The price per FAR foot can also be dependent on the allowable use for the site in question. It may not be financially feasible to develop a site to its maximum FAR, for instance – or the cash flows associated with one property use may differ from another (driving differential in price per FAR). VMG has investigated urban markets where a significant premium existed for multi-family versus office use, due to higher demand and superior projected cash flows for multi-family development (even if the allowable FAR was the same for multi-family versus office).
Bulk regulations and FAR should be evaluated carefully with regard to the subject site as well as any comparative transactions to understand the degree to which differing zoning regulations drove corresponding differences in per square foot or per FAR foot land pricing.
Factors Related to Urban Settings
In urban settings, other considerations which can affect property value (and certain associated premiums) may also include a site’s proximity to public transportation (i.e., transit-oriented development or “TOD” locations) or ingress/egress, such as is associated with corner locations.
In many large cities, commuter rapid transit options attract pedestrian traffic to railway stations. This tends to benefit properties which are in close proximity (typically within half a mile or so) to these stations, and there is often a premium for TOD locations. The extent to which this premium exists varies market to market and site to site – and, furthermore, concerns emanating from the COVID-19 pandemic (related to mass transit, as well as congregate, in-person work environments) may have affected this premium since early-2020.
Corner locations, signalized intersections, and other ingress/egress issues can also affect the pricing of urban land parcels. Visibility, exposure, and signage can all contribute to making a corner site more desirable. However, while some corner sites may sell for more than similarly located non-corner sites, in other cases, setback requirements may limit the development potential of a particular site which could offset any corner premium.
Conclusion
While healthcare providers located in lower cost markets or in suburban settings may not have to grapple with urban land valuation considerations, many hospitals, physician groups, and other healthcare users face the issue due to the densely populated, urban markets in which they are located. Some older hospitals are situated in premium locations in core urban markets – these campuses must evaluate underlying land pricing if they plan to sell or lease any portion of their hospital campus. Furthermore, when considering the acquisition or leasing of other sites in an urban market, healthcare providers and investors should be aware of some of the key factors that drive pricing in an urban setting. As previously discussed, certain valuation considerations for high dollar land include but are not limited to: a) entitlements; b) assemblage/synergy; c) size/highest and best use; d) bulk zoning regulations (including floor area ratio and building height); and e) other factors related to urban settings. Due to the complexities associated with urban land valuation, an appraiser may use techniques including, but not limited to, the land residual method, the sales comparison approach, the market extraction method, or the allocation method. The appraiser or analyst may also need to have expertise in ground lease capitalization rates, yield capitalization, residual value, and so forth. For further discussion of ground leases, please refer to VMG’s ground lease article cited below.
If you are an investor, developer, or healthcare provider evaluating land pricing (or ground lease rates) in a high cost urban market and require outside expertise, please contact VMG Health’s real estate division.
[2] For more on the topic of financial feasibility within the medical office building (“MOB”) sector, refer to the following: https://vmghealth.com/blog/financial-feasibility-speculative-medical-office-building-construction/
[3] For more guidance specific to ground lease considerations on hospital campuses, please refer to the following: https://vmghealth.com/library/under-all-is-the-land-ground-leases-and-hospital-campuses/
[4]The Dictionary of Real Estate Appraisal, 6th Edition (Chicago: Appraisal Institute, 2015).
[5]The Dictionary of Real Estate Appraisal, 6th Edition (Chicago: Appraisal Institute, 2015).
Post-COVID Hospital Guidance: Comparing Full-Year Guidance from Public Hospital Operators before the COVID-19 Pandemic and One-Year Later
June 9, 2021
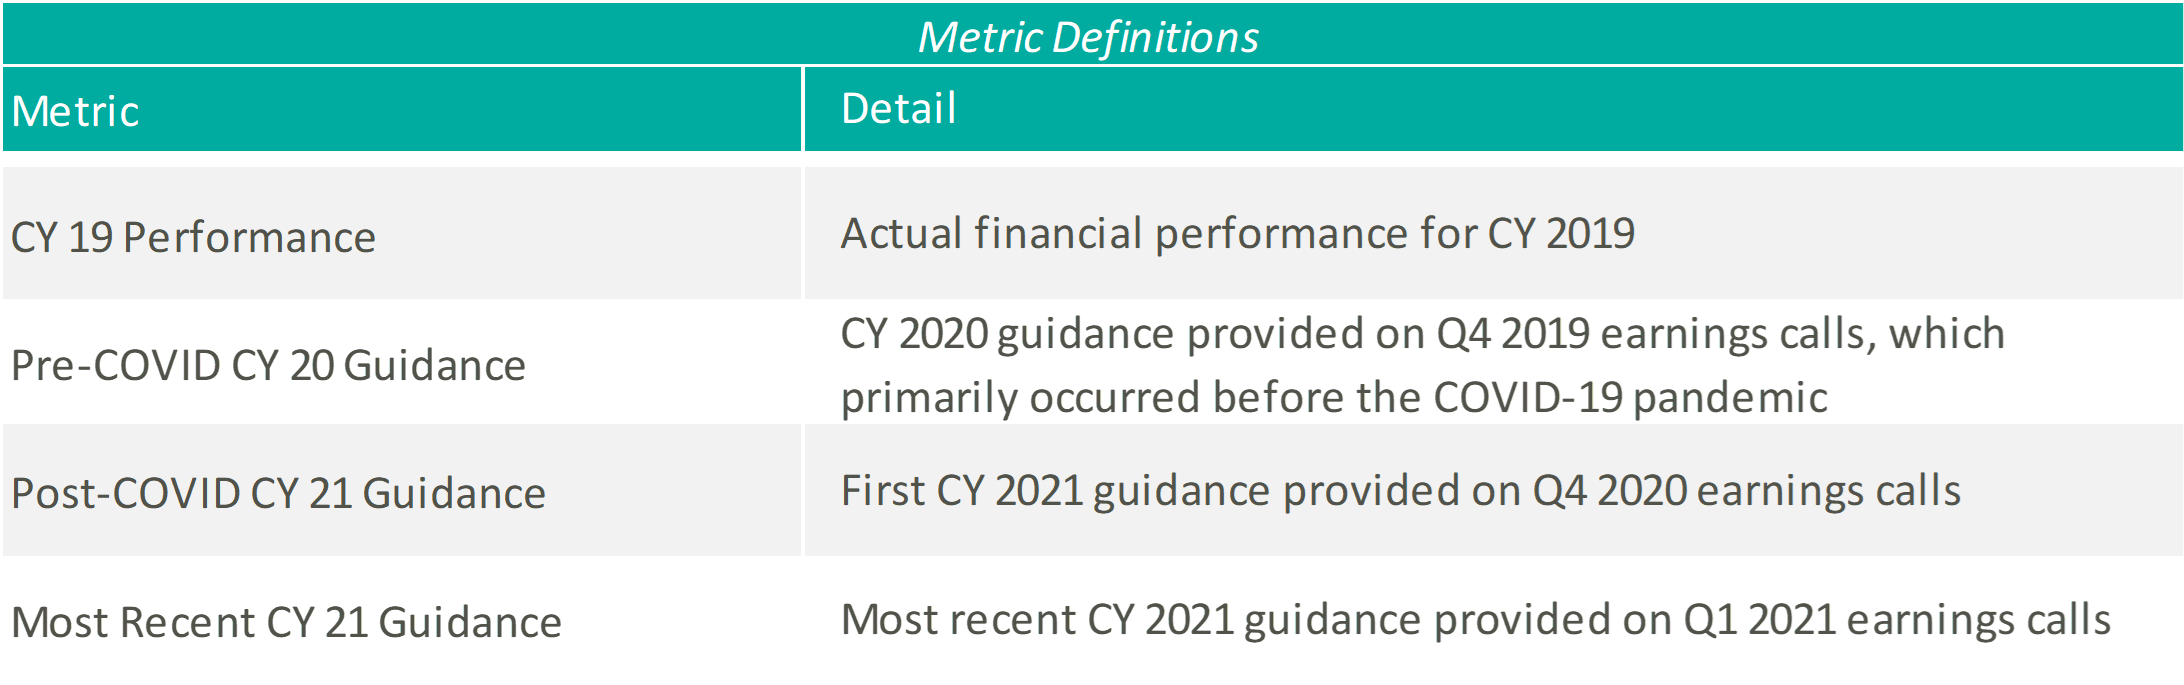
Last March, the United States declared a national emergency related to the coronavirus (“COVID-19”) pandemic. At the time and throughout the beginning of the pandemic, meaningful economic factors were unknown including the evolution of the disease, the extent of its economic impact, and the results of steps taken and yet to be taken by the federal government, financial institutions, and market participants. As a result, many healthcare operators suspended the disclosure of earnings guidance. Now, after a year of experience with the COVID-19 pandemic, operators have resumed sharing their expectations of future financial performance. VMG Health analyzed select guidance figures from the four main public hospital operators to better understand the industry’s perspective on operations in a post-COVID world.
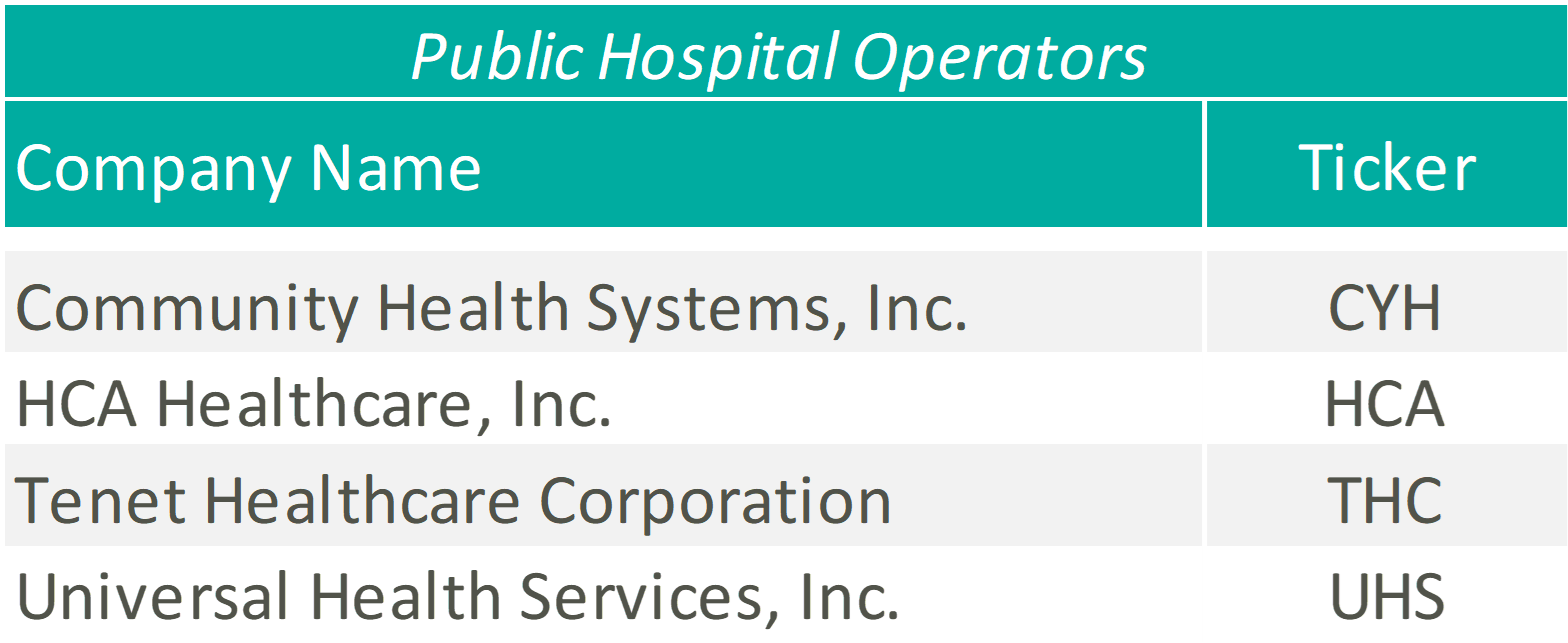
Please see below for a list of the public hospital operators examined, as well as further detail regarding the various metrics considered.
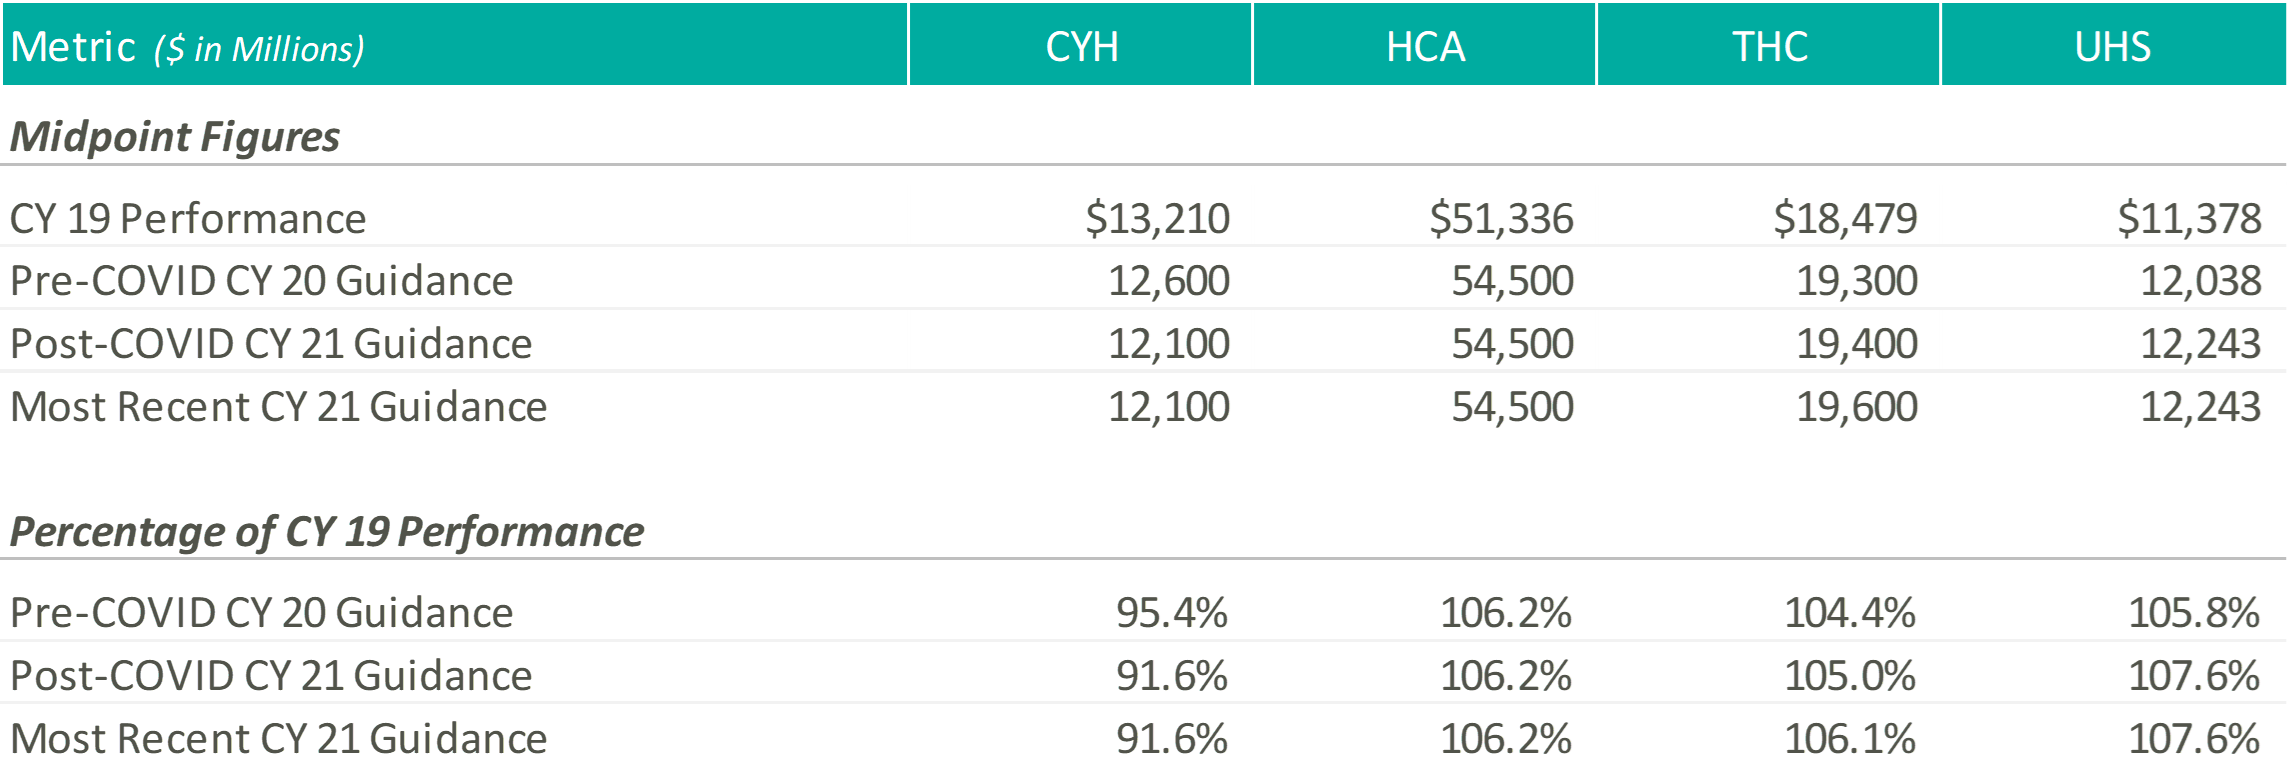
Revenue
Except for CYH, initially and most recently, the hospital operators expect CY 2021 revenue levels at or above those estimated at the beginning of CY 2020, and well above their CY 2019 performance. Please note, CYH completed a planned divestiture program towards the end of 2020, making it difficult to compare CY 2019 performance to the forward guidance figures.
At the end of 2020, when the hospital operators were once again comfortable providing guidance figures, the management teams anticipated continued COVID volumes during the first half of the year, with a return to more normal levels by the second half of the year. HCA noted that they expected 2021 volumes to grow above 2020 levels but trend slightly below 2019 levels, while THC believed their 2021 volumes would improve on 2019.
A few months later, during the Q1 2021 earnings calls, the operators noted strong first quarter results and tailwinds from the extension of sequestration through the end of the year. As a result, HCA tightened their CY 2021 revenue guidance and THC increased their CY 2021 revenue guidance. Although UHS kept their CY 2021 guidance figures flat, they noted that they “remained comfortable” in their ability to achieve the projected revenue levels and viewed sequestration as a “cushion” not currently factored into their guidance figures.
Adjusted EBITDA
Except for UHS, initially and most recently, the hospital operators expect CY 2021 adjusted EBITDA levels near or above those estimated at the beginning of CY 2020 and their CY 2019 performance.
As mentioned previously, the operators pointed towards a strong first quarter performance as rationale for tightening or raising their CY 2021 EBITDA guidance ranges. Additionally, HCA, CHS, and THC discussed the continued focus on cost saving initiatives throughout 2021 to combat expense pressures related to the COVID-19 pandemic.
During the Q4 2020 and Q1 2021 earnings calls, UHS management cited similar expense pressures, primarily related to labor, associated with the COVID-19 pandemic. Generally, the UHS team expects the labor pressures to ease as the volume of COVID patients declines, but at a slower pace.
CONCLUSION
Although uncertainty remains, with a full year of COVID-19 operations under their belts, hospital operators have become more comfortable discussing go-forward performance. As Daniel Cancelmi, CFO and Executive VP at THC said during the Q4 2020 earnings call, “Although there are various uncertainties as to how the pandemic will impact us this year, we believe we have sufficient visibility and confidence as to how our business will perform during the ebbs and flows of the pandemic to enable us to provide investors an outlook of our projected results this year.” Additionally, Kevin Hammons, Executive VP and CFO at CYH, noted that although uncertainty remains, there are multiple ways to achieve the guidance figures. After a hard year for the healthcare industry, it is encouraging to see the hospital operators look forward again and provide a generally positive outlook related to the recovery from the COVID-19 pandemic.
Are You Under (or Over) Insured? Analyzing Replacement Cost for Hospital Systems, Investors & other Healthcare Providers
June 4, 2021
Evaluating the replacement cost of the facilities and equipment for your hospital system should involve a formalized, detailed process, whether occurring at regular intervals or on an as-needed basis due to specific events (property damage due to natural or man-made causes, acquisitions, new construction or renovation).
There are risks to being over insured or under insured. The primary risk of being over insured relates to increased operating costs which occur through higher premiums, higher deductibles, or both. If property insurance is being passed through to tenants in a triple-net lease structure, it could also create leasing challenges due to higher operating expenses. Or, if the leases are on a “gross” basis, the higher operating expenses can diminish the building’s profitability.
Being under insured can create significant financial exposure. For instance, a casualty event could result in large, unexpected out-of-pocket costs which could limit the ability of a hospital system to pursue other strategic initiatives. For a hospital system operating on thinner margins, this occurrence could be financially catastrophic.
The specialty nature of most healthcare properties and the associated construction costs require specific expertise and data. Some insurers, consultants, or valuation professionals may not be aware of the incremental buildout costs associated with higher cost building components such as imaging, operating rooms, radiation treatment vaults, and so forth. Furthermore, some property types and specialty features have seen cost increases which are higher than the overall average for general commercial buildings or office buildings. The replacement cost for surgical centers, cancer centers, imaging centers, acute-care hospitals, critical-access hospitals, and commercial laboratories must be tested against the proper market cost data by professionals with the appropriate specialized experience to ensure that risks are properly mitigated. A similar approach involving current market cost benchmarking should be used to evaluate the replacement cost of tangible personal property and other expensive and sophisticated equipment within these facilities (robotic surgical/navigational systems, MRI, CT Scan, radiation therapy systems, and laboratory testing/analyzer equipment).
The beginning of any meaningful replacement cost analysis should start in determining the appropriate replacement cost definition and parameters which are most applicable to a hospital’s insurance policy. There are several definitions available for replacement cost and total insurable value (TIV) within the marketplace, and the specific insurance policy definition may have variances that should be considered. Definitions of total insurable value may or may not include all components of owned property, and a particular policy may protect an amount less than the replacement cost or total insurable value for the purpose of lower premiums or deductibles. A few pertinent definitions from industry sources include the following:
The Dictionary of Real Estate Appraisal, 6th Edition defines replacement cost as “The estimated cost to construct, at current prices as of a specific date, a substitute for a building or other improvements, using modern materials and current standards, design, and layout.”
The American Society of Appraisers define replacement cost new as “The current cost of a similar new property having the nearest equivalent utility to the property being appraised, as of a specific date.”
The International Risk Management Institute, Inc. defines total insurable value (TIV) as “A property insurance term referring to the sum of the full value of the insured’s covered property, business income values, and any other covered property interests.”
Marshall Valuation Service (MVS) MVS defines replacement cost as “The total cost of construction required to replace the subject building with a substitute of like or equal utility using current standards of materials and design. These costs include labor, materials, supervision, contractors’ profit and overhead, architects’ plans and specifications, sales taxes and insurance.”
After evaluating the nuances within the definition applicable to a particular hospital’s policy, a professional can account for potential non-perishable items or other components not covered. This could include building foundations, site improvements, certain categories of profit, or other equipment-specific soft costs such as installation, calibration, and testing. The investigative process itself could expose omissions in the policy that need to be re-evaluated. Another consideration when evaluating the appropriate premise of value is that fair market value is likely not a reliable proxy for insurable replacement cost. Fair market value includes depreciation and obsolescence related to loss in value due to physical wear and tear, functional inefficiencies, and/or economic and other external factors. Similarly, book value, either gross book value or net book value disclosed in a hospital’s financial statements, should not be utilized for insurance purposes. Book value is generally based on capitalized cost, as of a specific acquisition date, and does not reflect changes in cost since installation.
In addition to our experience evaluating replacement cost for healthcare buildings, VMG Health has extensive experience providing medical equipment replacement cost analysis and physical inventory services for hospital systems and other healthcare entities. Some of VMG’s recent experience in this sector is summarized below.
Equipment: Recent and relevant work related to medical equipment replacement cost analysis includes the following:
25 acquisitions for a 13-hospital southeastern non-profit health system.
Fixed asset management for a 2-campus hospital in Florida.
Physical inventory/equipment valuation for a 2 million square-foot medical and research center in the Middle East.
Real Estate: Recent experience with real estate replacement cost analysis includes:
RCN For Health System Insurance Policy Analysis – Recently completed comprehensive replacement cost analysis for a non-profit health system related to owned properties. This involved property-by-property analysis of ~5 million square feet of real estate assets across a wide array of property types. VMG conducted a site visit sampling and provided a comparison of values versus previous insurable values. VMG also constructed an automated model that the health system could leverage on future updates (or changes to) its replacement cost analysis.
RCN to Assist With Investment Risk Analysis – VMG assisted an institutional real estate investor with analyzing replacement cost in more than a half-dozen different metropolitan areas as part of its underwriting process. The purpose of VMG’s analysis was to assist the investor in analyzing rental rates for new construction within each market relative to the in-place rental rates within an existing portfolio of medical office buildings and other outpatient assets.
RCN for Surgery Center Platform Company – VMG assisted a surgery center platform company with analyzing replacement cost in various markets to assess the likelihood of competing surgery centers opening up in the given market.
If you are evaluating whether you are under- or over-insured, or otherwise require a replacement cost analysis pertaining to real or personal property, please contact VMG Health. As the market leader in healthcare valuation and advisory, VMG is well-equipped to provide reliable guidance to health systems evaluating this issue.
Ambulatory Surgery Centers are in the Spotlight in the OIG Advisory Opinion No. 21-02
May 3, 2021
Written by Bartt B. Warner, CVA
Noteworthy for investors of ambulatory surgery centers (“ASCs”), the Office of Inspector General (“OIG”) released a favorable (low risk) Advisory Opinion (No. 21-02)1 on April 29th, 2021. The Advisory Opinion reviewed a proposed arrangement (“Arrangement”) in which a health system (“Health System”), manager (“Manager”) and five orthopedic surgeons and three neurosurgeons employed by the Health System (“Physician Investors”) would like to invest in a new ASC (“New ASC”). The offer or payment of investment returns from an ASC to an investor constitutes remuneration under the Federal anti-kickback statute. As a result, the Advisory Opinion analyzed if the Arrangement, if assumed, would constitute justification for the imposition of sanctions under the Federal anti-kickback statute.
According to the Advisory Opinion, “the Proposed Arrangement, if undertaken, would generate prohibited remuneration under the Federal anti-kickback statute if the requisite intent were present, the OIG would not impose administrative sanctions on Requestors in connection with the proposed Arrangement under sections 1128A(a)(7) or 1128(b)(7) of the Act, as those sections relate to the commission of acts described in the Federal anti-kickback statute.”
Background
Health System would own 46 percent of the New ASC.
Physician Investors would own 46 percent collectively, ranging from 4 percent to 8 percent per Physician Investor.
The Manager would own 8 percent and develop and manage ASCs throughout the country while providing various management services, consulting, and administrative services to the New ASC.
Physicians would not have any ownership interest in the Manager.
The New ASC would allow new investors to invest directly (i.e., no investor would invest through a pass-through entity). In addition, ownership interest in the New ASC would not be contingent on prior or expected volume or value of referrals made by the potential new investor(s).
Distributions and capital contributions would be made proportionately to an investor’s ownership interest the New ASC.
The New ASC would be in a newly constructed medical facility owned by a real estate joint venture (“Real Estate Company”) comprised of the Health System, the Physician Investors, and the Manager.
The New ASC would enter into various space, equipment leases and services arrangements with the Health System and the Real Estate Company.
Referral Risk
Under the Proposed Arrangement, both the Health System and its affiliated physicians, including Physician Investors, would be in a position to generate or influence referrals to various beneficiaries of Federal health care programs to the New ASC. In order to limit the ability of the aforementioned physicians to make or influence referrals, the Health System would disallow any action that required and/or encouraged any physician or medical staff members refer patients to the New ASC or to the Physician Investors. In addition, the Health System would refrain from tracking any referrals made to the new ASC by its affiliated physicians. Further, the compensation received by the affiliated physicians from the Health System would be consistent with Fair Market Value and would not be related in any way, to the volume or value of referrals that the Health System’s affiliated physicians make to the New ASC or its Physician Investors. Lastly, the Manager also attested that it would not make or influence referrals in any way to the Physician Investors or to the New ASC.
Physician Investor Procedures, Income and Program Parameters
According to the Advisory Opinion, the Health System certified the following:
Each year, a minimum of one-third of the procedures payable by Medicare and performed by a physician in an ASC (“ASC Qualified Procedure”) would be performed at the New ASC.
For the previous fiscal year or previous 12-month period, every orthopedic surgeon Physician Investor would receive at least one-third of his or her medical practice income from ASC-Qualified Procedures.
For the previous fiscal year or previous 12-month period, not every neurosurgeon Physician Investor would derive one-third of their medical practice income from ASC-Qualified Procedures.
Manager would oversee monitoring each Physician Investor’s compliance with the various procedure and medical practice income requirements.
The majority of the medical practice income for the neurosurgeon Physician Investors is derived from inpatient hospital procedures and would continue even after the investment in the New ASC. However, the neurosurgeon Physician Investors would regularly utilize the New ASC (e.g., to personally perform neuroplasty procedures).
For ASC-Qualified Procedures, the Physician Investors rarely would refer patients to each other.
The estimated number of ASC-Qualified Procedures performed in the New ASC and referred by Physician Investors would be less than 1 percent of the aggregate number of ASC-Qualified Procedures performed at the New ASC annually.
Any space or equipment leased by the new ASC from the Health System and/or the Real Estate Company would comply with the Federal anti-kickback statute safe harbors.
Any services performed by the Health System and/or Real Estate Company for the benefit of the New ASC would comply with the Federal anti-kickback statute safe harbors.
Patients referred to the New ASC by any investor will receive written notification of such investor’s ownership in the New ASC.
Safeguards to Mitigate Risk
The Advisory Opinion acknowledged several ways that the Arrangement mitigated risk and keys questions that should be asked in similar situations which are listed below:
Is the ASC management company directly or indirectly influencing referrals of items or services reimbursable by a Federal health care programs to the ASC?
Is there physician ownership in the ASC management company?
Is the health system influencing and/or tracking referrals from its affiliated physicians to the ASC?
Would the physicians that are investors in the ASC derive at least one-third of his or her medical practice income from all sources for the previous fiscal year or previous 12-month period from the performance of ASC-Qualified Procedures?
If the answer is no, would the physicians utilize the ASC on a regular basis as part of their medical practice and would the physicians rarely refer ASC-Qualified Procedures to other physician investors in the ASC?
Does the arrangement contain safeguards to mitigate the risk that the health system would make or influence referrals to the ASC?
Is the compensation for the health system’s affiliated physicians set at Fair Market Value and not related in any way to the volume or value of referrals?
Is the offer of ownership in the ASC based on prior or future referrals?
Are the profit distributions and capital contributions proportionate to an investor’s ownership in the ASC?
Do the space, equipment rental and services arrangements for the ASC comply with the Federal anti-kickback statute safe harbors?
Does the ASC and its physician investors provide written notice to patients referred by the ASC investors to the ASC of the referral source’s ownership interest in the ASC?
Are ASC patients receiving medical benefits/assistance under any Federal health care program treated in a nondiscriminatory manner?
Does the arrangement include safeguards that prevent ancillary services performed at the ASC to Federal health care program beneficiaries that are not related directly and integrally to primary procedures performed at the New ASC and billed separately to any Federal health care program?
Is any cost associated with the ASC (unless required by a Federal health care program) not included on any cost report or any claim for payment from a Federal health care program?
Conclusion
Although the Advisory Opinion is favorable, the OIG took the unique stance of relying heavily on the Health Systems’ certifications as previously discussed. In addition to the certifications, the OIG offered a multitude of factors that should be carefully considered for similar arrangements. The safeguards outlined in the opinion demonstrate regulatory guidance remains an important part of investing in health care. All interested parties should consider their referral relationships, as well as guidance provided by this opinion and applicable laws before finalizing a similar arrangement.
2 Major Themes from Public Healthcare Firms trailing COVID-19 – Part 2: Looking Forward
April 27, 2021
Contributors: Savanna Dinkel, Blake Madden and Chris Madden
Providers: Continued Shift to the Outpatient Setting
With the roll-out of the vaccine and the lifting of COVID-19 restrictions, providers are able to look further forward towards their operations in a post-pandemic world. During Q4 2020 earnings calls, the latest occurring on March 8, 2021 (RadNet), management teams began more comfortably addressing their go-forward expectations and future strategies. Providers across the board discussed how COVID has altered industry dynamics and accelerated certain pre-pandemic trends. Most notably, many providers, especially those in acute care, commented on the continued shift to outpatient facilities or other lower cost of care providers. A few companies noted that the COVID-19 pandemic has increased the need for behavioral health services. Finally, as cash flows return to normal, management teams addressed their increasing ability to pursue and appetite for acquisitions and de novo opportunities.
Acute Care
“We continue our emphasis on the development of service lines, thereby further increasing our acuity levels on the inpatient side. And our investments on the outpatient side are designed to expand entry points into our networks, providing more convenient out-of-hospital care environments and to satisfy the evolving consumer expectations about the availability and accessibility of health care services.
In 2020, we opened 3 new ambulatory surgery centers and 3 new freestanding emergency departments. More ASCs, freestanding EDs, urgent care centers, along with further expansion of our physician practice locations, are in the pipeline and under active development. With our stronger portfolio, we are on a path to successfully develop and grow both acute care services and our ambulatory networks moving forward.”
Tim L. Hingtgen, CEO & Director – Community Health Systems Q4 2020 Earnings Call Transcript
“We are investing in our outpatient facility development … we will continue to build on that because we believe that our patients deserve a convenient offering of facilities in our network. That doesn’t require, fortunately, as much capital as the inpatient components of our spending.”
Samuel N. Hazen, CEO & Director – HCA Healthcare, Inc. Q4 2020 Earnings Call Transcript
“We continue to be thoughtful about the capital investments and the service lines in the hospitals that we think have growth potential based upon the underlying demographics and opportunity to create better and more profitable service lines for the community in those markets. It has also, obviously, generated a set of opportunities for us at the intersection of our Ambulatory and Hospital business in terms of high-return capital deployment.”
“As we start 2021, we believe our return to volume growth in both segments involves return of orthopedic and lower extremity joint replacement cases, and mitigation of COVID-related isolations and quarantines. As discussed, many of our markets continue to have limited elective surgeries, particularly with elderly patients with complex medical conditions.”
Douglas Coltharp, Executive VP & CFO – Encompass Health Corporation Q4 2020 Earnings Call Transcript
“From 2010 to 2018, the supply of IRFs remained relatively stable, yet the 65-plus population grew 32%. There’s a supply and demand imbalance, and we’re one of the few companies with both the operational expertise and capital necessary to build and operate freestanding IRFs. We have eight new hospitals expected to open in 2021, and we expect to add 100 to 150 beds to existing hospitals. We’ll also continue development on the 10 new hospitals we expect to open in 2022.”
Mark Tarr, President, CEO & Director – Encompass Health Corporation Q4 2020 Earnings Call Transcript
Home Health and Hospice
“Home health was up [in spend] by 2% with hospital care, physician and clinical services and nursing home care all down low- to mid-single digits. What this demonstrates is that the pandemic has resulted in a shift in referral patterns, with more patients, families, physicians and discharge planners choosing home health over more costly and potentially higher-risk concrete care settings.”
Keith G. Myers, Co-Founder, CEO & Chairman – LHC Group Q4 2020 Earnings Call Transcript
“The most complex issue facing VITAS over the past 9 months has been the disruptive impact the pandemic has had on traditional hospice referral sources, which, in turn, has impacted our patient census patterns. Fortunately, the portions of the health care continuum have — certain portions have normalized, and hospital referral and admissions have significantly improved from low admission rates experienced early in the pandemic … Despite the admissions growth, our average daily census declined 2.8% in the fourth quarter. This decline in census is a direct result of disruption in senior housing, which includes nursing homes and assisted living facilities.”
Kevin J. McNamara, President & Director – Chemed Corporation Q4 2020 Earnings Call Transcript
“We’ve kind of had to switch the playbook a bit. And go back to what we did in hospice and identify targets we like and go pursue them. We’ve got a great pipeline … I think there will continue to be people we hear rumors every day, much more of assets being snapped up. There was some news this morning. There was some news last night. I think people are understanding the home is a place where you need to be. And I think there will be diversified companies that will try to get into this space, and we will see how they do. I think one of the great things about this industry is — both industries as they are so highly fragmented …. So, I think there will be a lot more activity. My guess is there will be a couple of IPOs out there. We hear rumors on it. Again, they’ll compare themselves to us. We will see how they do. And we welcome the competition.”
Paul Berthold Kusserow, President & CEO – Amedisys, Inc. Q4 2020 Earnings Call Transcript
“[Demographics are] strongly in our favor with the baby boomers creating a potential surge of patients in the coming year, with more people turning 65 years old than ever before. The burgeoning 75-plus population, coupled with ever-increasing unsustainable health care costs puts us in a very advantageous position as an at-home, aging-in-place company, delivering the highest quality care at the lowest cost to seniors. Keep in mind, over 9 out of 10 baby boomers want and expect to be able to age and die at home. According to CMS’ public projections and based on current law, both home health and hospice are in line for positive rate updates, well into the future. Given the low-cost and high-quality nature of our businesses, this makes a lot of sense.”
Paul Berthold Kusserow, President & CEO – Amedisys, Inc. Q4 2020 Earnings Call Transcript
“COVID-19 continues to adversely affect senior housing occupancy … The guidance we will provide later in this call reflects this continued weakness in senior housing occupancy for the first half of 2021. We anticipate improvement in senior housing admissions in the second half of 2021 as senior housing patient mix and aggregate occupancy returns to pre-pandemic levels.”
Kevin J McNamara, President & Director – Chemed Corporation Q4 2020 Earnings Call Transcript
Behavioral Health
“With our singular focus now on our U.S. operations and increased financial flexibility, we intend to make strategic investments in 4 distinct growth pathways: bed expansions; de novo facilities; partnering with health systems; and through strategic M&A. Together, these growth pathways will provide additional opportunities for Acadia to reach more patients in new and existing markets. We expect that our multiple pathways will provide a 10% EBITDA growth rate over the next 5 years … And I think that it looks from just the pipeline that there are opportunities not only for the tuck-ins, but perhaps going forward, some of the larger M&A that might come to market.”
Debra K. Osteen, CEO & Director – Acadia Healthcare Company, Inc. Q4 2020 Earnings Call Transcript
“…I think we have a strong belief that the biggest impact on our behavioral volumes in 2020 has been COVID and COVID-related dynamics. And when those dynamics ease in 2021, behavioral volumes should resume to pre-pandemic levels. And quite frankly, we believe potentially higher than pre-pandemic levels because we think that the underlying demand for behavioral care has been increasing.”
Steve G. Filton, Executive VP, CFO & Secretary – Universal Health Services, Inc. Q4 2020 Earnings Call Transcript
“We see opportunities again in behavioral health where we have delivered value in that category. It’s not really post-acute. But again, it’s connected to our system. A lot of our patients have behavioral health needs, many of which we can take care of, but there are opportunities for us to add programs and add capacity in some markets to deal with some of the mental health challenges that exist across the country.”
Samuel N. Hazen, CEO & Director – HCA Healthcare Inc. Q4 2020 Earnings Call Transcript
Clinical Laboratories, Diagnostic Imaging & Other
“We are seeing more opportunities for [hospital laboratories]. We’re spending a lot more time in discussions with various hospitals and local laboratories. And I can tell you, even as a senior management team, we’re spending a lot more time in those discussions ourselves. So, I feel good that there will be multiple opportunities as we go through this year … Hospitals have realized how capital intensive this business is. So many hospitals had to update their labs to be able to do COVID testing at any scale. And as they start to look at keeping those labs updated outside of COVID, they realize they probably need to do some additional upgrading to the equipment. So, they’d rather use that capital, for example, for a new surgery suite versus having to just update the lab to run the test that they’ve done in the past.”
Adam H. Schechter, President, CEO & Chairman – Laboratory Corporation of America Holdings Q4 2020 Earnings Call Transcript
“I expect this will be a busy year for us. And so we’re selective with what we’ll open, but I expect somewhere in the mid-20s this year in terms of de novo openings, which kind of gets us back to where we were before. Maybe we’ll be a little better than that, maybe a little lighter, but that’s what I expect at this point.”
Christopher J. Reading, President & CEO – U.S. Physical Therapy, Inc. Q4 2020 Earnings Call Transcript
“Our guidance ranges for 2021 are built with this run rate in mind and the assumption that our business will continue to strengthen as COVID-19 restrictions are lifted in the states in which we operate. We believe there is upside to our guidance ranges, which could result from accretive tuck-in acquisitions we expect to complete during the year, further benefit from the cost reduction measures implemented in 2020, increases in reimbursement from private and capitated payers and the expansion of our joint venture initiatives.”
Mark D. Stolper, Executive VP & CFO – RadNet, Inc. Q4 2020 Earnings Call Transcript
“The pandemic has created an additional effort on the part of payors to further encourage and help direct business away from hospitals. A number of the major payors have either reiterated or announced their reimbursement preferences for outpatient imaging centers to the point where they may not pay for some of the routine imaging that are done in hospital systems both at not only higher cost, but now with the pandemic still upon us, a less comfortable place for patients to go. So we believe both of those issues will create additional volume directed to outpatient facilities in general and ours in particular.”
Howard G. Berger, Chairman, President, CEO & Treasurer – RadNet, Inc. Q4 2020 Earnings Call Transcript
Payors: In-Person vs. Telehealth Care
Payors are responding to a unique year in 2020 where medical care was often deferred or delayed due to COVID and, as a result, telehealth usage surged. The manner in which patients prefer to interact with providers and the settings in which patients wish to receive care are factors that are driving how payors look to support and document patients’ medical conditions, as well as the shift in provider arrangements towards more value-based care. Additionally, management sentiment indicates that payors expect COVID treatment costs to be relatively similar in 2021 compared to 2020, despite vaccine rollout.
” First, telehealth, if you use audio and video today, can support documentation. So that is possible and regulatorily came into place the latter part of last year. So it is a way to be able to bring documentation. The problem is that what we see is, once there is — when someone uses telehealth, they then use it more frequently. And so we see a significant use of telehealth, but the members that are using it are more contained, I should say, or more refined, and it’s not across all our membership. So we could see a significant increase in telehealth, but that increase in telehealth will be over a confined membership base as opposed to across our membership base. ”
Bruce Dale Broussard, President, CEO & Director – Humana Inc. Q4 2020 Earnings Call Transcript
“While we estimate and accrue for the incremental revenue from anticipated submissions as the year progresses, there is a higher degree of uncertainty in our revenue projections compared to a normal year. Let me spend a few minutes addressing the drivers of this increased uncertainty. First, while we worked tirelessly throughout 2020 to ensure members had access to and were receiving the appropriate level of care, including by significantly increasing outreach and availability of in-home care and providing access to video telehealth clinician visits, the meaningful drop in non-COVID medical utilization in November and December was not expected. Those are important months as they round out our ability to drive meaningful clinical interactions with our members, and therefore, the unexpected decline in utilization affected our ability to appropriately document their conditions. Second, the mix of utilization was very different in 2020 relative to prior years. For example, the dramatic increase in the number of telehealth visits from 2019 to 2020, although critical in allowing our members to access care while affording us the opportunity to document their conditions, nonetheless, creates greater uncertainty around the type and volume of diagnoses codes collected. Separately, utilization for in-patient and non-in-patient continued to increase for COVID diagnosis throughout the year. Accordingly, within the mix of submissions from 2020 that drive our 2021 revenue, we also expect organic diagnosis code submissions tied to COVID claims, for which we have limited visibility at this time. These are just 2 examples of how emerging experience in 2020 creates more uncertainty in our MRA revenue projections for 2021 because we are not able to place the same level of reliance on historical trends as compared to a normal year.”
Brian Andrew Kane, Chief Financial Officer – Humana Inc. Q4 2020 Earnings Call Transcript
“As a general rule, we have seen an inverse relationship between COVID treatment costs and levels of non-COVID utilization, as surges in the pandemic led to less nonessential care being sought by our members. While the ratio of COVID treatment to non-COVID depressed utilization has varied, to date, we have seen in our Medicare book that the level of depressed utilization has more than offset the treatment cost. The shape of the COVID case curve is one of the largest drivers of these 2 related factors, and as such, they remain the 2 largest sources of uncertainty for 2021, given the unprecedented nature of the pandemic.”
Brian Andrew Kane, Chief Financial Officer – Humana Inc. Q4 2020 Earnings Call Transcript
“What’s fascinating is not all Telehealth offerings are created equal. And we have found that, not surprisingly, patients really appreciate being connected to their own personal providers, and providers very much need the real-time clinical data to provide good advice and care for that patient in a virtual setting. So that’s key point one. Point two is certain services, like ambulatory or outpatient behavioral health care, lend themselves to a Telehealth solution. And so we have seen approximately 50% of our behavioral health care being delivered in a Telehealth setting, and that has been sustained throughout the year even as the pandemic had subsided. And as it returns, it empowers those populations to get excellent care virtually. Finally, I’ll just add that it’s critical, and we’re very excited about the ability at OptumHealth to connect physical care, virtual care and home-based care in a comprehensive model that really differentiates itself by providing personal, real-time care in the right setting.”
Wyatt W. Decker, CEO of OptumHealth – UnitedHealth Group Inc. Q4 2020 Earnings Call Transcript
“The outlook for 2021 in terms of COVID impact, though, even with what you’ve cited there in terms of as things were trending in the quarter, still consistent with where we were at an investor conference, that our expectation is that total direct COVID-19 care costs in 2021 will be similar to that we experienced in — for full year 2020. So there isn’t anything that would take us off that view right now. I think the other element we cited, though, total COVID-19 care costs higher and then the headwind being that care deferral likely being meaningfully lower than we saw in 2020.”
John F. Rex, Executive Vice President & CFO – UnitedHealth Group Inc. Q4 2020 Earnings Call Transcript
Future Forecast
During Q4 earnings calls, healthcare operators shifted their sentiment toward a cautious return to normalcy. As vaccinations continue their rollout and patient volumes resume utilization levels observed in early 2020, both payors and providers are optimistic heading into 2021. While certain aspects of the healthcare system have changed (e.g., telehealth), much of the commentary was focused on resuming business as usual – including continued consolidation and the return of capital investments into important strategic projects.
Categories:
Key Takeaways from the Medscape Physician Compensation Report 2021
April 26, 2021
Written by Caroline Dean and Bartt B. Warner, CVA
As the COVID-19 pandemic presented unique challenges for healthcare providers and beyond, physician compensation has mostly trended back toward pre-COVID levels per the Medscape Physician Compensation Report 2021 (“Medscape Report”). According to the Medscape Report, which included information from 17,903 physicians in over 29 specialties, average salaries for primary care physicians (“PCPs”) decreased slightly from $243,000 in the prior year to $242,000, and specialists’ fell just $2,000 from $346,000 in 2020 to $344,000 in early 2021. According to Michael Belkin, JD who is a divisional vice president at Merritt Hawkins & Associates, “Many physicians used the Paycheck Protection Program to help keep them afloat; some were able to renegotiate their lease contracts; a large percentage reduced their staff, which reduces their expenses; and those in capitated plans were getting paid even though they weren’t seeing as many patients. Additionally, the acceleration of telehealth – and more insures paying for it – helped physicians during this time.” The Medscape Report contains comprehensive data taken from October 2020 to February 2021 comprised of physicians’ salaries, bonuses, hours worked, and specific challenges faced over the past year. The following paragraphs detail some of the key takeaways from the Medscape Report.
Impact of COVID-19
While physician compensation has generally remained steady as compared to the Physician Compensation Report 2020, many specialties did have noticeable changes. For example, Plastic Surgery saw a 10% increase in average compensation as the boom in video conferencing may have led many to seek out cosmetic procedures. On the other side, Otolaryngology and Allergy and Immunology physicians saw a 9% decrease in average compensation as large numbers of lower acuity patients avoided healthcare facilities altogether.
According to the Medscape Report, 92% of the physicians who realized a decline in income attributed the decline to the COVID-19 pandemic. Specifically, due to job loss, reduction in hours and a reduction in patient volume. In addition, 13% of physicians struggled through a temporary period of no earnings with an average length of time of having no income at 3 months. However, it should be noted that 45% of physicians reported they did not realize negative financial or practice-related effects due to the pandemic.
Physician compensation was not the only area which saw an impact as 22% of physicians surveyed saw a decrease in their hours worked. However, likely due to the growing number telemedicine providers and the return of elective procedures, 58% of PCPs and 65% of specialists have seen their hours return to prior year levels. Per the Medscape Report, physicians averaged 51 hours per week as opposed to the 50 detailed in the 2020 report.
Despite working relatively the same number of hours per week, around 54% of survey respondents have seen a reduction in patient volumes ranging from 1% to 76% or more as many practices were forced to close or lay off staff due to financial struggles amidst the pandemic. Dermatology and Ophthalmology were hit the hardest and safety protocols, social distancing mandates, disinfecting areas and answering patient questions also contributed to the decline in patient volumes. However, according to Halee Fischer-Wright, M.D., president and CEO of the Medical Group Management Association, we are likely to see an increase in patient volumes because of deferred care over the past year and an increase in hiring at medical practices, according to the report.
Gender Differences
Similar to prior years’ results, large compensation gaps exist amongst men and women physicians. Specifically, men in primary care on average earned $269,000, whereas women earned $211,000, up from the 25% gap detailed in the 2020 survey. Furthermore, male specialists earned 33% more than female specialists, up from 31% in the 2020 survey. Per the survey respondents, women make up less than 20% of the physicians in the higher paying specialties such as: Cardiology, General Surgery, Orthopedics, Plastic Surgery and Urology.
Rewards and Challenges
Challenges for physicians were abundant in the latter part of 2020 and early 2021. 23% of survey respondents detailed that the most challenging part of their job was the many rules and regulations associated with patient care dictated by boards and insurance providers. 7% detailed the risk associated with treating COVID-19 patients as a major challenge. However, physicians noted that the two most rewarding parts of their job was knowing that they were making the world a better place and gratitude/relationships with patients.
Conclusion
The Medscape Report detailed a multitude of challenges physicians have endured over the past year. However, physician compensation appears to be normalizing as patient volumes increase and elective cases resume. However, the gender pay gap saw an increase and physicians continue to face hardships with substantial administrative work and rules and regulations. Physician shortages will continue to be an issue and may be heightened as a quarter of the respondents will not or at least have second thoughts about taking Medicare or Medicaid patients. Lastly, due to the large amount of physician practices closing due to the COVID-19 pandemic, there is the potential for a surge in physician employment as physicians may be weary of re-opening their practices.